1301
Quantitative Evaluation of Vertebral Marrow Fat content with Aging in Healthy Human using MRS and Dixon technique1Master 's Program of Biomedical Informatics and Biomedical Engineering, Feng Chia University, Taichung City 407, Taiwan, 2Program of Electrical and Communications Engineering, Feng Chia University, Taichung City 407, Taiwan, 3Department of Automatic Control Engineering, Feng Chia University, Taichung City 407, Taiwan, 4Department of Diagnostic Radiology, The University of Hong Kong, Hong Kong, Hong Kong, Hong Kong, Hong Kong, 5Department of Radiology, Taipei Medical University-Wan Fang Hospital, Taipei, Taiwan, Taipei, Taiwan
Synopsis
Subjects with osteoporosis have increased fat marrow, and fat content also increases progressively in the normal aging people. Although MRS has shown the potential probing the bone marrow content characteristics of the vertebra body in previous studies, all of them were a ROI analysis and loss local information. The purposes of this study were using MRS and Dixon technique to investigate the change of fatty marrow content with aging in human vertebra body. Our results have demonstrated the water-fat separation could quantitate vertebral marrow adiposity, which will be a potential method to provide local information for osteoporosis-related research fields.
Introductions
Osteoporosis is a disease characterized by lost bone density and increased bone fragility, and consequently susceptibility to fracture. It is a widespread disease, affecting one in 4 women and one in 8 men older than 50 years1 . There are two types of bone marrow in vertebra body. One is medulla ossium rubra (red marrow), which consists mainly of hematopoietic tissue, and the other is medulla ossium flava (yellow marrow), which is mainly made up of fat cells. Subjects with osteoporosis have increased fat marrow, and fat content also increases progressively with age2 [1]. Using MR spectroscope technique (MRS), some studies have described a decrease in bone perfusion is associated with a corresponding increase in vertebral marrow fat content3-5 . Although MRS has shown the potential probing the bone marrow content of the vertebra body in previous studies6 , all of them were a ROI (whole vertebra body) analysis only and loss local information for bone marrow content. Recently, water-fat separation by multi-point Dixon IDEAL (iterative decomposition of water and fat with echo asymmetry and least-squares estimation) techniques have widened the field of utilization, a water-only image and a fat-only image computed by pixel-by-pixel7 . The purposes of this study were using MRS and Dixon technique to investigate the change of fatty marrow content with aging in human vertebra bodyMethods
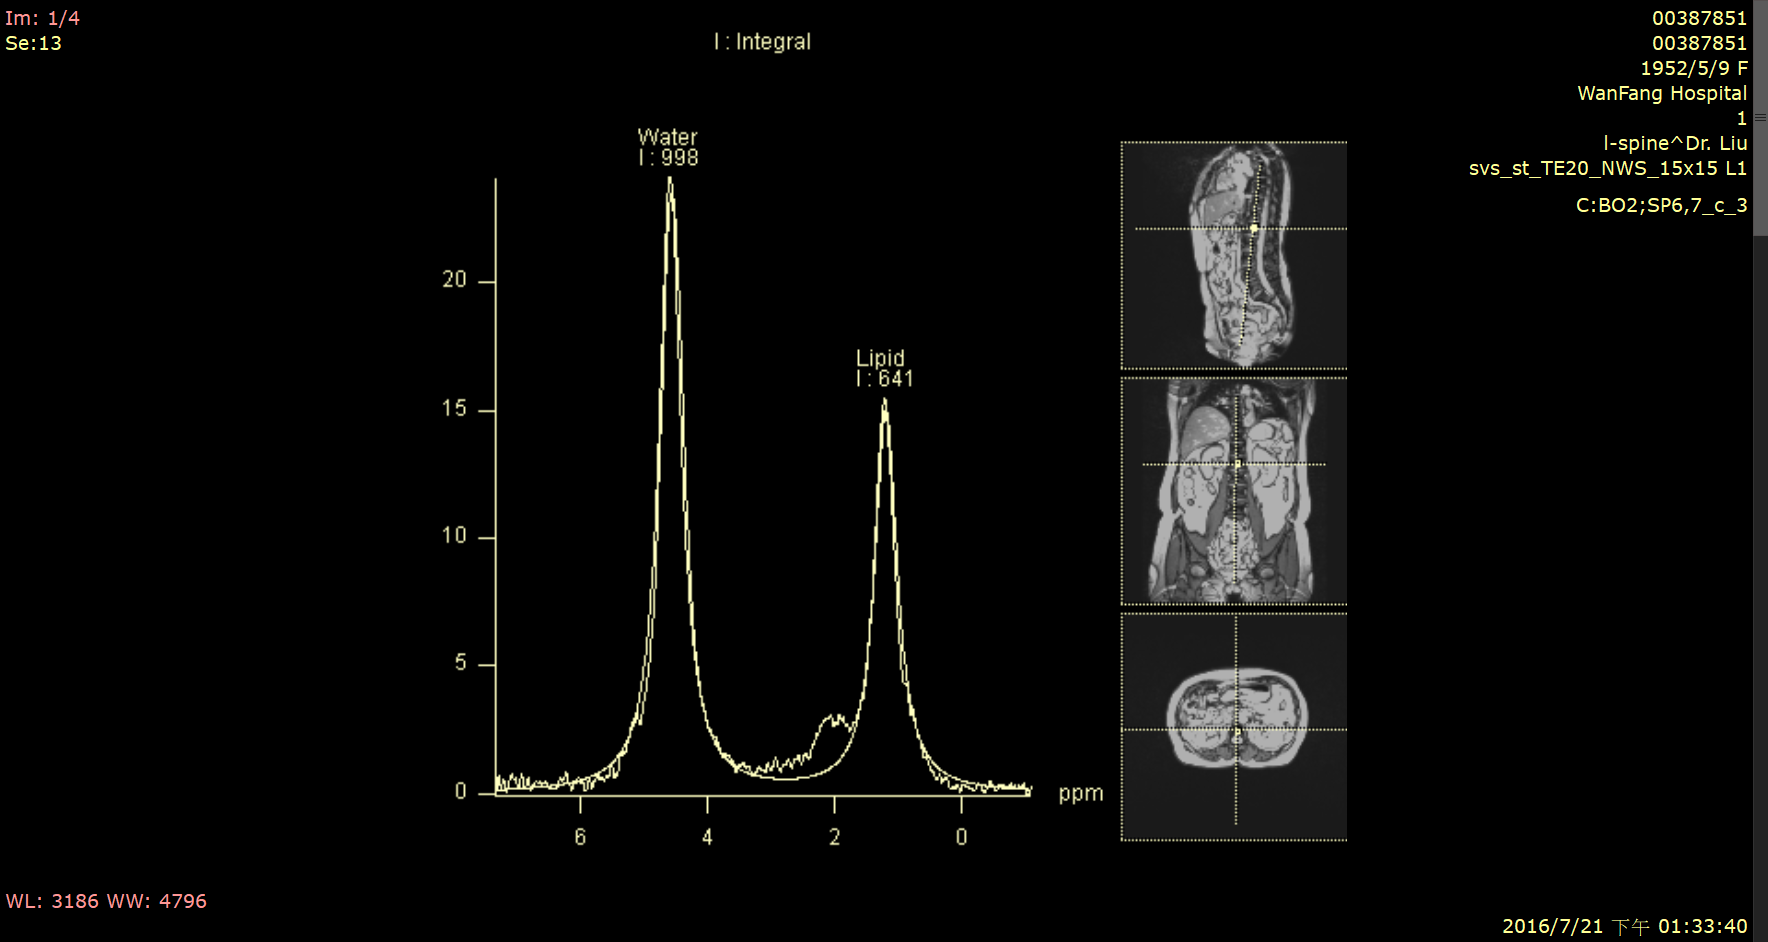
This study enrolled 63 healthy subjects (age range 20-86 years; 31 male, 32 female) and images were performed in 1.5T MRI scanner (Siemens, Avanto). Two axial gradient-echo images on L1 and L2 for sequential acquisitions at six TEs were used for 6- pt IDEAL reconstruction with the scanning parameters: TR=43 ms; TE=1.9/4.5/7.8/10.6/13.3/16.1 ms; flip angle=5⁰; FOV=300 x 290 mm ; matrix size=256 x 248; slice thickness =10 mm. To verify the water-fat components of vertebra, the STEAM 1H-MRS sequence without water suppression on the center of L1 and L2 vertebra (TR/TE 2000/20 msec, bandwidth 1 kHz, data points 512, NEX 64, 2:16 minutes, voxel size: 1x1x2cm ). To verify the normal bone mineral densities for each subject, a DXA examination (Lunar Prodigy, version 9.1; GE Healthcare, Madison, WI) of the lumbar region (L1 through L4) was performed in each subject following the MR imaging examination. The MRS data was analyzed by the software at Siemens MRI console. Manually selected resonance frequency and line width of water (4.65 ppm) and fat (1.3 ppm) peaks were used as starting values in the nonlinear curve fitting algorithm. The data of DIXON images were analyzed with pixel-by-pixel by an in-house-developed software written in MATLAB (The MathWorks, Inc.). The fat ratio is given as relative fat signal intensity in percent of total signal intensity I /(I +I )x100%. The ROI was placed on whole vertebral body, mean fat ratio in MRS and Dixon technique were averaged from whole ROI. Statistical analysis was performed by using SPSS 12.0 (SPSS, Chicago, III) software. Wilcoxon signed-rank test and Mann-Whitney U test were used for comparison. A P value less than 0.05 was considered as statistically significant.Results
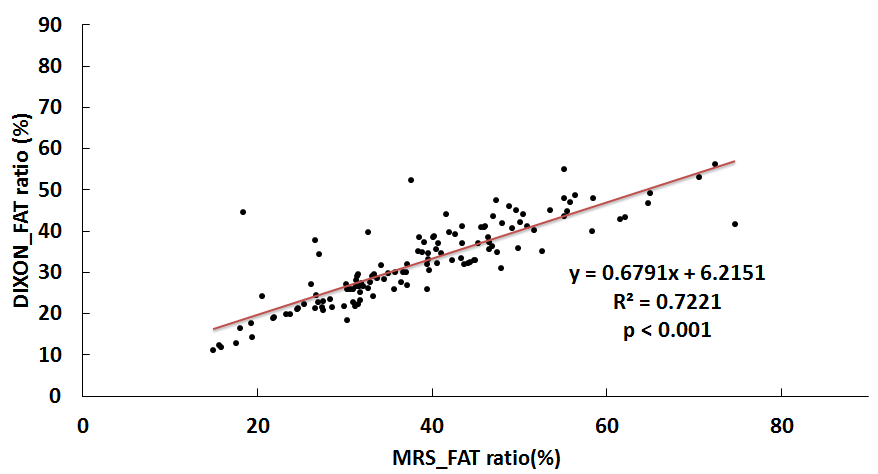
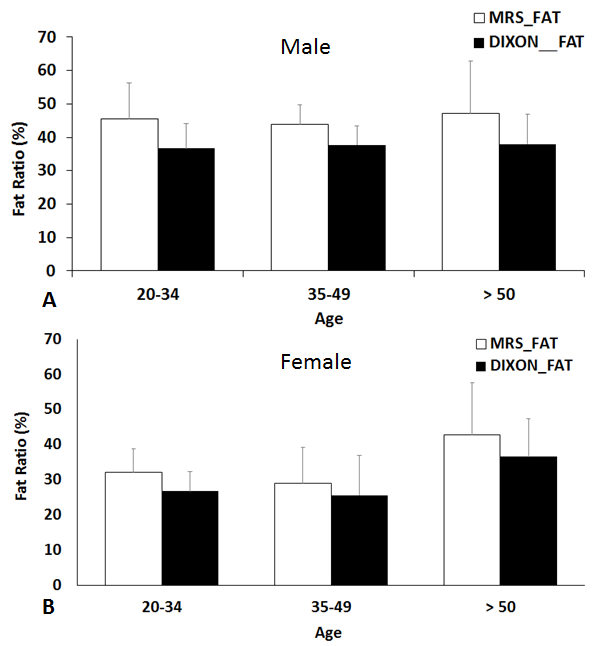
In this study, subjects were grouped into three categories according to their age, 20~34, 35~49, and older than 50 (>50). In males group, there were 13, 12 and 6 men in 20~34, 35~49 and >50 groups, respectively. In females group, there were 13, 14 and 6 women in 20~34, 35~49 and >50 groups, respectively. Fig. 1 illustrates the content of water and fat at 1H-MRS spectrum in vertebra. Fig. 2 shows the fat ratio and water ratio. The vertebra fat contents measured by 6-pt IDEAL were significantly correlated with that measured by MRS with a high correlation coefficient 0.85 (P < 0.001) (Fig. 3). Fat ratios measured by MRS and Dixon were illustrated on Fig. 4. The significant higher fat ratio in the group of older than 50 years old was found in females group.Discussion
Our results show the fat ratio by MRS are proportional to the fat ratio by six-echo Dixon IDEAL. The result suggests the fat content from 6-pt IDEAL is reliable. Fat ratio is no significant difference among three age group in males, but fat ratio in older than 50 years old is significant higher than others in females for MRS and Dixon IDEAL.Conclusions
The results of this study have demonstrated the water-fat separation could quantitate vertebral marrow adiposity with excellent reproducibility, which will be a potential method to provide local information for osteoporosis-related research fields.Acknowledgements
The study was supported partly from the Ministry of Science and Technology, R. O. C. under the Grant No. MOST 105-2221-E035 -049 -MY2 and MOST 103-2320-B-038 -005 -MY3.References
1. Alagiakrishnan K, Juby A, Hanley D, Tymchak W, Sclater A. Role of vascular factors in osteoporosis. J Gerontol A Biol Sci Med Sci 2003;58:362–366.
2. D. Vanel, C. Dromain, and A. Tardivon, "MRI of bone marrow disorders," Eur Radiol, 2000, vol. 10, pp. 224-9.
3. J. F. Griffith, D. K. Yeung, G. E. Antonio, S. Y. Wong, T. C. Kwok, J. Woo, et al., "Vertebral marrow fat content and diffusion and perfusion indexes in women with varying bone density: MR evaluation," Radiology, 2006, vol. 241, pp. 831-8.
4. H. T. Ma, J. F. Griffith, D. K. Yeung, and P. C. Leung, "Modified brix model analysis of bone perfusion in subjects of varying bone mineral density," J Magn Reson Imaging, 2010, vol. 31, pp. 1169-75.
5. T. T. Shih, C. J. Chang, C. Y. Hsu, S. Y. Wei, K. C. Su, and H. W. Chung, "Correlation of bone marrow lipid water content with bone mineral density on the lumbar spine," Spine, 2004, vol. 29, pp. 2844-50.
6. Griffith JF, Yeung DK, Antonio GE, Lee FK, Hong AW, Wong SY, Lau EM, Leung PC. Vertebral bone mineral density, marrow perfusion, and fat content in healthy men and men with osteoporosis: dynamic contrast-enhanced MR imaging and MR spectroscopy. Radiology. 2005 Sep;236(3):945-51.
7. Kim H, Taksali SE, Dufour S, Befroy D, Goodman TR, Petersen KF, Shulman GI, Caprio S, Constable RT. Comparative MR study of hepatic fat quantification using single-voxel proton spectroscopy, two-point dixon and three-point IDEAL. Magn Reson Med. 2008 Mar;59(3):521-7.
Figures