1299
Optimal flip angle for imaging and T2* mapping of the human skull using ultra-short echo-time (UTE) imaging1Medical Physics Group, Institute of Diagnostic and Interventional Radiology, Jena University Hospital - Friedrich Schiller University Jena, Jena, Germany, 2Michael Stifel Center for Data-driven and Simulation Science Jena, Friedrich Schiller University Jena, Jena, Germany, 3Abbe School of Photonics, Friedrich Schiller University Jena, Jena, Germany, 4Center of Medical Optics and Photonics, Friedrich Schiller University Jena, Jena, Germany
Synopsis
To investigate the influence of the flip angle on imaging and T2* mapping of the human skull, multi-echo 3D ultra-short echo-time (UTE) imaging was performed for multiple flip angles ranging from 5° to 49°. Results based on difference images between two echoes indicate that higher flip angles are better suited for separating the skull from adjacent tissues. In addition, a strong dependency of the skulls T2* values on the flip angle was observed
Introduction
Direct
imaging of the skull requires application of ultra-short echo-time (UTE)
imaging sequences1 because compact bone has very short T2
relaxation times, so short that no signal remains when using most conventional
MRI techniques. Although imaging of the skull is conveniently performed with
computed tomography; MRI could prove beneficial as an alternative imaging
technique in cases such as: (i) minimizing radiation exposure as, e.g., in
pediatric imaging, (ii) PET-MRI attenuation correction2, or (iii)
quantifying relaxation or other parameters within the skull. This work
investigates the optimal flip angle for separating the skull from surrounding
tissues when using UTE imaging and additionally investigates if the T2*
values of the skull depend on the flip angle.Methods
A radial 3D UTE imaging sequence was used with non-selective hard-pulse excitation and center-out readouts using a spikey ball distribution in k-space1. Four near in-phase echoes were acquired using a multi-echo readout with echo times: 0.17ms, 2.57ms, 4.97ms, 7.37ms. Other parameters were: 128x128x98 acquisition matrix, (200x200x154)mm³ field of view, 1260 Hz/Pixel bandwidth, 10ms TR, 42638 readouts per k-space and fat saturation. This 8 minute long scan was repeated 7 times using flip angles of 5°,10°,15°,20°,30°,40° and 49°. Larger flip angles could not be applied due to limits of the allowed specific absorption rate. Data of 3 adult volunteers with no known pathologies were acquired on a 3T MRI system (PRISMA, Siemens Healthineers) using a vendor supplied 20 channel head coil. Image reconstruction and analysis was performed offline using MATLAB. For image analysis absolute difference images between the magnitude images of the first and second echoes were calculated to separate the fast decaying skull signal from the slower decaying surrounding tissues. A voxel-wise squared mono-exponential fit was performed over all acquired echo times to create T2* maps. Regions-of-interests were placed manually in the center of the skull as well as in homogeneous white matter brain regions across several slices.Results
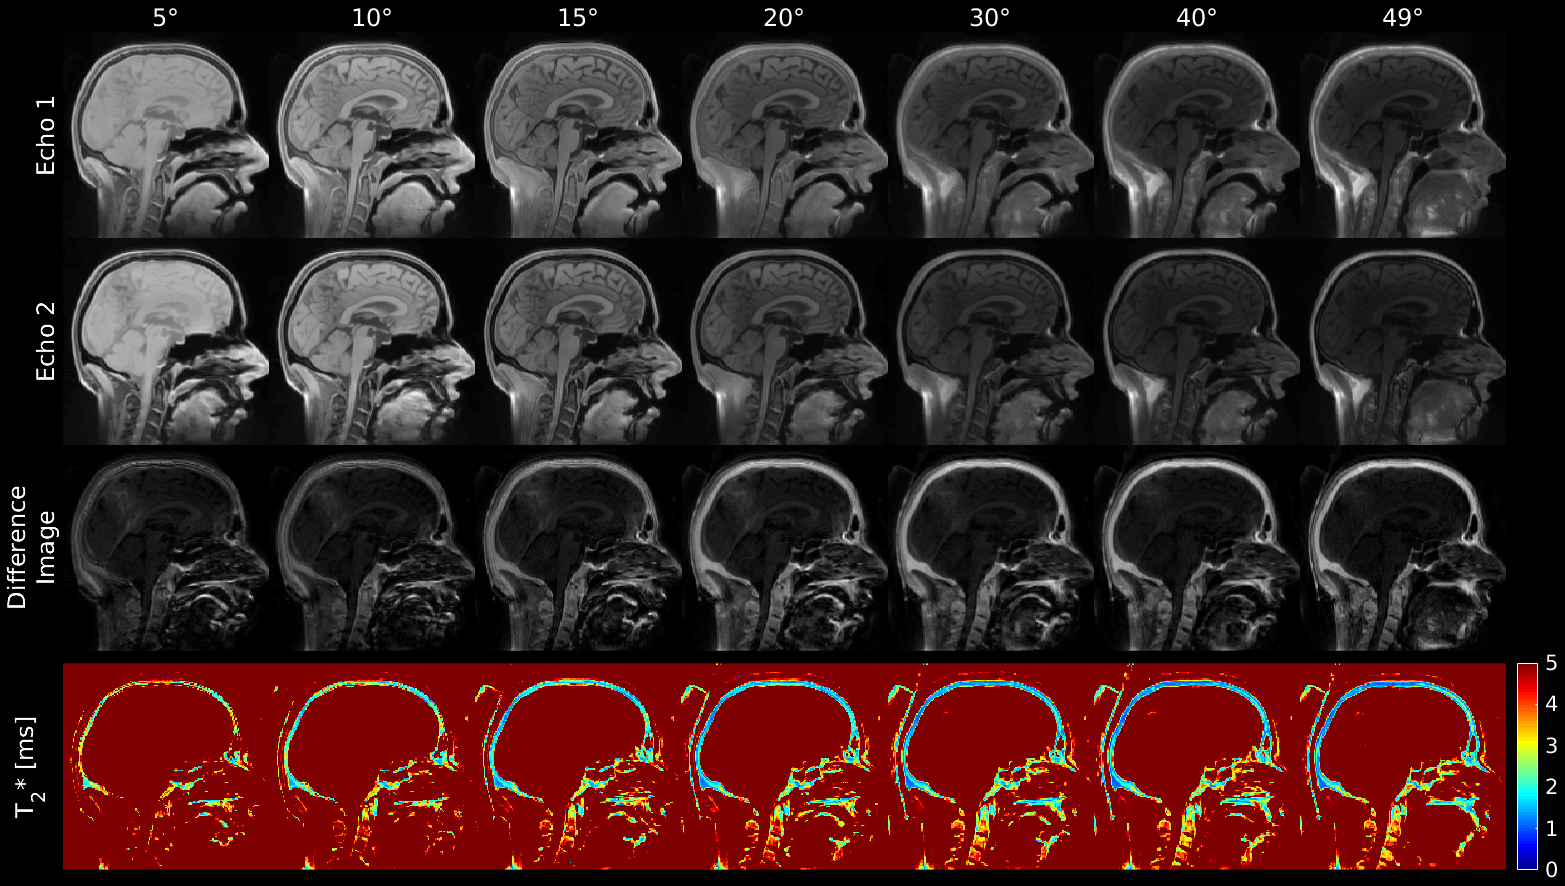
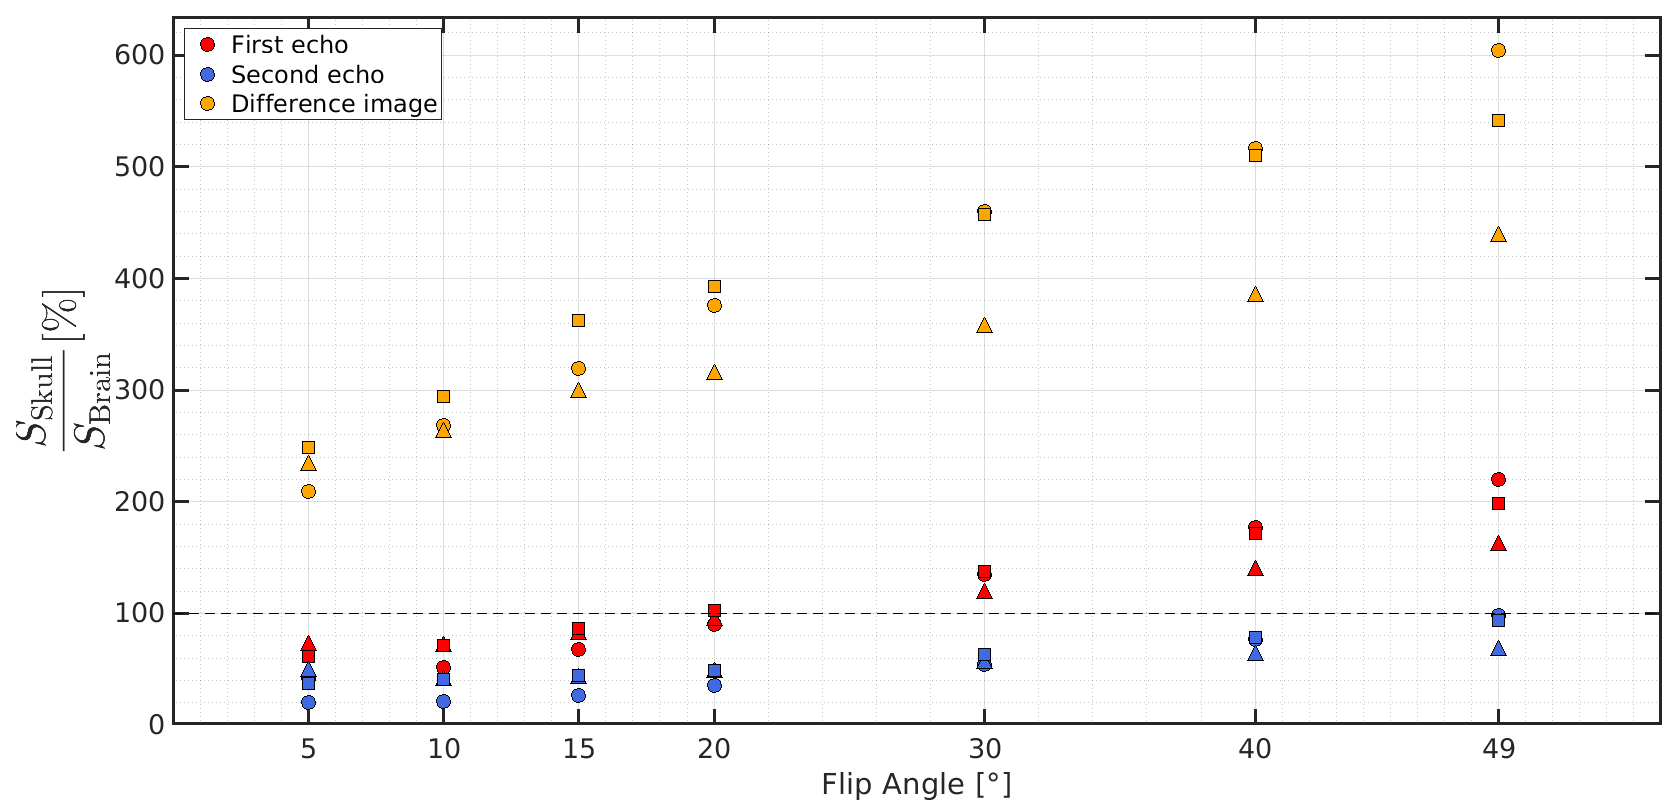
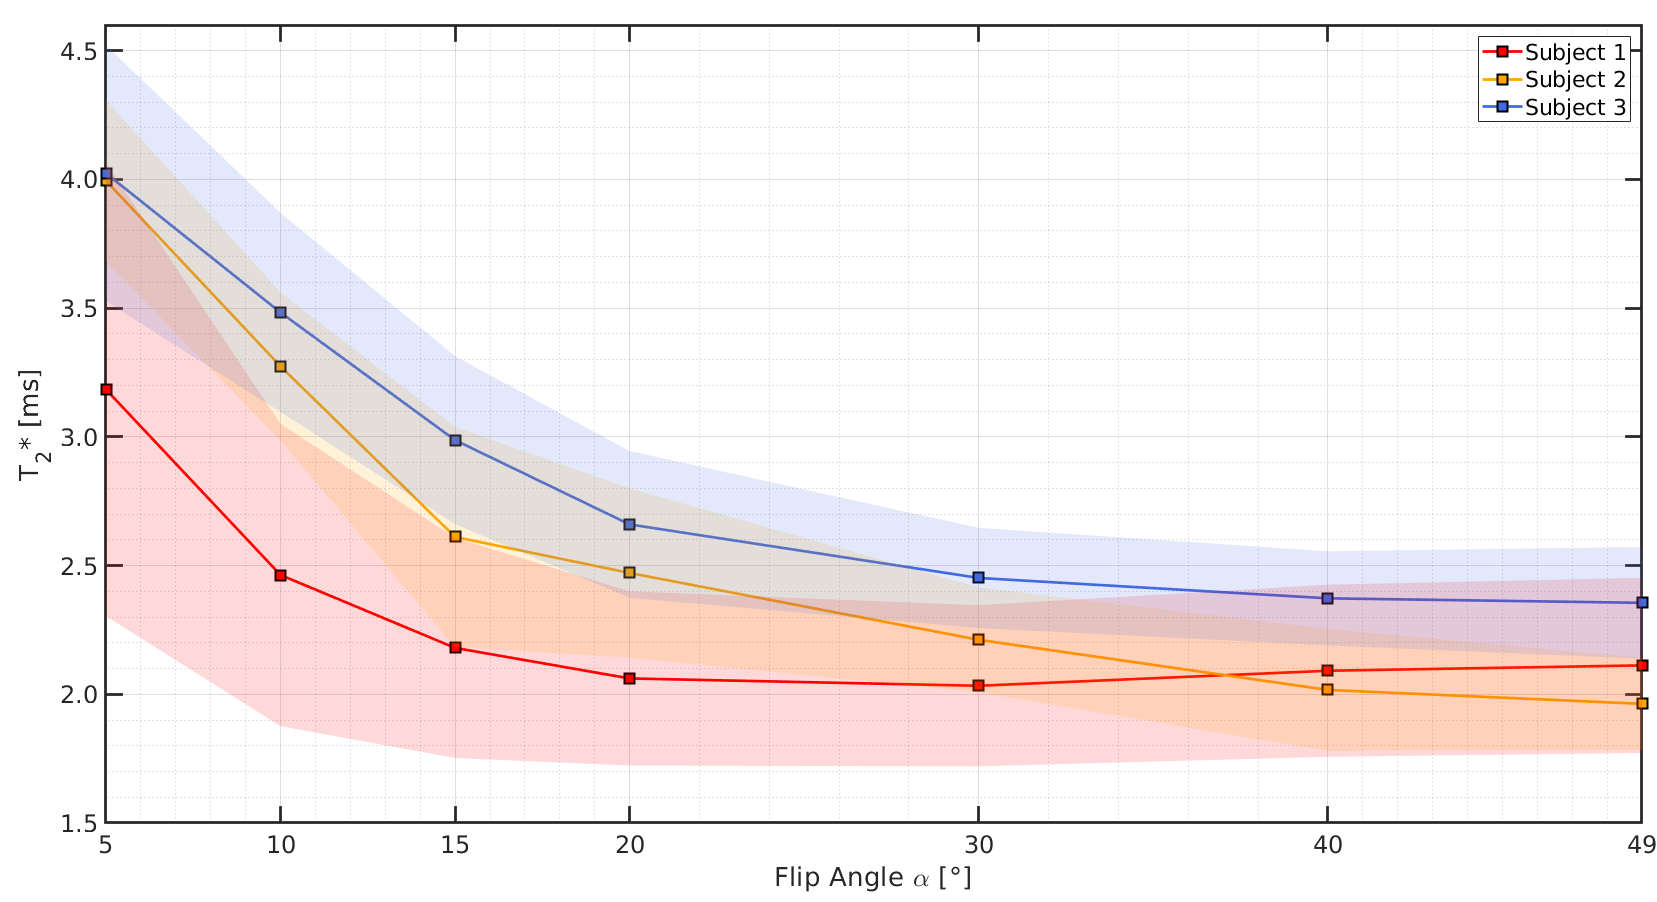
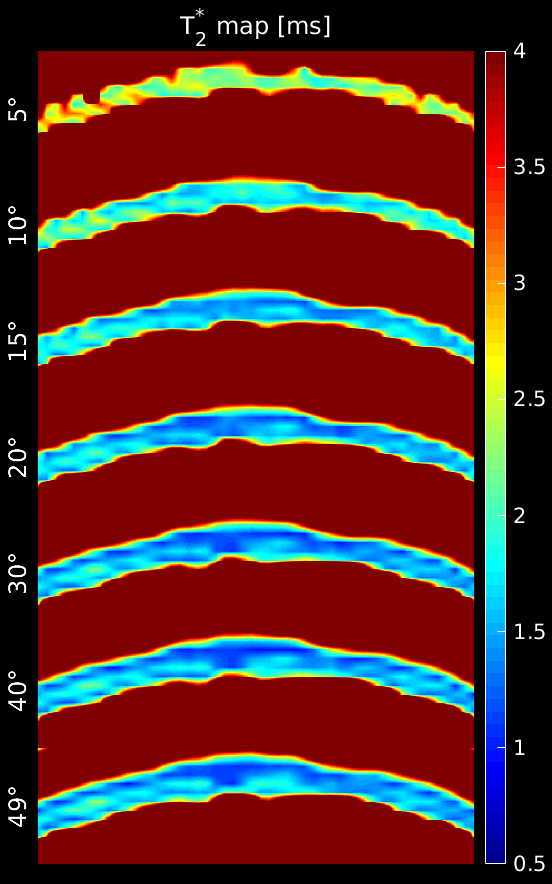
Figure 1 shows imaging results for a single sagittal slice of the head. The magnitude images of the first two echoes reveal the expected change of signal intensity and tissue contrast with increasing flip angle. The contrast in the absolute difference images between the skull and surrounding tissues is weak for small flip angles, but increases with flip angles in such a way that predominantly compact bone structures with short T2* times are visible in the difference images. These observations are also supported by the region-of-interest analysis in Figure 2, which shows the highest increases of the signal ratio between skull and brain for the difference images calculated, ranging from 225% to over 500%. Considering T2* as a function of the flip angle (see Figures 1,3,4), a dependency on the flip angle becomes apparent. The decrease of T2* with flip angle does not appear to be specific to any particular layer of the skull as shown in Figure 4. The largest changes occurred in the flip angle range between 5° and 20°. For flip angles larger than 20° only smaller changes of T2* were observed.Discussion
Varying the flip angle resulted in distinct image contrast changes between the skull and brain tissue as well as changes of the T2* values of the skull. The contrast changes, seen specifically on the difference images, are induced by T1-based saturation effects of tissues with long T1 times, such as brain tissue, with higher flip angles. Tissues with very short T1 times, on the other hand, reach their optimal equilibrium magnetization at higher flip angles. Although we were not able to find exact T1 values for the skull in the literature, results from investigations on the lower leg indicate T1 times for compact cortical bone as short as 80ms3 to 223ms4. The observed decrease of T2* with increasing flip angle can likewise be explained by T1-based saturation effects. If a voxel contains more than one tissue type with different T1 and T2* times, changing the flip angle will change the relative weighting of the signal of these tissue types contributing to the overall voxel signal, thus modifying the measured sum signal as well as the apparent T2* time. As short repetition times and high flip angles over saturate components with long T1 times their contribution on the measured apparent T2* is consequently reduced.Conclusion
With the shown strong dependency of both difference image contrast and T2* on the flip angle acquisition parameters for skull imaging should be chosen carefully. For optimal difference images and T2* maps our results suggest the usage of high flip angles, in the present study of 30° and above for a TR of 10ms.Acknowledgements
No acknowledgement found.References
1. Herrmann KH, Krämer M, Reichenbach JR. Time Efficient 3D Radial UTE Sampling with Fully Automatic Delay Compensation on a Clinical 3T MR Scanner. PLoS One. 2016;Mar14;11(3):e01503712.
2. Wagenknecht G, Kaiser H-J, Mottaghy FM, Herzog H. MRI for attenuation correction in PET: methods and challenges. MAGMA. 2013;Feb;26(1);99-113
3. Springer F, Steidle G, Martisosian P, Sysha R, Claussen CD, Schick F. Rapid assessment of longitudinal relaxation time in materials and tissues with extremely fast signal decay using UTE sequences and the variable flip angle method. Invest Radiol. 2011;46(10);610-6174.
4. Du J, Carl M, Bydder M, Takahshi A, Chung CB, Bydder GM. Qualitative and quantitative ultrashort echo time (UTE) imaging of cortical bone. J Magn Reson. 2010;207(2);304-311
Figures