1298
Discriminating between normal and cam positive hips using MRI texture and gradient-boosted decision trees1Medical Imaging, The Ottawa Hospital, Ottawa, ON, Canada, 2Radiology, University of Ottawa, Ottawa, ON, Canada, 3Information Services, The Ottawa Hospital, Ottawa, ON, Canada, 4Division of Orthopaedic Surgery, The Ottawa Hospital, Ottawa, ON, Canada
Synopsis
Cam-type femoroacetabular impingement (FAI) results in altered biomechanics and acetabular pathology that has been associated with osteoarthritis of the hip. These early changes can be difficult to detect with routine clinical imaging. Texture analysis offers a more quantitative approach for characterizing gray-level patterns. The purpose of this study was to determine the MRI texture profile of acetabular subchondral bone in normal, asymptomatic cam positive and symptomatic cam-FAI hips with the assistance of gradient-boosted decision trees. This work demonstrates that MRI textural features can be used to generate machine learning models that can identify cam positive hips, regardless of symptom status.
Introduction
Cam-type femoroacetabular impingement (FAI) has been associated with osteoarthritis (OA) of the hip. An abnormal contour of the femoral head neck junction due to excessive cartilage, bone, or both, leads to impingement against the acetabulum. This results in altered biomechanics and acetabular cartilage pathology predisposing to OA1. However, these early changes can be too subtle or difficult to detect with conventional radiography or standard MRI. While delayed gadolinium-enhanced MRI of cartilage has been shown to be sensitive to the proteoglycan content and changes to cartilage typified by cam deformity2, this technique requires intravenous injection of gadolinium-based contrast media. Texture analysis offers objective quantitative approach for evaluating gray-level distributions and relationships within tissues, including those that may be imperceptible to the human eye3. It has been recently demonstrated that texture analysis of standard non-contrast MR images of the knee can discern symptomatic OA patients from controls4, as well as predict long-term subchondral bone changes5 and increased risk for incident total knee arthroplasty6. Given that subchondral bone architecture may also play an important role in both the initiation and progression of OA of the hip7,8, the purpose of this study was to determine and compare the MRI texture profile of acetabular subchondral bone in normal, asymptomatic cam positive and symptomatic cam-FAI hips.Methods
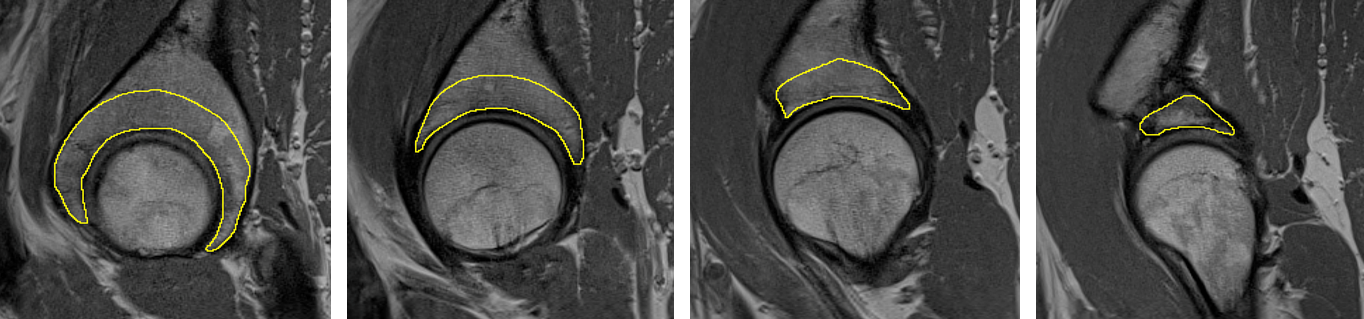
This retrospective case-control study was approved by the local institutional research ethics board. All subjects provided written informed consent. A total of 68 subjects were included: 19 control, and 49 with cam morphology of the proximal femur (26 asymptomatic and 23 symptomatic cam-FAI). All subjects underwent unilateral 1.5T hip MRI without contrast, including acquisition of sagittal proton density weighted fast spin echo images (parameters: TR=3090 ms, TE=15 ms, echo train length=7, slice thickness=3 mm, in-plane resolution= 0.47mm x 0.47mm). The subchondral bone of the entire acetabulum was contoured manually as a volume of interest (VOI) in ImageJ (NIH, USA, http://rsbweb.nih.gov). Contours for a representative subject are provided in Figure 1. Intra-acetabular differences were explored by subdividing each VOI into anterior and posterior segments, generating 2 sub-regions of interest (sROI) per patient. Gray-level histogram, gray-level co-occurrence matrix, and run-length matrix features were evaluated for the global acetabular VOI for each subject using MaZda v4.69. Features were computed in 3D for global VOIs and in 2D for each sROI. XGBoost10 was used to create classifiers (ensembles of gradient-boosted decision trees) trained to discriminate between control and cam positive groups and for differences between sROIs. Bayesian optimization was used to identify optimal hyperparameters (http://github.com/SheffieldML/GPyOpt). For each model, 500 hyperparameter configurations were selected and 10-fold cross validation was performed11. Receiver operating characteristic curves were constructed and the mean area under the curve (AUC), Brier scores, and F1 scores were calculated for each model. Differences between 3D and 2D metrics were assessed using non-parametric comparisons of paired proportions.Results
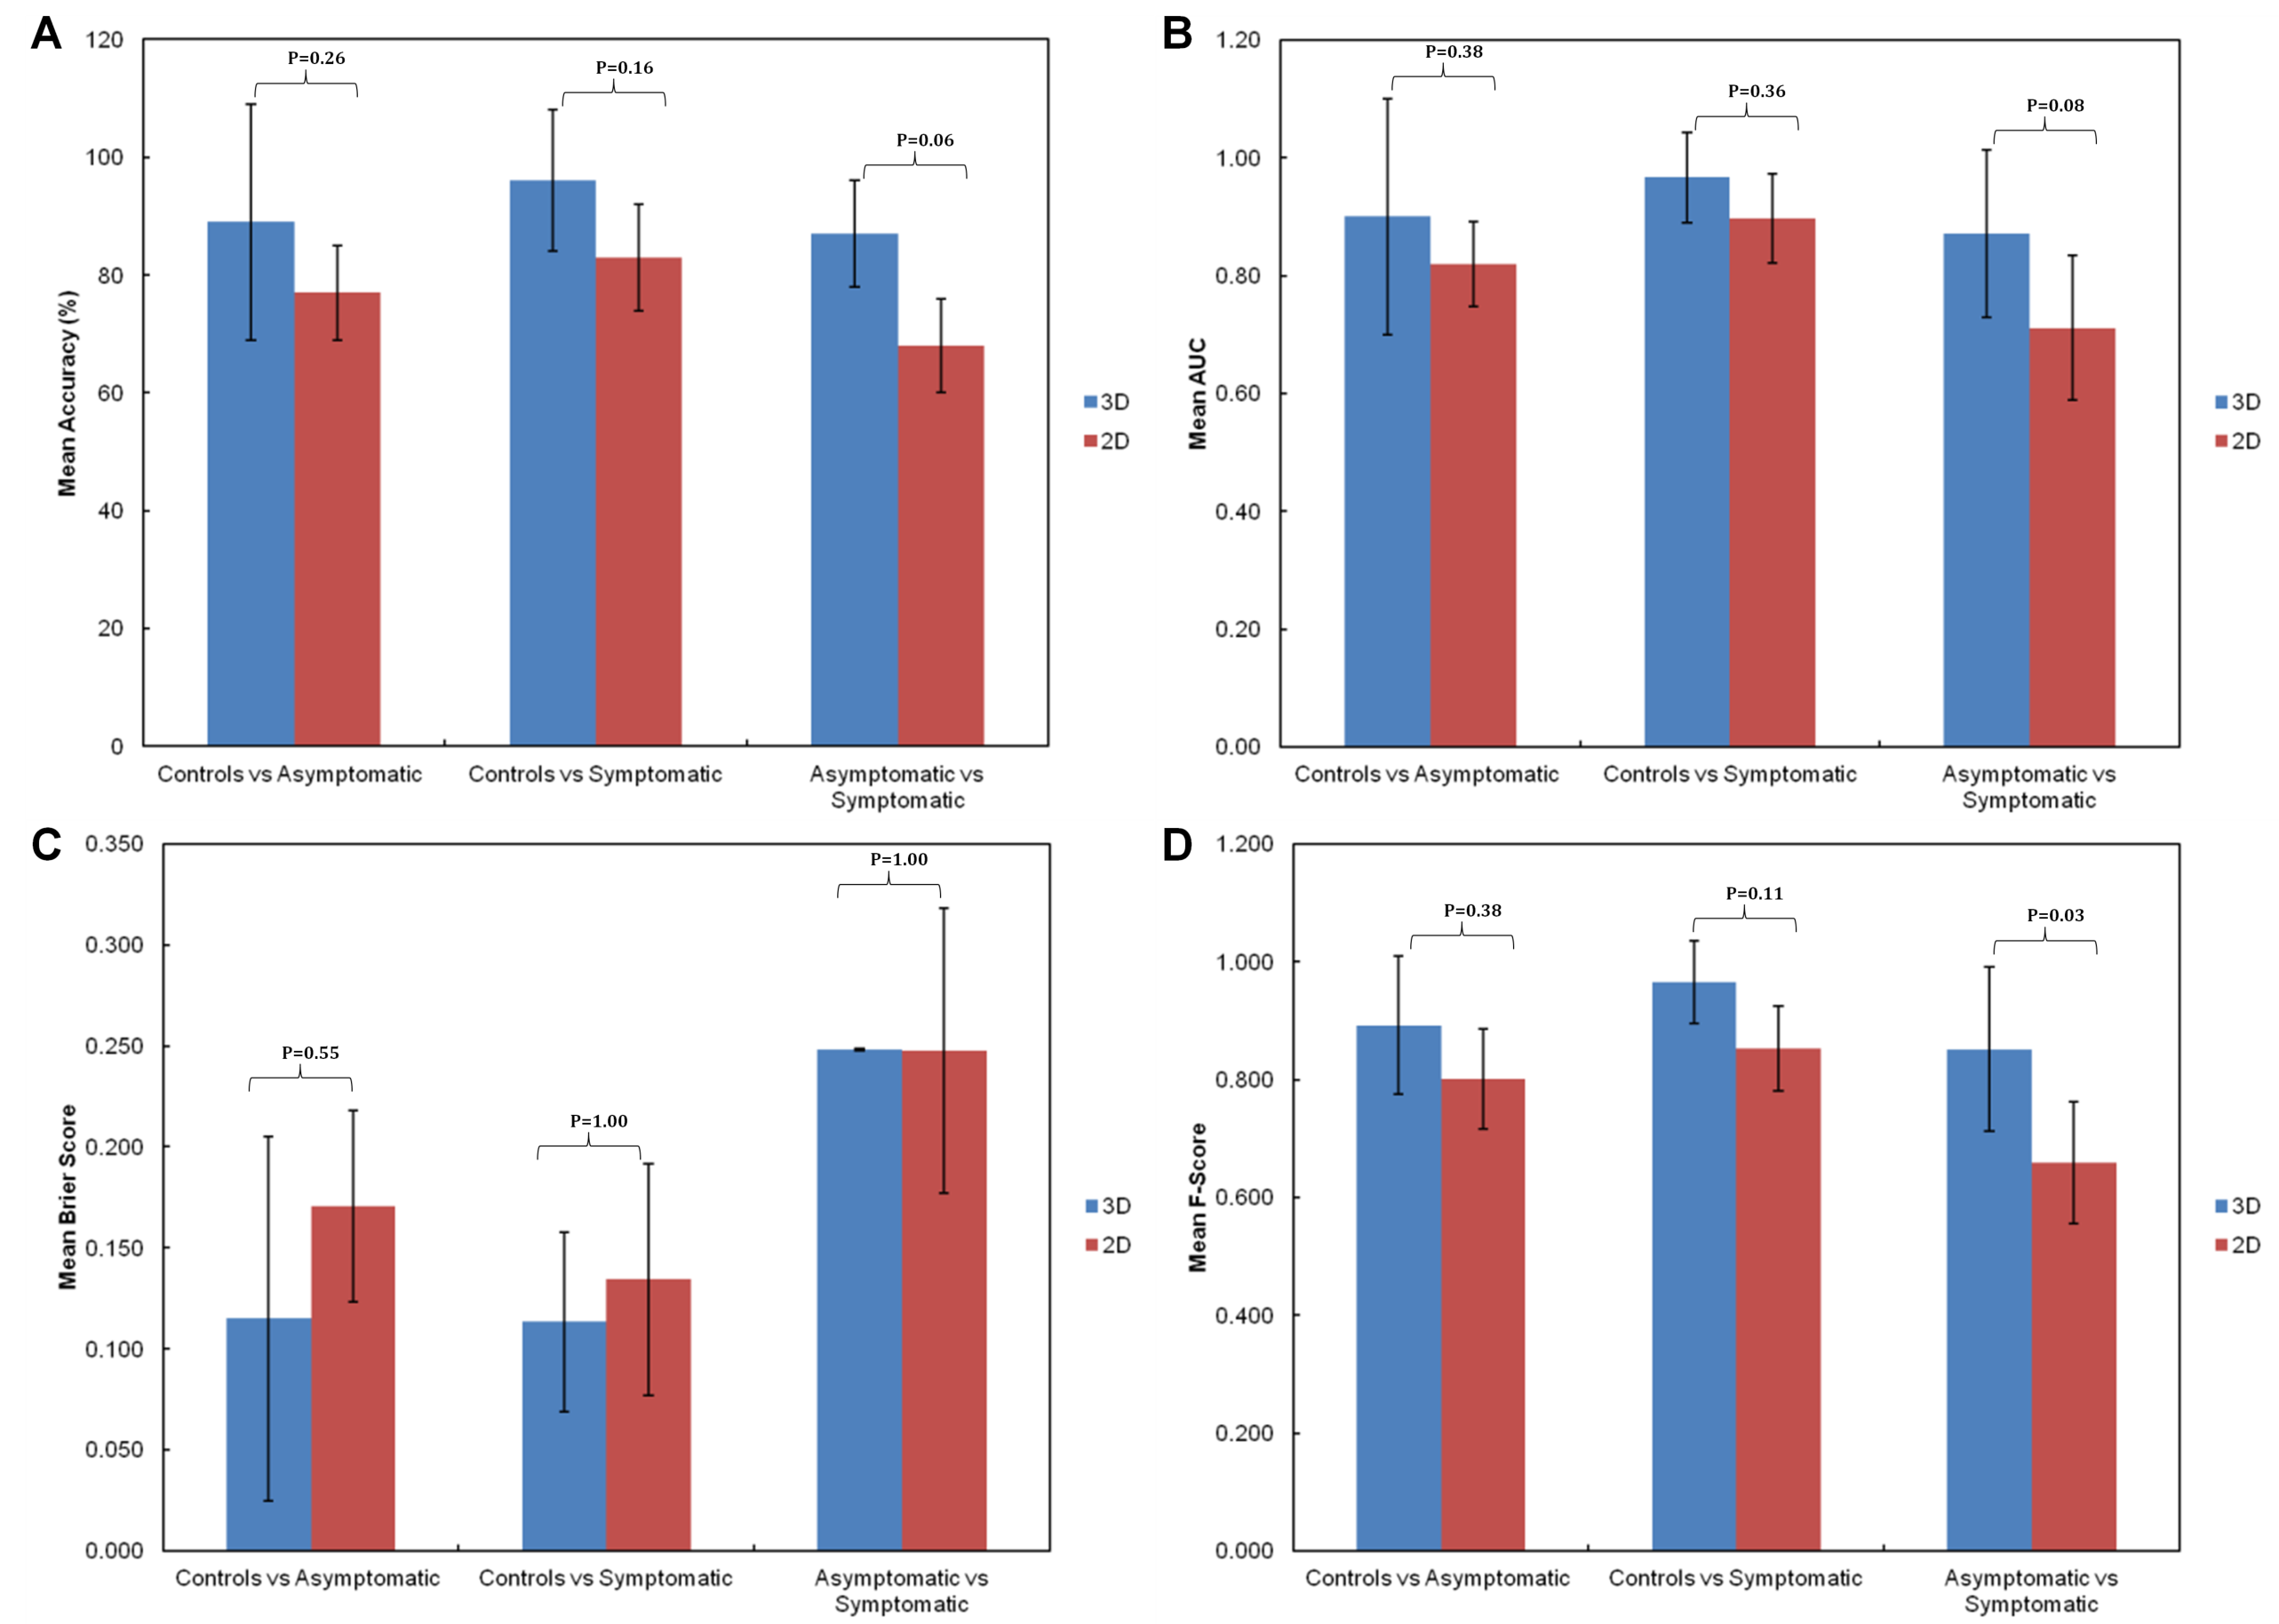
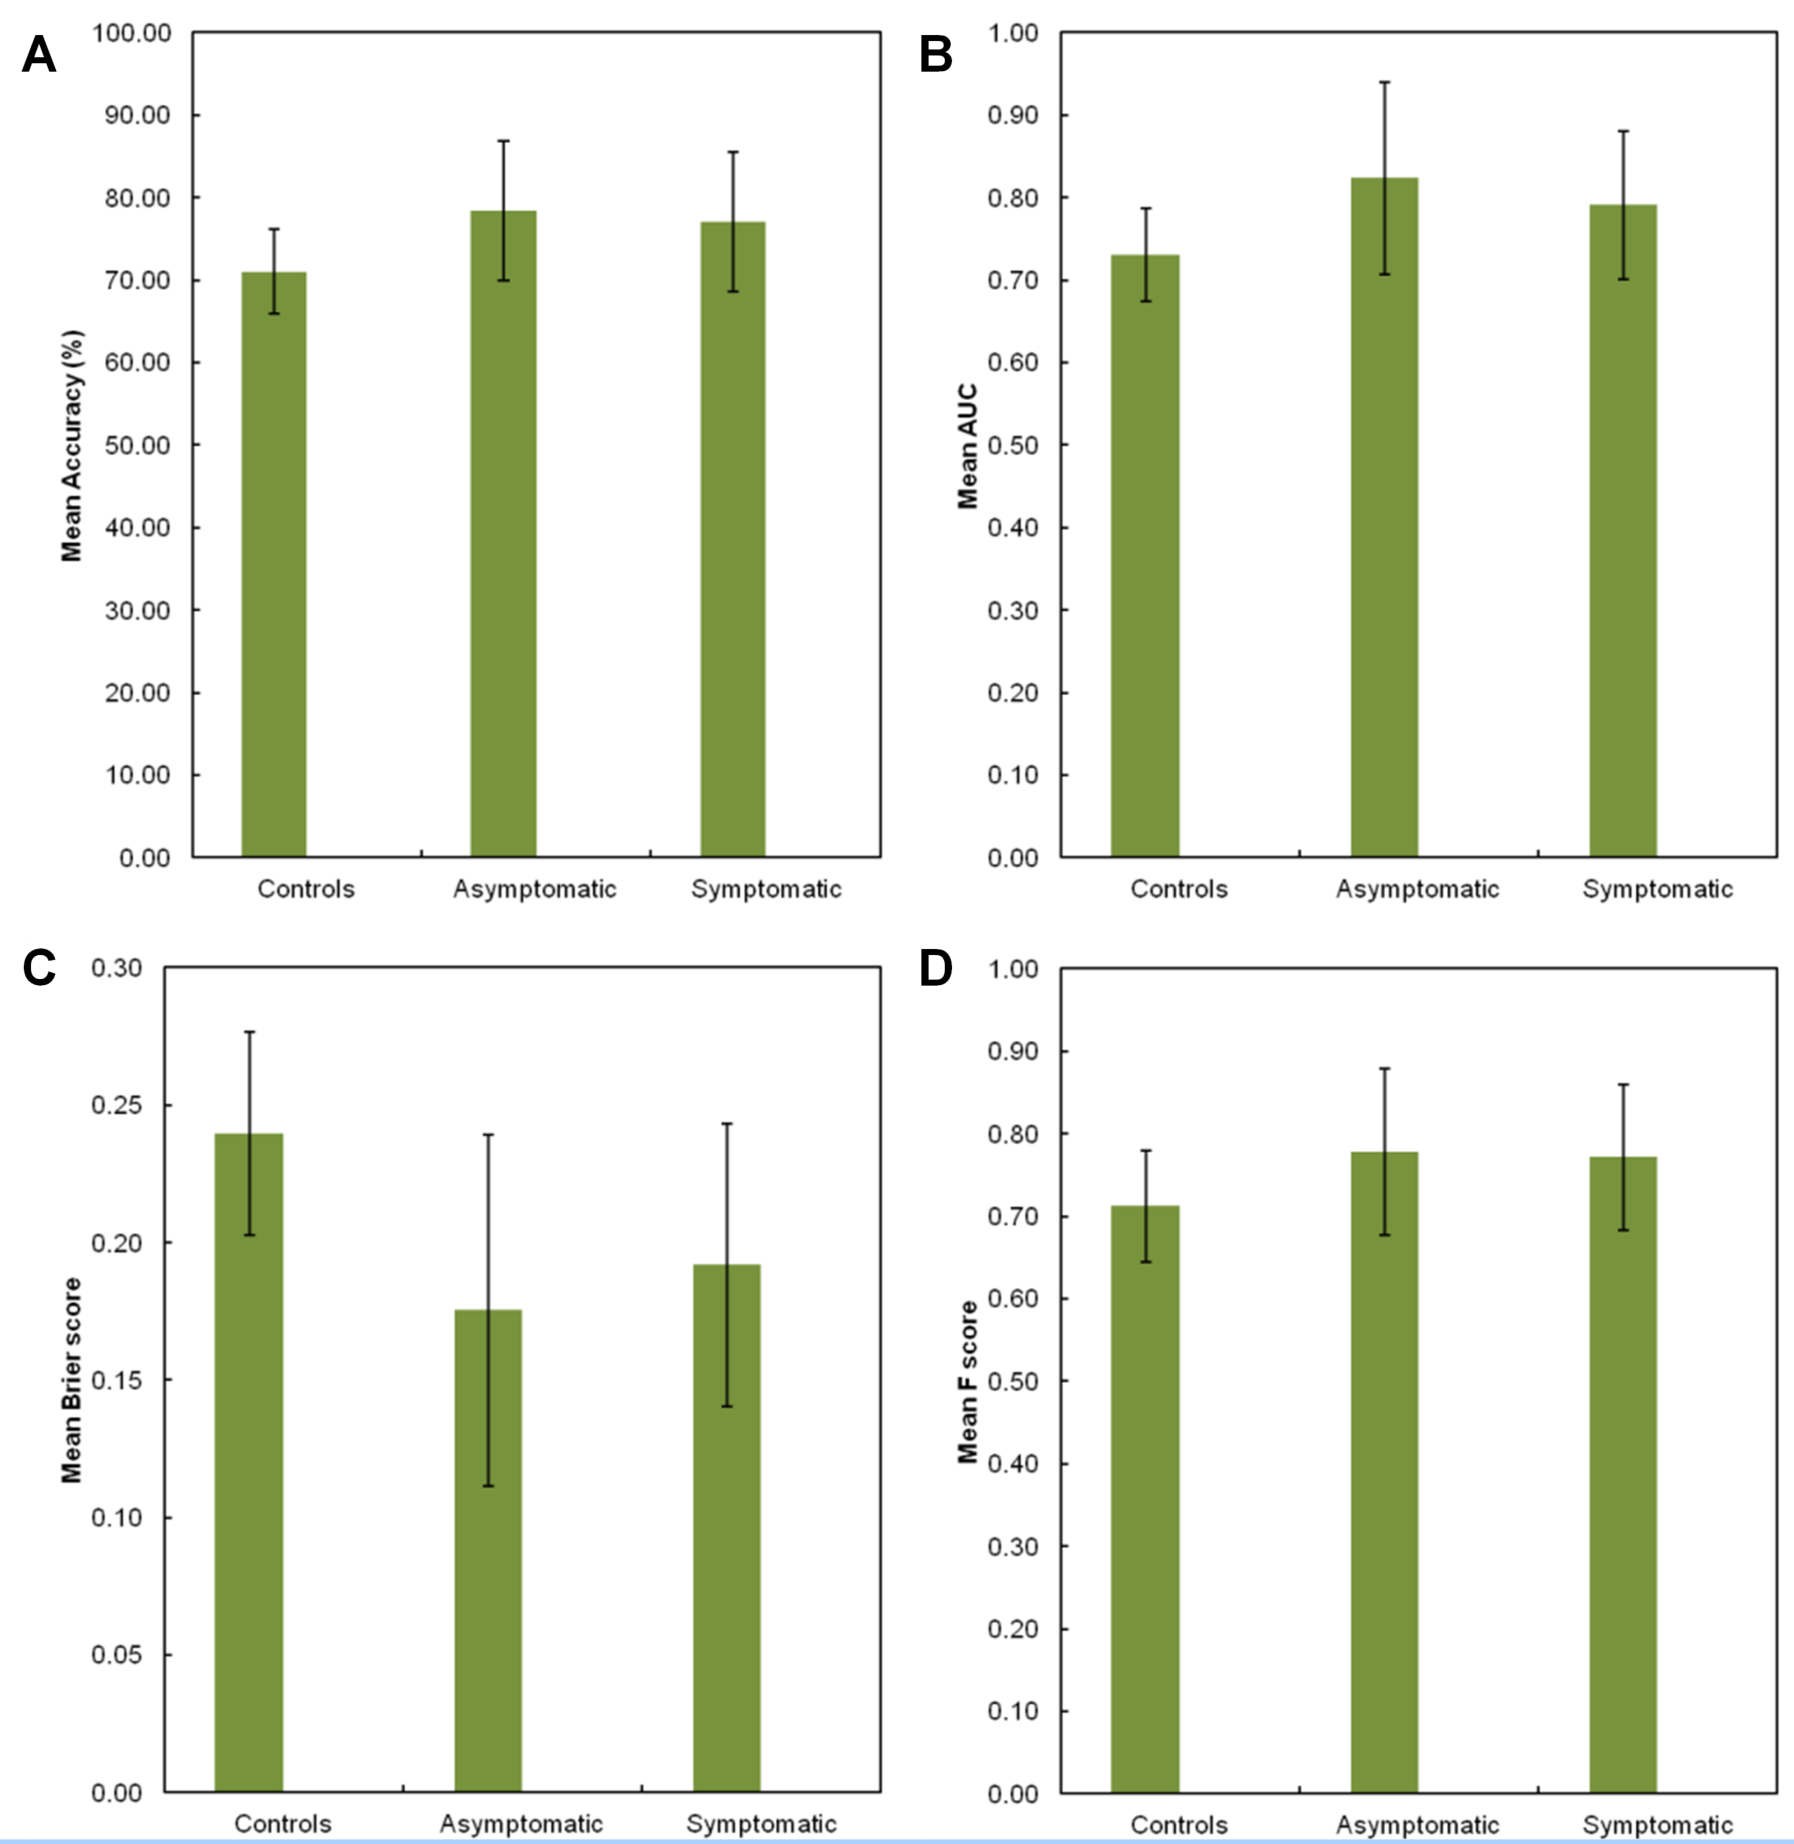
Figure 2 depicts the mean (SD) post-validation classification accuracy (A), AUC (B), Brier score (C), and F-score (D) achieved by each gradient-boosted trees machine learning model for both 3D and 2D features for all between-group classification challenges. While both the mean accuracy and AUC values associated with models generated from 3D textural features were each greater than those created using equivalent 2D features, these comparisons did not reach significance. There was a trend toward greater classification accuracy (Figure 2A, P=0.06) and AUC (Figure 2B, P=0.08) for the 3D models designed to distinguish between asymptomatic vs symptomatic hips. While there were no significant differences between 3D and 2D models in terms of Brier scores, the mean F-score associated with the 3D textural feature models designed to distinguish between asymptomatic and symptomatic cam patients was significantly better than for 2D models (Figure 2D, P=0.03). The four performance metrics achieved by each model generated for discriminating between anterior vs posterior sROIs are depicted in Figure 3, however no significant patient-group differences were detected (p>0.97 for each).Discussion
Texture features extracted from MRI can detect subtle differences in subchondral bone architecture between controls and cam positive hips, regardless of patient symptom status. Future work is aimed at identifying the signature features that contribute most to overall model performance using Shapley additive explanations12 and other 'feature importance' metrics.Conclusion
The texture profile of acetabular subchondral bone in cam positive hips is significantly different from controls, in all regions. This suggests there are structural changes occurring globally within the acetabular subchondral bone of patients with cam morphology.Acknowledgements
No acknowledgement found.References
1. Ganz, R. et al. Femoroacetabular impingement: a cause for osteoarthritis of the hip. Clin. Orthop. Relat. Res. 112–20 (2003). doi:10.1097/01.blo.0000096804.78689.c2
2. Bittersohl, B. et al. Cartilage damage in femoroacetabular impingement (FAI): preliminary results on comparison of standard diagnostic vs delayed gadolinium-enhanced magnetic resonance imaging of cartilage (dGEMRIC). Osteoarthr. Cartil. 17, 1297–306 (2009).
3. Kassner, A. & Thornhill, R. Texture analysis: a review of neurologic MR imaging applications. AJNR. Am. J. Neuroradiol. 31, 809–16 (2010).
4. Peuna, A. et al. Variable angle gray level co-occurrence matrix analysis of T2 relaxation time maps reveals degenerative changes of cartilage in knee osteoarthritis: Oulu knee osteoarthritis study. J. Magn. Reson. Imaging 47, 1316–1327 (2018).
5. MacKay, J. W. et al. Association of subchondral bone texture on magnetic resonance imaging with radiographic knee osteoarthritis progression: data from the Osteoarthritis Initiative Bone Ancillary Study. Eur. Radiol. 28, 4687–4695 (2018).
6. Heilmeier, U. et al. Baseline knee joint effusion and medial femoral bone marrow edema, in addition to MRI-based T2 relaxation time and texture measurements of knee cartilage, can help predict incident total knee arthroplasty 4-7 years later: data from the Osteoarthritis Init. Skeletal Radiol. (2018). doi:10.1007/s00256-018-2995-4
7. Radin, E. L. et al. Effects of mechanical loading on the tissues of the rabbit knee. J. Orthop. Res. 2, 221–234 (1984).
8. Brandt, K. D., Dieppe, P. & Radin, E. L. Etiopathogenesis of osteoarthritis. Rheum. Dis. Clin. North Am. 34, 531–59 (2008).
9. Szczypiński, P. M., Strzelecki, M., Materka, A. & Klepaczko, A. MaZda--a software package for image texture analysis. Comput. Methods Programs Biomed. 94, 66–76 (2009).
10. Chen, T. & Guestrin, C. XGBoost. in Proceedings of the 22nd ACM SIGKDD International Conference on Knowledge Discovery and Data Mining - KDD ’16 785–794 (ACM Press, 2016). doi:10.1145/2939672.2939785
11. Pedregosa, F. et al. Scikit-learn: Machine Learning in Python. J. Mach. Learn. Res. 12, 2825–2830 (2011).
12. Lundberg, S. & Lee, S.-I. A Unified Approach to Interpreting Model Predictions. in 31st Conference on Neural Information Processing Systems (NIPS 2017)
Figures