1296
Comparison of ZTE vs UTE for MR Bone ImagingMichael Carl1, Yajun Ma2, Ricardo Mello2, Jiang Du2, and Eric Y Chang2,3
1General Electric, Global MR Applications & Workflow, San Diego, CA, United States, 2UCSD, San Diego, CA, United States, 3VA San Diego Healthcare System, San Diego, CA, United States
Synopsis
We compared different center-out 3D radial trajectories (ZTE and UTE) and assessed their advantages and disadvantages for bone imaging. We found that while ZTE and UTE show similar results at the same read BW, the higher BWs available with UTE can help reduce undesired background signals in the final bone images.
Introduction:
Direct MR imaging of tissues such as tendons, or ligaments, which have short transverse relaxation times (T2s) has become possible using ultrashort echo time (UTE) sequences [1-4]. There are several excitation RF and k-space trajectories available for UTE imaging. In this work, we compare two different research prototype center-out 3D radial trajectories and assess their advantages and disadvantages for MR bone imaging.Theory:
The pulse sequences are shown in Fig.1. UTE employs the RF pulses while the read gradients are ramped down, while in ZTE the read gradients are already ramped-up during excitation. Some consequences are: 1) The flip angle in ZTE is limited due to the need to keep the RF excitation pulse very short. 2) The read BW in ZTE is limited to minimize the missing k-space data at the center. 3) UTE can apply a slice-selection gradient, which allows application of slab selection. 4) UTE acquires data during partially time-varying read gradients, while ZTE uses an already fully ramped read gradient which means that ZTE does not suffer from gradient delay errors. The bone reconstruction algorithm in this work follows closely the process used in PET-MR attenuation correction [5]. The main steps include performance of a coil-bias correction algorithm followed by a simple contrast inversion. An image mask is then used to remove any non-tissue signals (e.g. air, coil-elements). The contrast inversion works best if the soft tissues have a uniform signal intensity (PD contrast), meaning that one strives to minimize T2 and T1 contrast. The T1 contrast is readily minimized by using a low excitation flip angle. To minimize T2 contrast requires the use of an ultrashort TE time, and maximum possible read BW.Materials and Methods:
To experimentally study the T2* blurring and contrast characteristics, we scanned a plastic doll made of soft rubber (short T2* of about 400𝜇s). Both UTE and ZTE scans were performed with BW of 31.25kHz, 62.5kHz, and 125kHz. For the bone scans we imaged a shoulder specimen with an isotopic 0.8 mm acquisition using a 1° flip angle. The ZTE acquisition was obtained at 62.5 kHz BW, while the UTE scan was obtained at both 62.5 kHz and 125 kHz.Results:
The images of the short T2 doll-phantom are shown in Fig.2. For either sequence there is significant short T2 blurring for the 31.25kHz BW scans, while the best result is obtained with UTE using BW=125kHz. The original shoulder images are shown in Fig.3. As expected, both 62.5 kHz acquisition show similar image features/contrast. The 125 kHz BW UTE images on the other hand show visibly less T2 contrast. This in turn facilitates the contrast inversion (shown in the top panel of Fig.4), which shows less background signals in the soft tissues surrounding the bone. Finally, the bottom panel of Fig.4 shows the 3D rendered bone images of the 62.5 kHz BW ZTE scans and the 125 kHz BW UTE scans. These are displayed at their natural image window level and without any manual cleaning, and show less confounding background signals in the soft tissues in the 125 kHz UTE image.Conclusion:
We have examined two similar ultrashort TE pulse sequences for their performance in bone image capability. We found that for the same read BW, similar bone contrast images can be obtained using either sequence, but that the overall results benefit from using the highest available BW.Acknowledgements
The authors acknowledge support from GE Healthcare, VA Clinical Science and Rehabilitation R&D Awards (I01CX001388 and I01RX002604), and the NIH (1R21AR073496, R01AR068987).References
[1] Rahmer et al, Magn Reson Med, 2006. 55(5): p.1075-82.
[2] Du et al, Magn Reson Imag 2011:29:470–482
[3] Weiger et al, NMR Biomed. 2015 28(2):247-54
[4] Li et al, Magn Reson Med 2012 68(3):680
[5] Wiesinger et al. Magn Reson Med. 2018 Oct;80(4):1440-1451
Figures
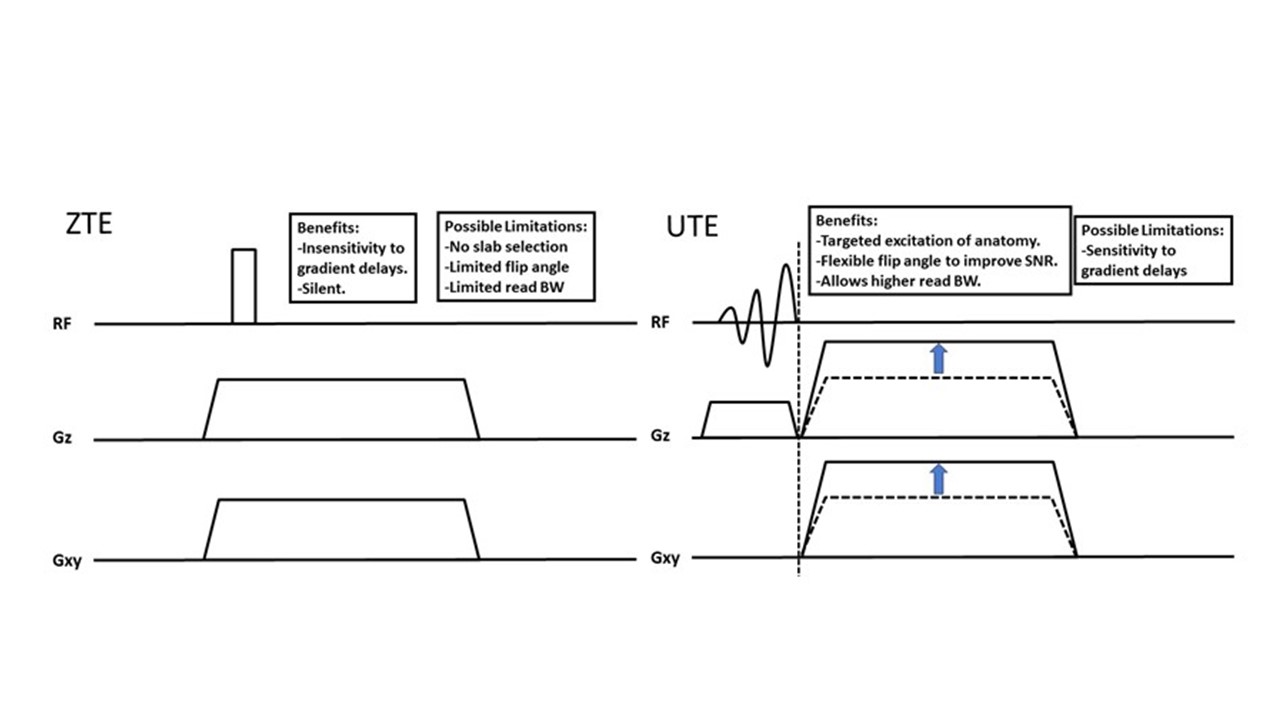
Fig.1:
ZTE (left), UTE (right) pulse sequence diagrams highlighting several
differences such as slab selection and BW limitations.
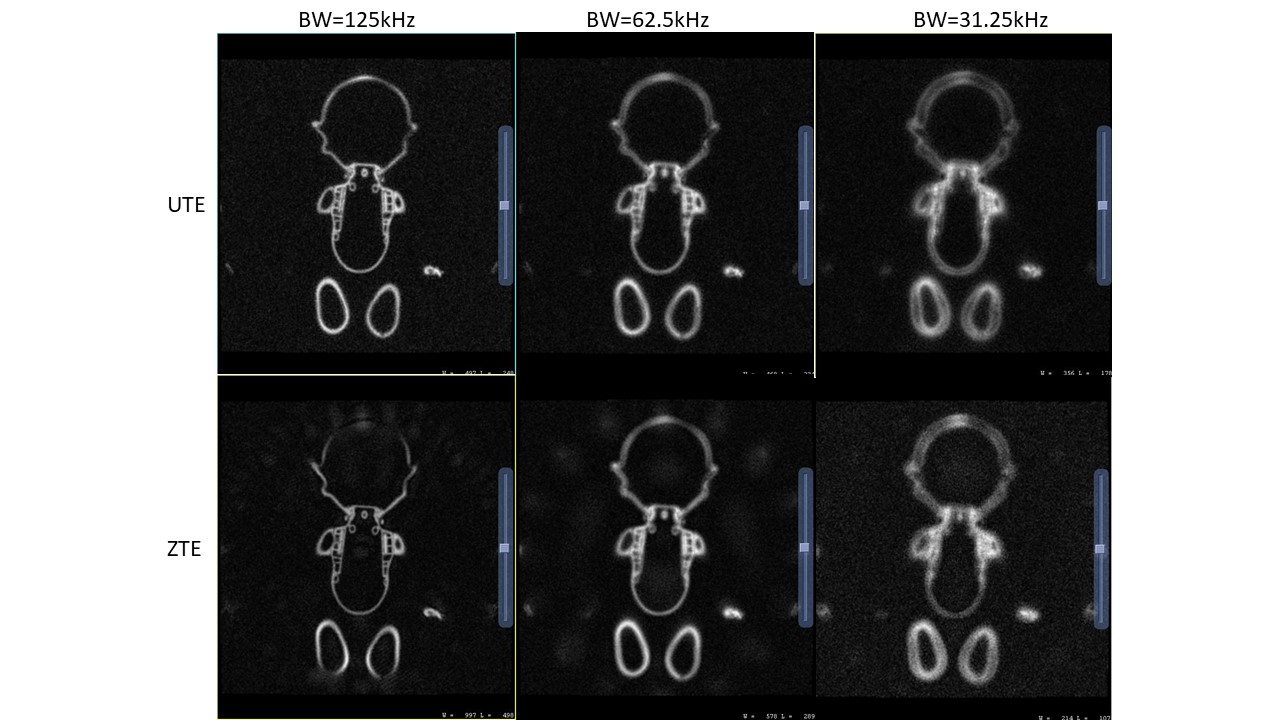
Fig.2:
Coronal UTE and ZTE images of short T2 plastic doll at various BW. The least
blurring and best overall IQ is realized in the UTE image at 125kHz.
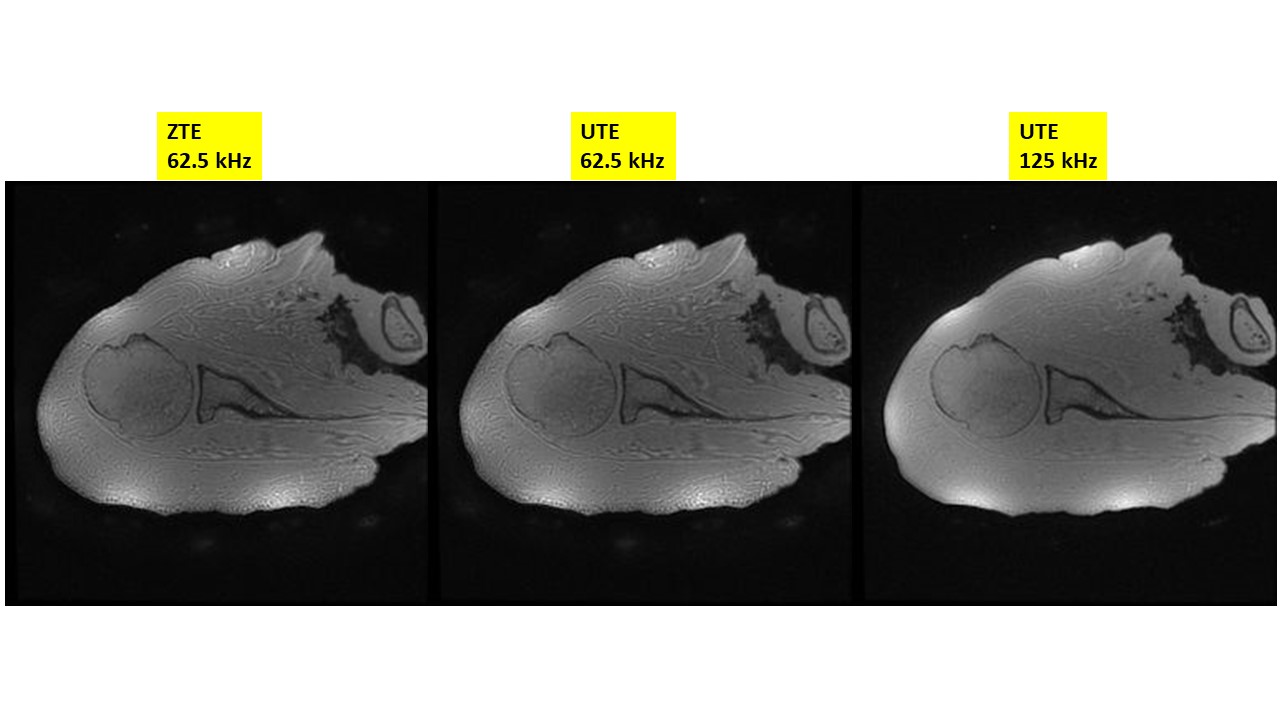
Fig.3:
ZTE and UTE shoulder images. As expected, the ZTE and UTE images look similar
at the same BW=62.5kHz, while the BW=125kHz UTE image shows flatter soft tissue
contrast.
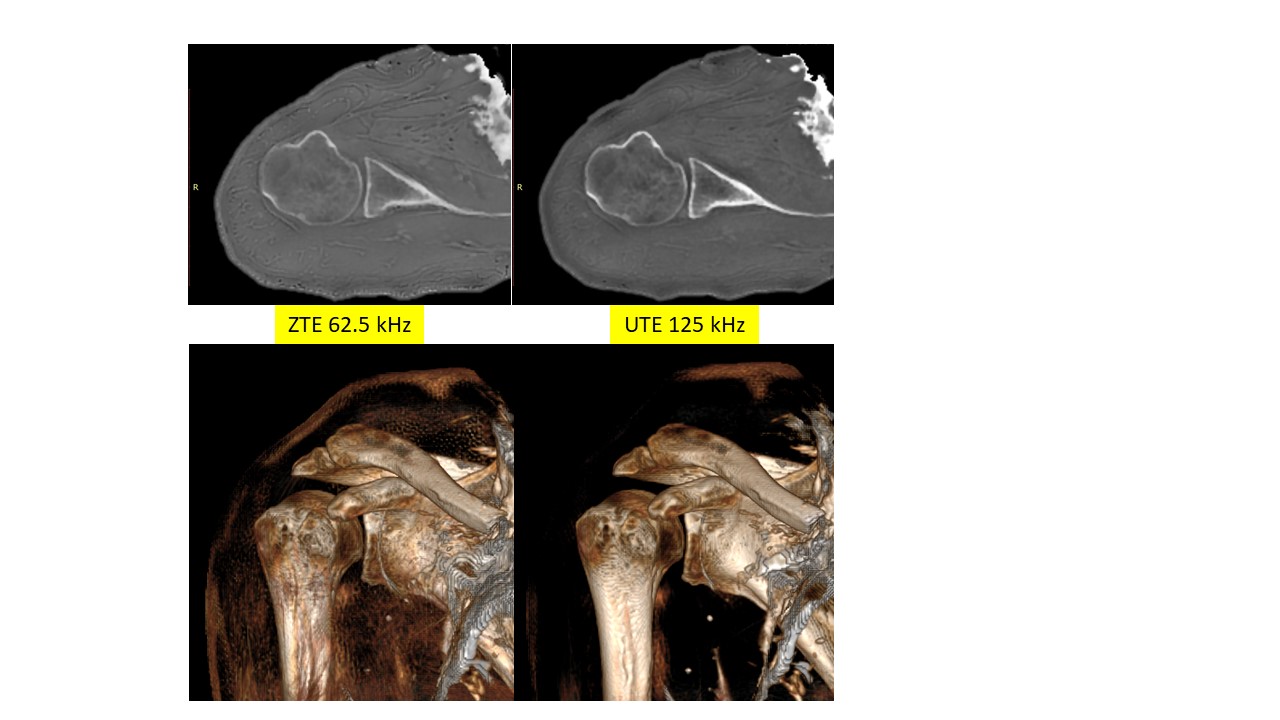
Fig.4:
Bone images (top panel), and 3D renderings of ZTE and UTE bone images (bottom
images).