1294
Variation of ADC of skull bone marrow with age and pubertal status in a pediatric population1Cancer Research UK Imaging Centre, The Institute of Cancer Research, Sutton, United Kingdom, 2MRI Unit, The Royal Marsden Hospital NHS Foundation Trust, Sutton, United Kingdom, 3Department of Neuroradiology, Atkinson Morley Regional Neuroscience Centre, St George's University Hospitals NHS Foundation Trust, London, United Kingdom
Synopsis
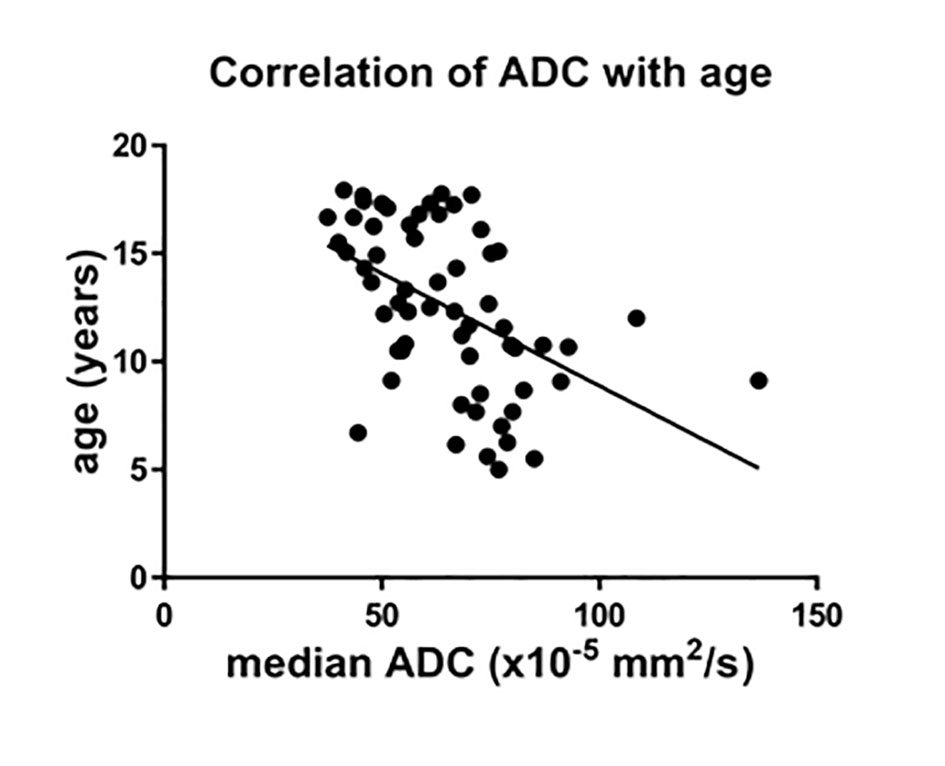
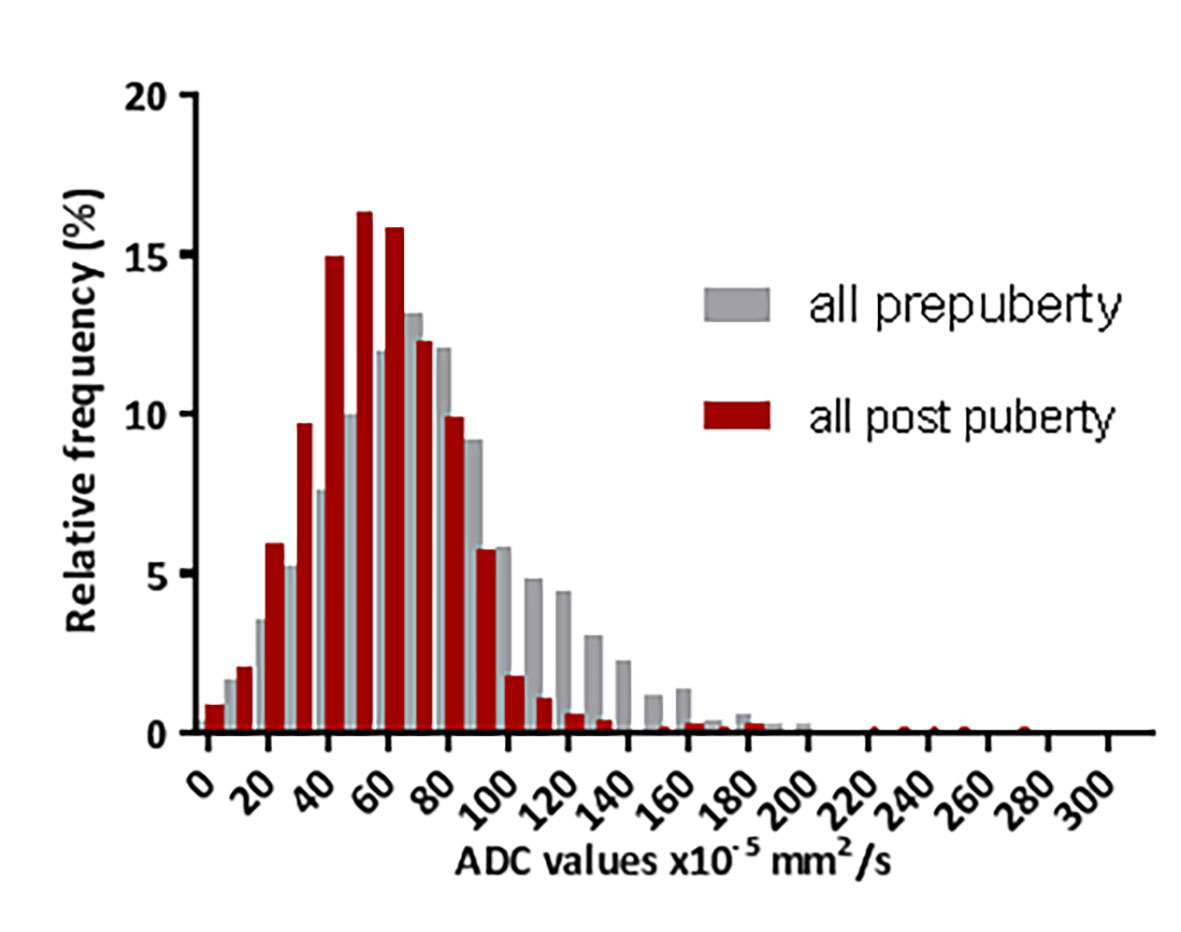
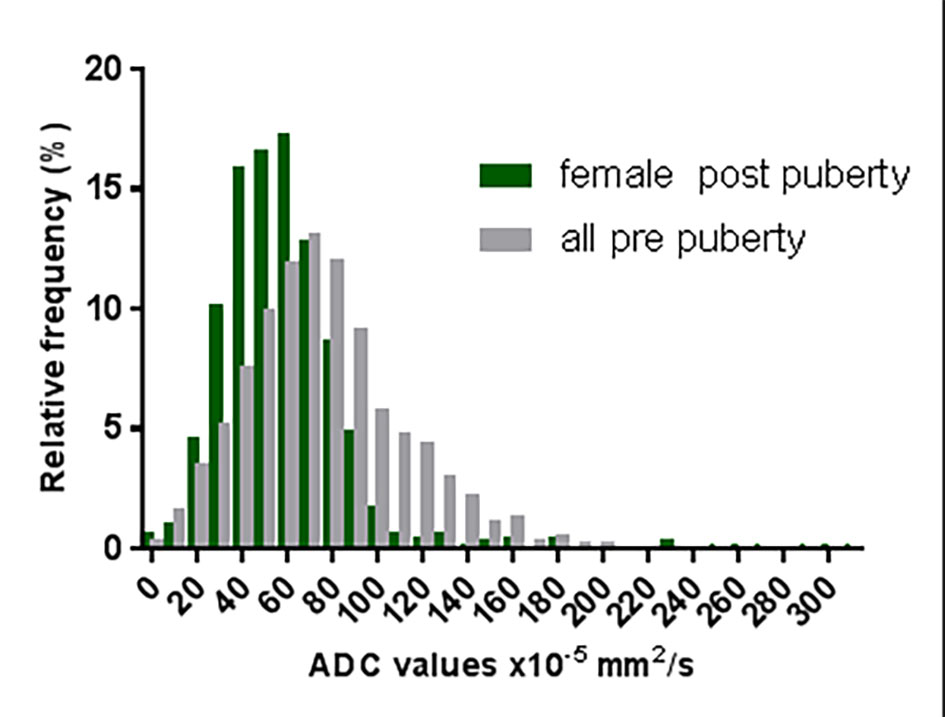
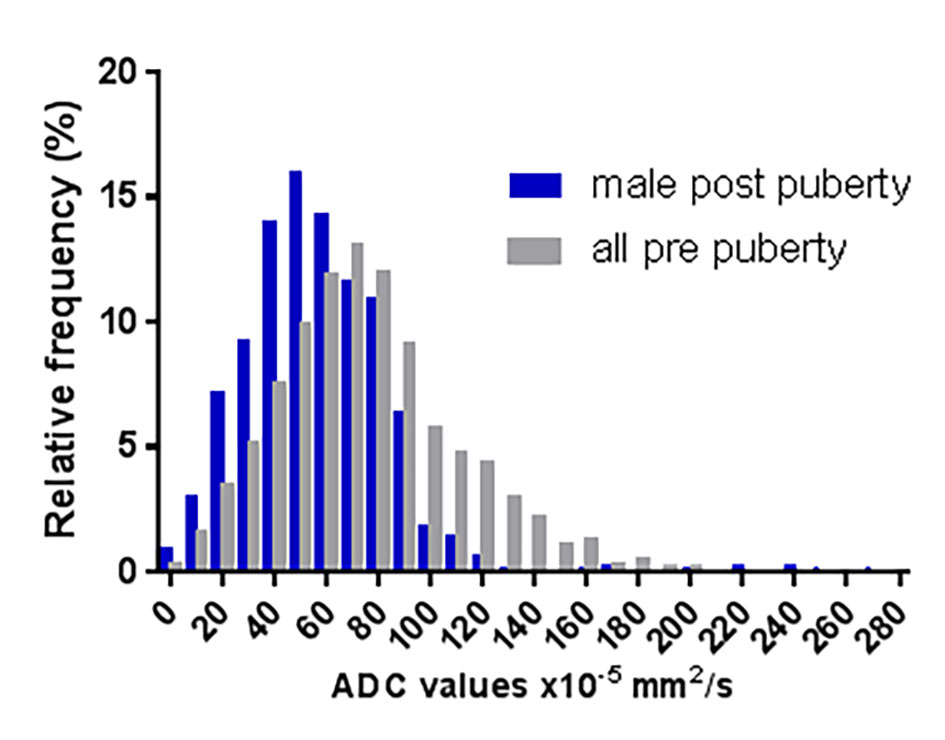
ADC measurements were possible from the clivus of children. Values showed a significant negative correlation with age. Following puberty, there was a reduction in ADC and a left shift in centile histogram values, likely as a result of fat replacement. This was independent of gender. Bone marrow within the clivus behaves like marrow from tubular bones after puberty, and does not retain a cellular morphology expected from red hematopoietic bone marrow.
Background
Bone marrow is a dynamic tissue, the composition of which varies with the physiological needs of the individual. Until puberty, the entire skeleton remains hematopoietically active but by the age of 18 years, bone marrow at several locations undergoes fatty infiltration. Interrogating the cellular versus the fatty component of the bone marrow in children can provide information on the proliferative state of the bone marrow1 and allow monitoring of changes induced by therapy. Diffusion-weighted MRI (DWI) is associated with cell density2. As it uses a fat suppression pulse, lower ADC values have been used as a surrogate for the appearance of fat within bone marrow in several studies in adults3.Aim
To interrogate the Apparent Diffusion Coefficient (ADC) values derived from DWI of skull base bone marrow in a pediatric population by age, gender, and pubertal status, and establish their normal range in a pediatric age group.Methods
Inclusion and exclusion criteria were imposed to allow the retrospective selection of a cohort of pediatric patients with normal MRI brain scans referred because of headaches, transient neurology, syncopal episodes and possible seizures (but with normal electroencephalogram). Patients with any condition that might affect the bone marrow (infection, bone lesions at any site, systemic diseases, oncological diagnosis or on medication) were excluded. Electronic Patient Records were assessed to confirm clinical presentation and any follow-up diagnosis. Of 1,140 children identified, 60 met the criteria. All children were scanned on a 1.5T Achieva-Ingenia (Philips, Best, The Netherlands). DW data were acquired with 2 b-values (0 and 1000 s/mm2). The clivus was selected for measurement as its size and shape facilitated region-of-interest (ROI) placement. A 4-6mm diameter ROI (21-182 voxels, median 50 voxels) was drawn within the clivus, on 2 midline slices in 58 cases and on 3 slices in the other 2 (Adept®, The Institute of Cancer Research). ADC calculated on a voxel-by-voxel basis using a monoexponential fit of the data yielded median, mean, 10th, 25th, 75th, and 90th centile ADC values for each subject.
For both genders, pubertal status was assessed by reviewing the imaging appearances of the pituitary gland. For males, commencement of fusion of the spheno-occipital synchondrosis also was considered pubertal4. As all data was normally distributed, an independent samples t-test was used for all comparisons; a Pearson’s correlation coefficient examined the relationship between ADC and age.
Results
There was a significant negative correlation between age and ADC for the whole cohort (r= -0.49 for median (Figure 1) and -0.42 for mean values, p<0.0001 and 0.0008, respectively) which held true for females (r= -0.5 for median and -0.4 for mean values, p= 0.005 and 0.03, respectively) and males (r= -0.53 for median and -0.48 for mean values, p= 0.002 and 0.008, respectively).
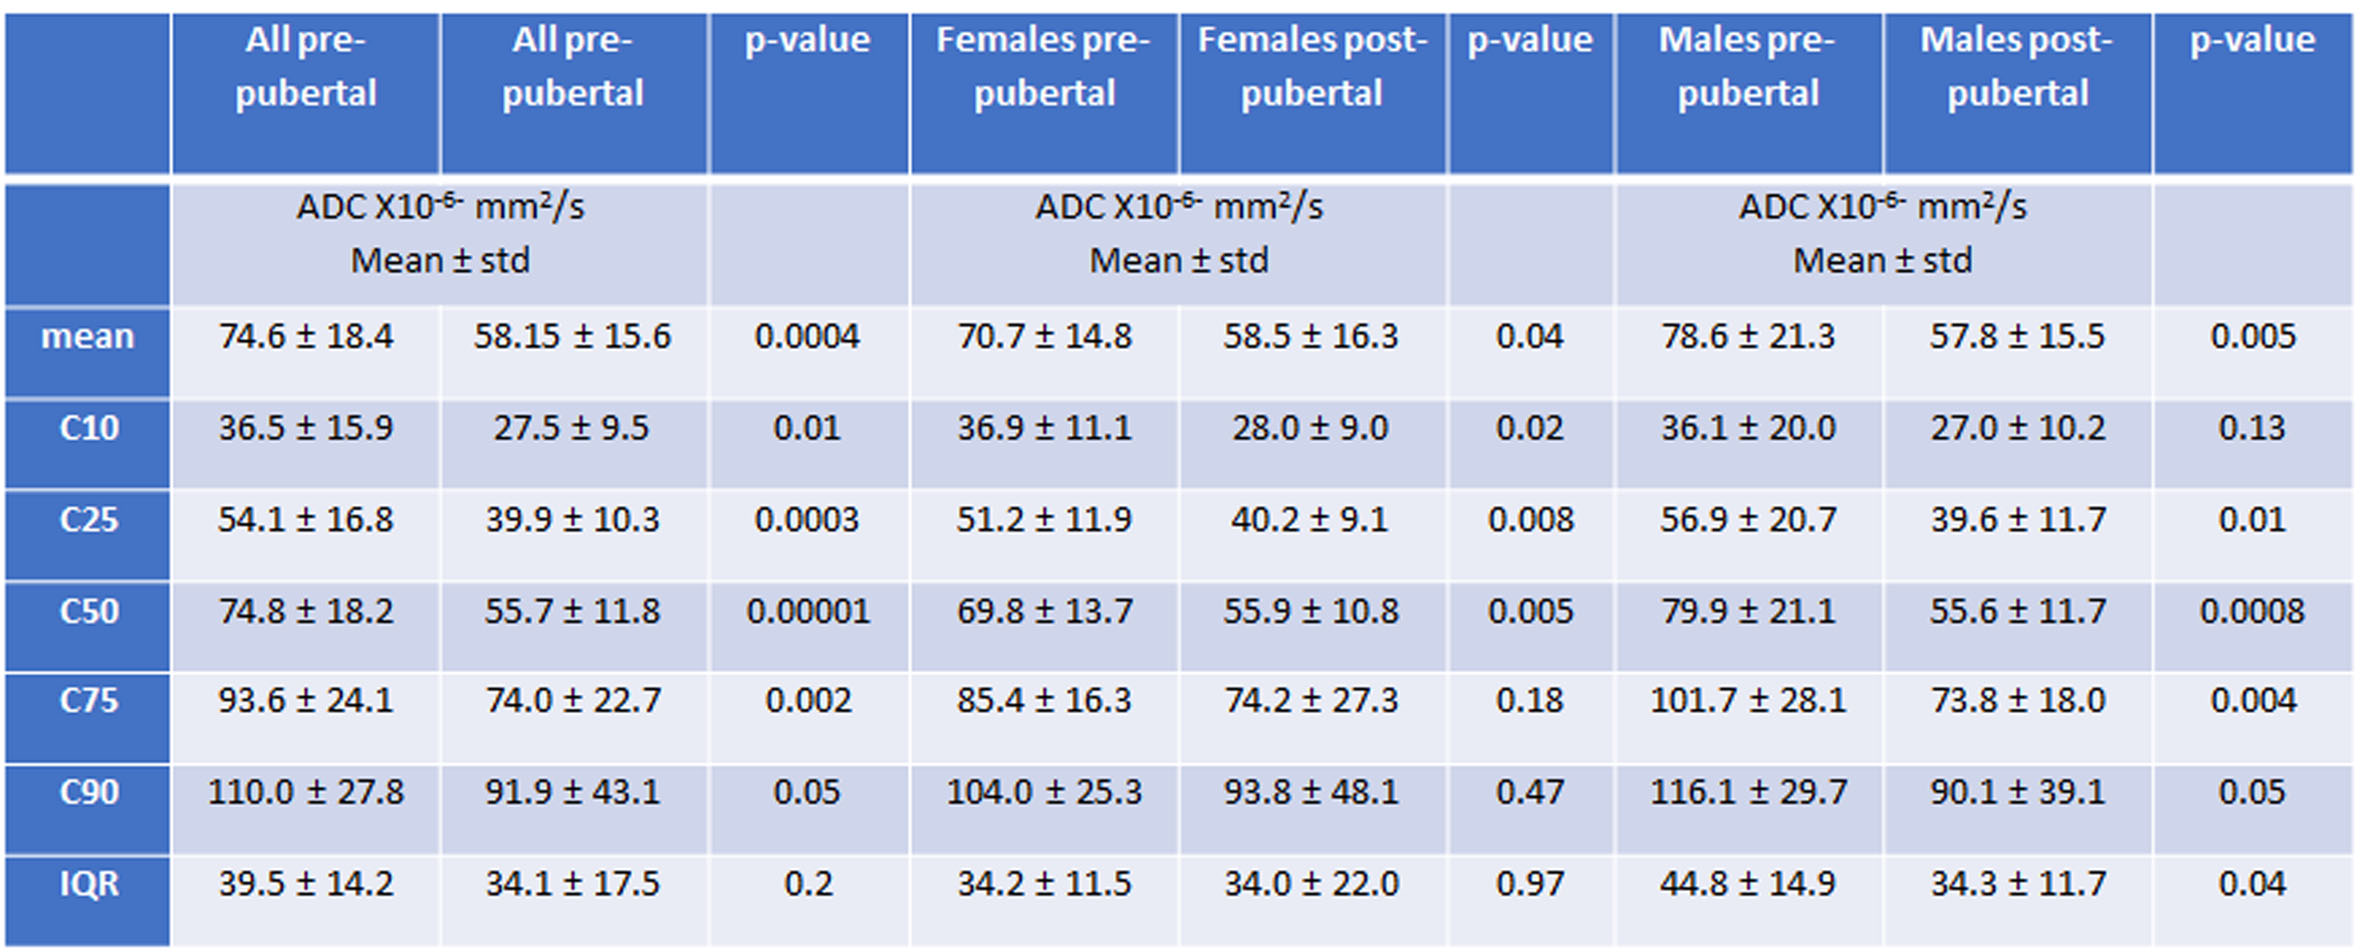
There was a significant difference between mean and median ADC values before and after puberty for the whole population (Table 1). Post-puberty there was a strong left shift of the histogram, (Figure 2a) which was also true when subjects were separated by gender (Figures 2 b and c).
Discussion and Conclusions
The data appear robust as distribution of values was identical in all four cohorts (5-9 years old, 10 years old – pre-puberty, post-pubertal females, and post-pubertal males). The change with puberty regardless of gender is striking and indicates that the clivus marrow behaves as other tubular bones with puberty, sacrificing its haematopoietic function to a more osteogenic function. These data will form a useful baseline for studies utilizing DWI as a biomarker for assessing the effects of radiation received incidentally by skull base bone marrow during treatment of children with brain tumors and for assessing other treatment-related effects on bone marrow.Acknowledgements
CRUK support to the Cancer Imaging Centre at ICR and RMH in association with MRC and Department of Health C1060/A10334, C1060/A16464 and NHS funding to the NIHR Biomedical Research Centre and the Clinical Research Facility in Imaging.References
1. Li Q, Pan SN, Yin YM, et al Normal cranial bone marrow MR imaging pattern with age-related ADC value distribution. Eur J Radiol. 2011 Nov;80(2):471-7.
2. Nonomura Y, Yasumoto M, Yoshimura R, et al. Relationship between bone marrow cellularity and apparent diffusion coefficient. J Magn Reson Imaging. 2001;13(5):757-60.
3. Schraml C, Schmid M, Gatidis S, et al. Multiparametric analysis of bone marrow in cancer patients using simultaneous PET/MR imaging: Correlation of fat fraction, diffusivity, metabolic activity, and anthropometric data. J Magn Reson Imaging. 2015 Oct;42(4):1048-56.2.
4. Alhazmi A., vargas E, Palomo JM et al. Timing and rate of spheno-occipital synchondrosis closure and its relationship to puberty PLoS One 2017 Aug 21; 12 (8): e0183305
Figures