1292
An investigation of the relationship between type II collagen degradation products and MRI features of damage in knee osteoarthritis patients1Molecular & Clinical Sciences Research Institute, St George's, University of London, London, United Kingdom, 2St George's University Hospitals NHS Foundation Trust, London, United Kingdom, 3Institute of Infection & Immunity, St George's, University of London, London, United Kingdom, 4Great Ormond Street Hospital, London, United Kingdom
Synopsis
Knee osteoarthritis (OA) is a degenerative disease which produces pain and exhibits damage to cartilage, bone marrow and the development of synovitis. Biomarkers are needed to aid patient stratification for developing improved treatment strategies. We have investigated how type II collagen degradation products (CTX2), which are generated during OA, relate to MRI features of knee damage and patient reported pain. CTX2 was strongly related to synovitis and cartilage damage whereas reported pain was more strongly related to depression and BMI. CTX is thus complementary to pain scores as a marker of OA severity.
INTRODUCTION
Osteoarthritis (OA) is a degenerative disease with abnormalities that include cartilage damage (CD), synovitis (Syn) and bone marrow lesions (BML)1 and are associated with pain and disease progression2-3. Treatment for OA patients is predominantly for pain relief with analgesic and anti-inflammatory treatment, with total knee replacement (TKR) surgery as the final stage. There is a need for improved understanding of disease progression and the relationship between pain and structural damage, as well as objective biomarkers to aid patient stratification4. Type II collagen degradation products (CTX2) are generated during OA that may relate to BML presence5, disease progression6 and be simply tested in patients. We investigated how CTX2 levels were related to OA-induced knee damage as detected by MRI and reported pain.METHODS
Knee MRI was acquired in 90 subjects (72 F, 18 M) fulfilling the ACR criteria for OA, comprising early OA patients undergoing standard treatment with analgesics (n=24) and those with advanced OA scheduled for TKR (n=66). MRI data was acquired at 3T with an 8 channel knee coil (Fig. 1). Pulse sequences were turbo spin echo acquisition of sagittal, coronal and axial intermediate-weighted (IW) images with TE 30ms, TR 5000ms and fat-saturation; and sagittal T1-weighted with TE 15ms, TR 600ms. MRIs were assessed by two radiologists to obtain consensus values for structural damage features of CD, Syn and BML using MOAKS1. Overall knee scores were calculated as the average over 15 regions for BML (avBML), over 14 regions for CD (avCD) and the sum of effusion and Hoffa synovitis (tSyn); a sum total damage score (tMOAKS) was also calculated. CTX2 levels were determined using a commercial enzyme-linked immunosorbent assay to detect C-terminal telopeptides of type II collagen cleavage products from urine samples with creatinine levels used for normalisation5. Urine samples were acquired prior to MRI scans. Participants were assessed with the Western Ontario and McMaster Universities Osteoarthritis Index (WOMAC) for reported pain levels (WOMAC_P) and with the Hospital Anxiety and Depression score (HADS). Body mass index (BMI), age and gender were obtained for use as covariates.RESULTS
There were significant differences between early and advanced OA groups for CTX2, WOMAC_P, avBML, avCD, tSyn, tMOAKS (p < 0.001) and age and BMI (p < 0.003). Across both groups CTX2 was significantly correlated to avCD, tSyn, tMOAKS (p<0.005), avBML (p=0.019) and BMI (p=0.012), whereas WOMAC_P was only significantly correlated to tMOAKS, BMI, age and HADS (p<0.01) (Figs. 2-5). WOMAC_P and CTX2 were weakly correlated (p=0.045). In Early OA CTX2 was not significantly correlated with any other parameter, whereas WOMAC_P correlated with BMI and HADS (p<0.002) (Fig. 2). In Advanced OA CTX2 was strongly correlated with avCD, tSyn, tMOAKS (p<0.005) and WOMAC_P correlated with BMI, age and HADS (p<0.04). After covarying for age, BMI and HADS, CTX2 still showed correlations with avCD and tSyn (p<0.005) in advanced OA, but showed no correlation with WOMAC_P. A General Linear Model (GLM) analysis showed CTX-II was dependent on tSyn across both groups (p=0.014), and in advanced OA on tSyn (p=0.039) and avCD (p=0.048), but not on BML presence (Figs 4 & 5). A GLM analysis of WOMAC_P with MOAKS avCD and tSYn as covariates showed that BML presence had a significant effect (p=0.021), but that was reduced when covarying for BMI and HADS (p=0.061).DISCUSSION
Our data suggests that CTX2 is a marker that is predominantly associated with synovitis and cartilage damage (Figs 4 & 5). There was no significant independent effect of BMLs on CTX2 levels, but CTX levels are highest in the advanced OA groups, which also have higher numbers of BMLs. Patient reported pain via WOMAC_P was strongly associated with the overall levels of structural damage detected by MRI, but pain is also strongly related to depression and BMI, which weakens the correlation to MOAKS when these variables are used as covariates. It is well known that depression exacerbates the experience of pain and increased BMI likely exacerbates knee joint pain via mechanical pressure and stress.CONCLUSION
CTX2 appears to be mostly independent of reported pain and may be a useful marker of total cartilage damage and synovitis if MRI was not available. Pain was only weakly associated with the presence of BMLs and variability in MOAKS after correcting for HADS and BMI. CTX2 and WOMAC pain score appear to represent independent aspects of severity of knee OA and their combined use with detailed MRI may aid monitoring the effects of combined treatments that target pain, depression and structural modifiers.Acknowledgements
Supported by the Rosetrees Trust (Grant number M11-F2) and by the UK National Institute for Health Research (NIHR) Clinical Research Network.References
1. Hunter DJ, Guermazi A, Lo GH et al. Evolution of semi-quantitative whole joint assessment of knee OA: MOAKS (MRI Osteoarthritis Knee Score). Osteoarthritis and Cartilage. 2011;19(8):990-1002.
2. Crema MD, Felson DT, Roemer FW et al. Prevalent cartilage damage and cartilage loss over time are associated with incident bone marrow lesions in the tibiofemoral compartments: the MOST study. Osteoarthritis and Cartilage. 2013;21:306-313.
3. Zhang Y, Nevitt M, Niu J et al. Fluctuation of Knee Pain and Changes in Bone Marrow Lesions, Effusions, and Synovitis on Magnetic Resonance Imaging. Arthritis Rheum. 2011;63(3):691-9.
4. Dam EB, Marco Loog M, Claus Christiansen C et al. Identification of progressors in osteoarthritis by combining biochemical and MRI-based markers. Arthritis Res Ther. 2009;11(4):R115. doi: 10.1186/ar2774.
5. Kuttapitiya A, Assi L, Laing K, et al. Microarray analysis of bone marrow lesions in osteoarthritis demonstrates upregulation of genes implicated in osteochondral turnover, neurogenesis and inflammation. Ann Rheum Dis. 2017;76(10):1764-1773.
6. Røtterud JH, Reinholt FP, Beckstrøm KJ, et al. Relationship between CTX-II and patient characteristics, patient-reported outcome, muscle strength, and rehabilitation in patients with a focal cartilage lesion of the knee: a prospective exploratory cohort study of 48 patients. BMC Musculoskelet Disord. 2014;15:99. doi: 10.1186/1471-2474-15-99.
Figures
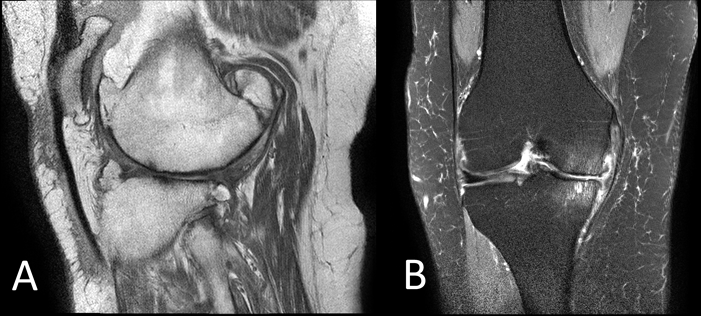
FIGURE 1
Representative MRI scans acquired at 3T with an 8 channel knee coil. A) Sagittal T1-weighted image with TE 15ms, TR 600ms, 0.3mm in-plane resolution, 3mm slice thickness, 0.25mm slice gap, SENSE factor 1.6. Patient 38, average cartilage damage score (avCD) = 2.3. B) Coronal intermediate weighted image with TE 30m, TR 5000ms, fat-saturation, 0.35mm inplane resolution, 3mm slice thickness, 0.25mm slice gap, SENSE factor 1.4. Patient 58, total Synovitis score (tSyn) =3, average BML score (avBML) = 1.7.
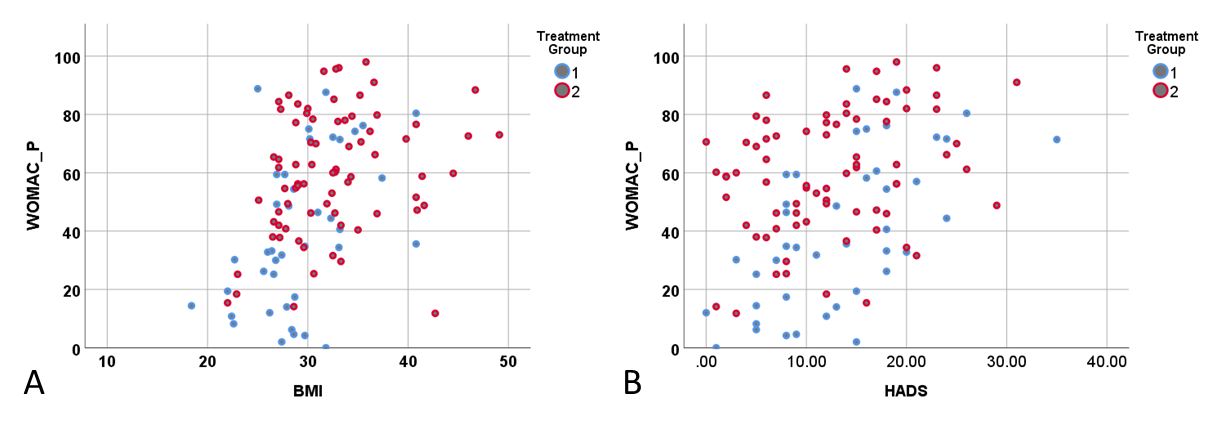
FIGURE 2
Relationship of WOMAC pain scores to A) BMI and B) HADS; for Treatment Group 1 undergoing standard care and Treatment Group 2 who are scheduled for total knee replacement. Bivariate linear regression analysis across both groups: WOMAC_P v. BMI, p=0.000, r=0.487; WOMAC_P v. HADS, p=0.000, r=0.419.
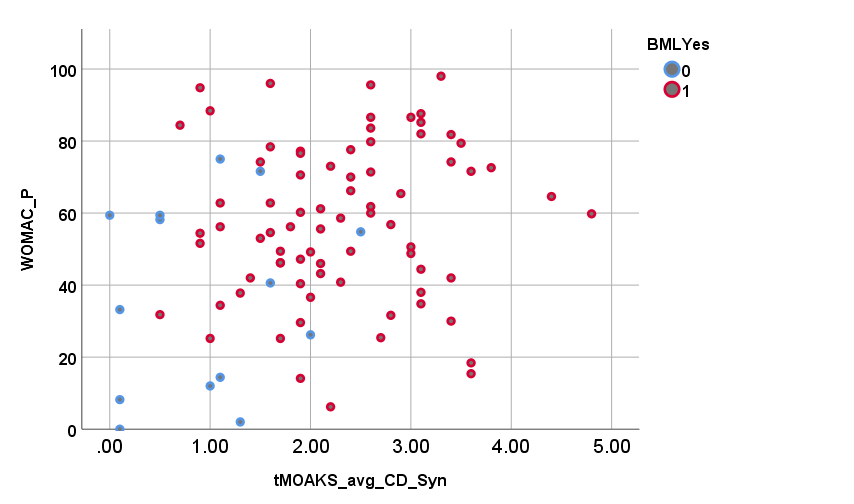
FIGURE 3
WOMAC_P for both early and advanced OA as a function of the summed MOAKS for average cartilage damage and total synovitis and whether BMLs are present (red circles) or not (blue circles). Higher pain is associated with higher levels of cartilage damage (p=0.064) and synovitis (p=0.062). After co-varying for BMI, age and HADS, WOMAC_P only shows a moderate non-significant correlation with tMOAKS (p=0.082), but no
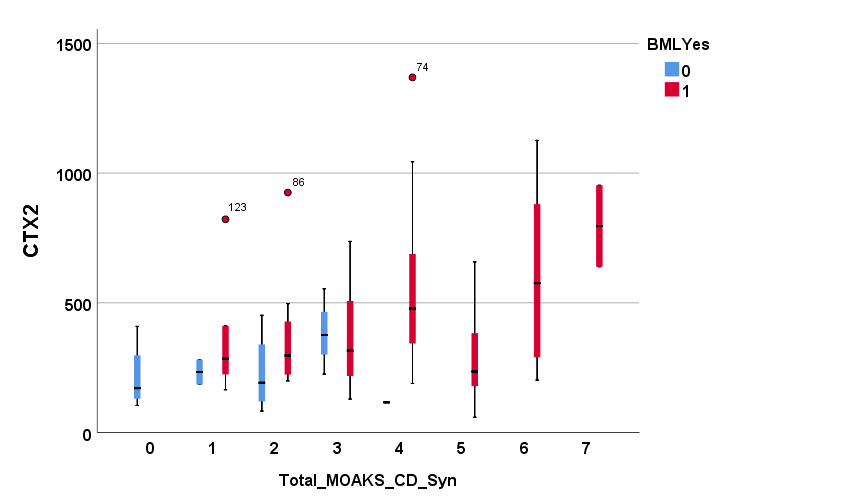
FIGURE 4
CTX2 levels (as boxplots) across early and advanced OA patients as a function of the total of MOAKS for cartilage damage, effusion and Hoffa synovitis in the presence (red bars) or not (blue bars) of BMLs. GLM across all data shows variability of CTX2 as significant for tSyn (p=0.019), tSyn+avCD (p=0.010), but no significance for avBML (p=0.21), or for the presence of BMLs as a fixed factor (p=0.34). Only at low levels of damage with tSyn+avCD < 3 the avBML approaches significance (p=0.091).
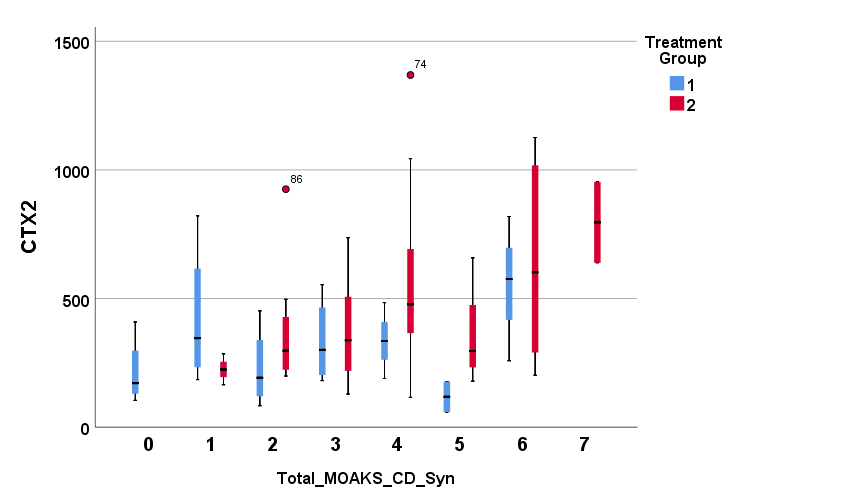
FIGURE 5
CTX2 levels (as boxplots) across early and advanced OA patients as a function of the total of MOAKS for cartilage damage, effusion and Hoffa synovitis for Treatment Group 1 undergoing standard care (blue bars) and Group 2 who are scheduled for TKR (red bars). GLM analysis shows variability of CTX2 is significant with tSyn (p=0.023) across both groups with no significance for gender or presence of BMLs (p=0.2); separate analysis shows CTX2 related to tSyn (p=0.054) for Group 1 and with tSyn (0.036) and avCD (p=0.029) for Group 2.