1290
Fatty Acid Composition Assessed By 3T MRI in Systemic Lupus Erythematosus1Radiology, NYU LANGONE HEALTH, New York City, NY, United States, 2Université de Lyon; CREATIS CNRS UMR 5220, Inserm U1206, INSA-Lyon, UCBL Lyon 1, Villeurbanne, France, 3Osteoporosis Center, Hospital for Joint Diseases, NYU LANGONE HEALTH, New York City, NY, United States
Synopsis
Systemic Lupus Erythematosus (SLE) is a chronic, inflammatory disease. Recent studies demonstrated an increased incidence of osteoporosis (OP) and fractures in SLE patients. Glucocorticoids (Gcs) are part of therapy for SLE and have with long-term intake deleterious effects on bone quality leading ultimately to Glucocorticoido-induced-osteoporosis. Our aim was to assess the marrow composition of a SLE population and compare it to that of OP patients, GCs user and young healthy women using 3T Chemical Shift Encoded- MRI (CSE-MRI).
Introduction
Systemic Lupus Erythematosus (SLE) is a chronic, inflammatory multisystem autoimmune disease. Recent studies demonstrated an increased incidence of osteoporosis (OP) and fractures1 in SLE patients. Glucocorticoids (GCs) are one of the main therapies for SLE and in the setting of long-term intake (>5mg/day prednisolone equivalent) demonstrate deleterious effects on bone quality2 leading ultimately to glucocorticoid-induced-osteoporosis (GIO). Recent findings point to the role of bone marrow adipose tissue (BMAT) as a potential biomarker of bone health and quality3,4. The composition of BMAT in SLE patients has not been previously investigated. Therefore, our aim was to use 3T Chemical Shift Encoded- MRI (CSE-MRI) to assess the BMAT composition of a SLE population and compare it to that of OP patients, GC users with GIO status, and young healthy premenopausal women (PRE).Material & Method
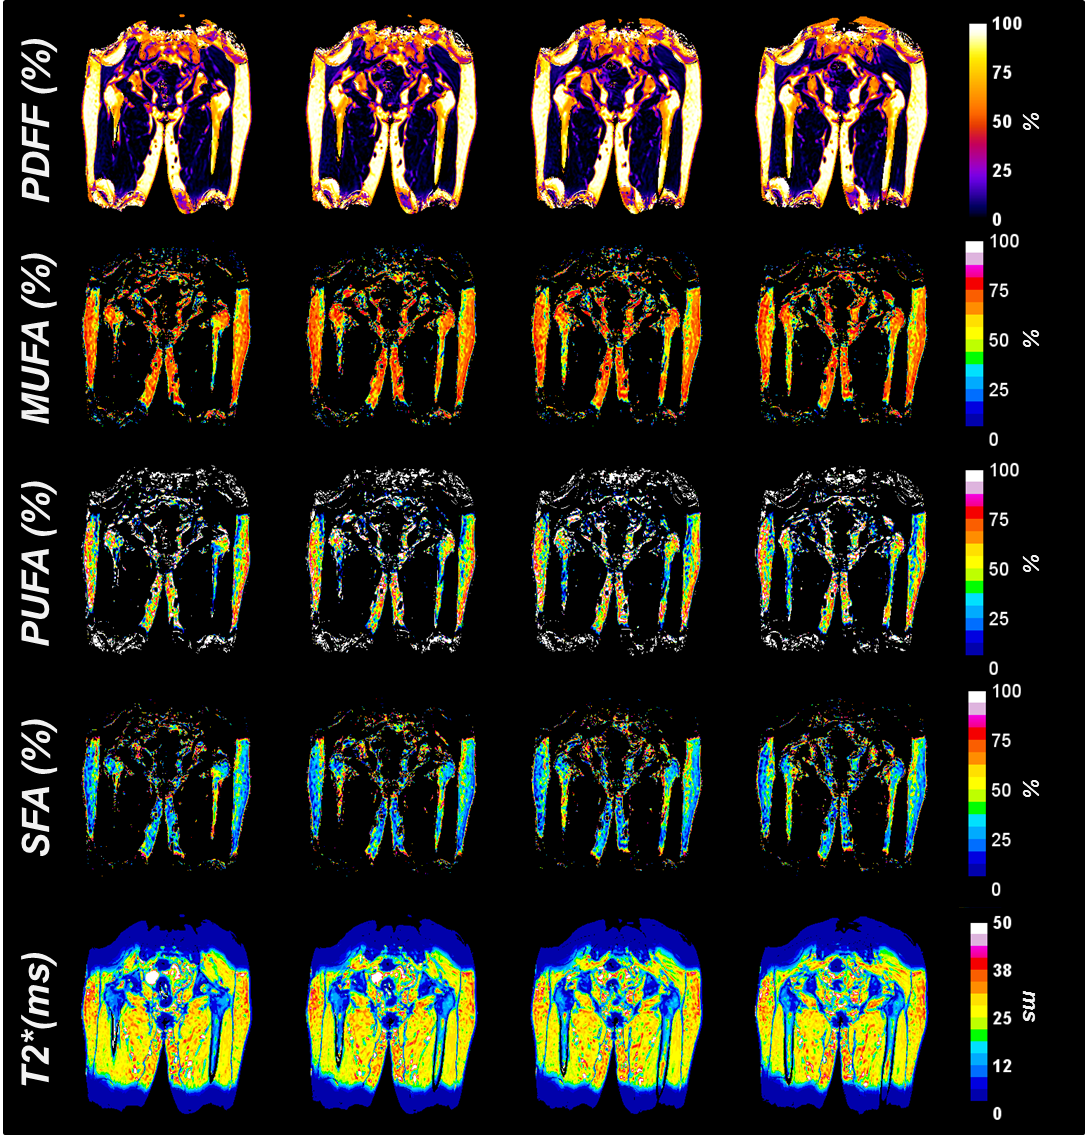
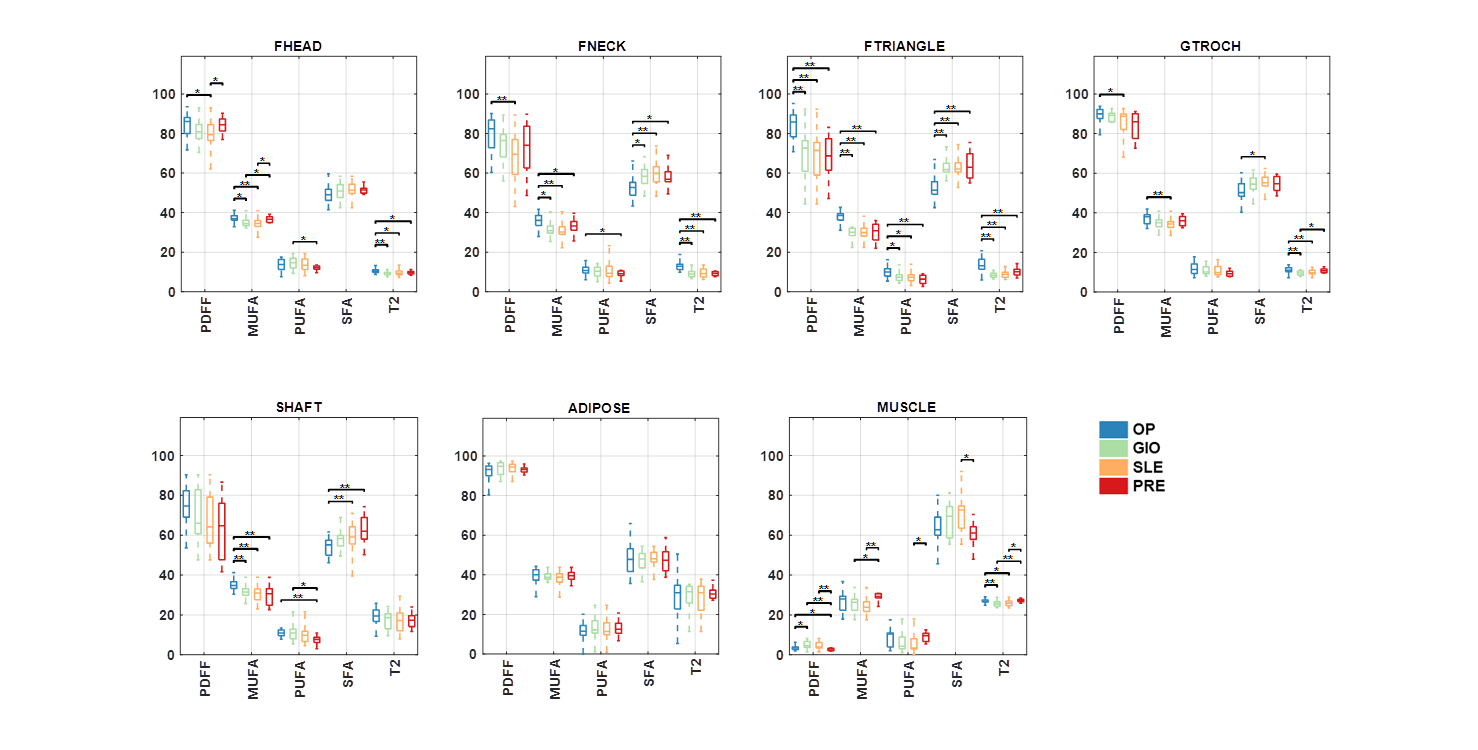
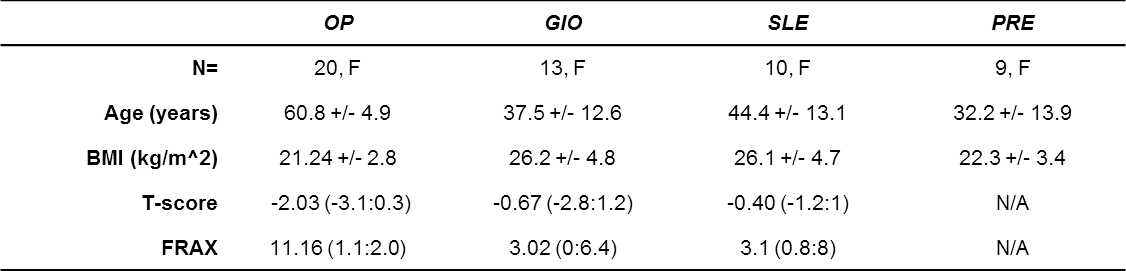
This study had institutional review board approval and written informed consent was obtained from all subjects. All subjects were recruited from the Rheumatology division at our institution. The subject characteristics are provided in table 1. MR acquisitions were performed on a 3T MRI system (Siemens healthineers, Erlangen, Germany) using 3D spoiled gradient echo sequence with a n=12 echoes train length (n ×1.2ms) with flyblack readout gradient. TR/FA = 16ms/5° and BW= 2000 Hz/px. 32 coronal slices were acquired. Fat content (Proton Density Fat Fraction (PDFF)) and fatty acid composition quantification (saturated (SFA), monounsaturated (MUFA) and polyunsaturated (PUFA)) were computed as parametric maps according to previously described method5,6. Subregions of the proximal femur were defined by drawing ROIs in the femoral head (FHEAD), femoral neck (FNECK), great trochanter (GTROCH), Ward’s triangle (FTRIANGLE), femoral shaft (FSHAFT) subcutaneous adipose tissue of the thigh (ADIPOSE) and in the thigh muscle (MUSCLE). Statistical differences in BMAT composition between OP/GIO/SLE/PRE were investigated using Mann-Whitney non-parametric test.Results
Typical parametric maps are shown in Figure 1. Differences between subjects are shown in Figure 2. Overall, SLE have lower unsaturation and higher saturation in BMAT compared to OP ( notably in FNECK: -11 %PDFF , -5 %MUFA , +7 %SFA, -3.6ms T2*, all p<0.01, FTRIANGLE: -16 %PDFF, -9.8 %MUFA ,+12 %SFA,-5ms T2*, all p<0.01 and -2.2 %PUFA, p<0.05, GRTROCH: -5.6 %PDFF, +3.7% SFA, p<0.05, -2.3 % MUFA, -1.4 ms T2*, p<0.01) and PRE (in FNECK: -5.6 %PDFF, -2.3 %MUFA, p<0.05, in MUSCLE: +2.6% PDFF, -6.5 %MUFA, -1 %PUFA, +7.5 %SFA, - 1.4 ms T2*, p<0.05). No differences were found between GIO and SLE in term of amount and composition in each subregions.Conclusion
3T CSE-MRI allows detection of differences in BMAT composition in SLE subjects compared to OP subjects, GIO subjects, and premenopausal women. Specifically, SLE subjects demonstrated higher SFA and lower MUFA and PUFA compared to OP and PRE subjects. The results provide further evidence for the role of marrow fat composition in bone health.Acknowledgements
No acknowledgement found.References
1. Bultink IE, Lems WF. Lupus and fractures. Curr Opin Rheumatol. 2016;28(4):426-432.
2. Lems WF. Glucocorticoids: bad or safe for the bones? RMD Open. 2015;1(Suppl 1):e000050. 3. Yeung DK, Griffith JF, Antonio GE, Lee FK, Woo J, Leung PC. Osteoporosis is associated with increased marrow fat content and decreased marrow fat unsaturation: a proton MR spectroscopy study. J Magn Reson Imaging. 2005;22(2):279-285.
4. Pietro G, Capuani S, Manenti G, R. M. Di : Bone Marrow Lipid Profiles from Peripheral Skeleton as Potential Biomarkers for Osteoporosis: A 1H-Study. Acad Radiol. 2016;23:273-283.
5.Martel D, Leporq B, Bruno M, Regatte RR, Honig S, Chang G. Chemical shift-encoded MRI for assessment of bone marrow adipose tissue fat composition: Pilot study in premenopausal versus postmenopausal women. Magn Reson Imaging. 2018;53:148-155.
6. Leporq B, Lambert SA, Ronot M, Vilgrain V, Van Beers BE. Quantification of the triglyceride fatty acid composition with 3.0 T MRI. NMR Biomed. 2014;27(10):1211-1221.
Figures