1288
Comparison of Quantitative MRI Fat-Fraction measurement in SIJ joint on different scanner platforms1Medical Physics and Biomedical Engineering, University College London Hospitals, London, United Kingdom, 2Centre for Medical Imaging, University College London, London, United Kingdom, 3Royal National Hospital for Rheumatic Diseases, Bath, United Kingdom
Synopsis
Proton density fat fraction (PDFF) measurements can quantify oedema and fat metaplasia in patients with spondyloarthritis. The reproducibility of PDFF measurement in the bone marrow of the sacroiliac joint was assessed in volunteers on 3 systems from different manufacturers, using a range of specialist and base-level product protocols. PDFF measurements on different platforms correlate well, but there is also a bias between the base-level and advanced methods. Performing an offline reconstruction with a multi-peak fat model and a T2* correction term reduces this bias.
Introduction
Spondyloarthritis is an inflammatory disease with clinical features of back pain, spinal stiffness and loss of mobility1. Active inflammation causes an increase in bone marrow water content (oedema); in later disease, areas of healed inflammation often show an increase in fat content above that of normal bone marrow (fat metaplasia)2. Identification of bone and joint inflammation facilitates treatment choices, including the use of biologic therapies. Proton density fat fraction (PDFF) measurements can quantify oedema and fat metaplasia, and offer a more objective approach to diagnosis and disease stratification than conventional MRI3. All of the major MRI equipment manufacturers have PDFF imaging products available that combine a complex multi-peak fat-spectrum model with simultaneous determination and correction for T2* signal decay. However, if the appropriate specialist imaging option has not been purchased, as is commonly the case, then the user may have to rely on simpler base-level protocols for FF measurement. The purpose of this study was to assess the reproducibility of FF/PDFF measurement across systems from 3 major manufacturers, at different geographical sites, to assess the potential for roll-out of FF/PDFF measurements in multi-centre clinical trials and clinical practice.Methods
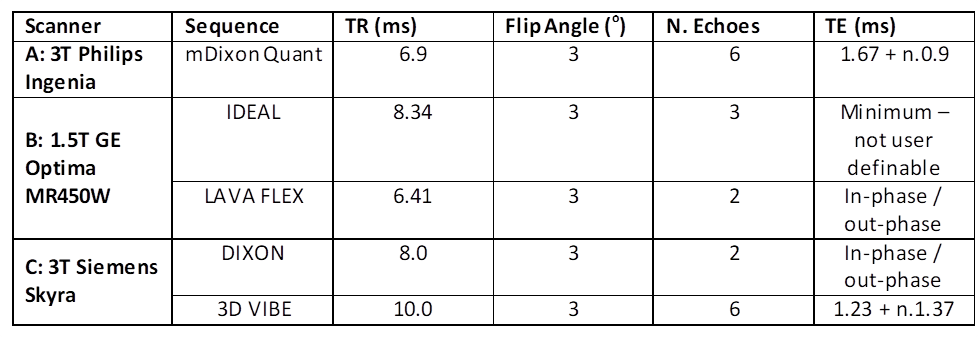
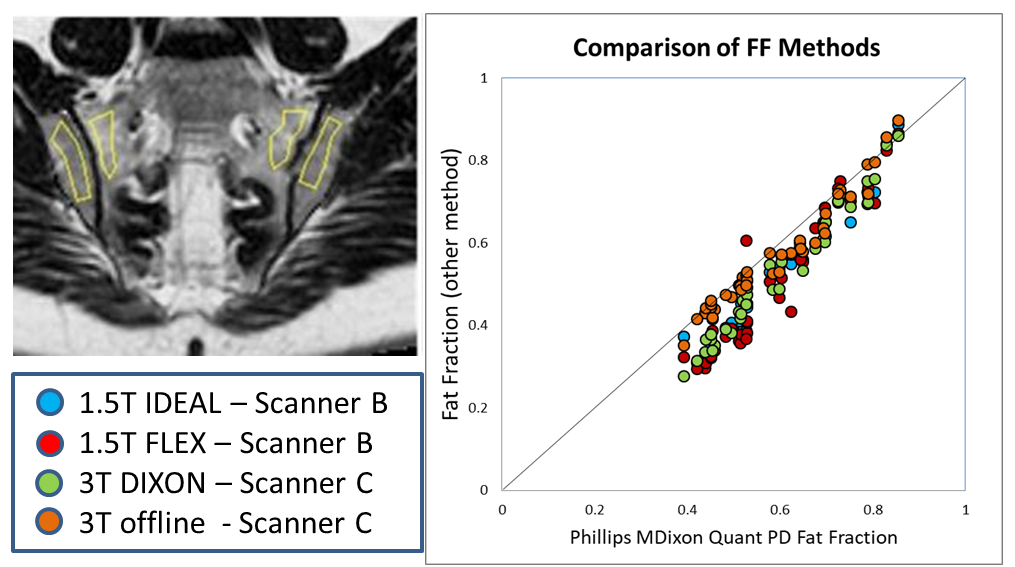
The sacroiliac joints (SIJs) of 10 healthy volunteers (mean age 42 years, range 23-63) were scanned on 3 scanners: A) 3T Philips Ingenia, using mDixon Quant (MDQ); B) 1.5T GE Optima MR450W, using IDEAL and FLEX; and c) 3T Siemens Skyra, using DIXON. MDQ is a specialist PDFF package that uses data from 6 different echo-times, fits a 7-peak fat model and incorporates T2* correction, whereas the GE and Siemens have equivalent base-level packages: IDEAL uses data from 3 echo-times, and FLEX and DIXON from 2. Each technique yields fat-only (F) and water-only (W) images. FF images were calculated using the formula: FF = F / (W + F). Additionally, on scanner C a 3D multi-echo gradient echo dataset was acquired with 5 echo times, yielding magnitude images only at each echo time. These data were fitted offline using a magnitude-based signal model including 6 fat peaks4 and a T2* correction term5. The F and W images from the DIXON acquisitions were used to initialise (specifically provide a ‘first guess’ for) the offline fit. Acquisition parameters are shown in Figure 1. Regions of interest (ROIs) were drawn in the SIJ as shown in the figure. MDQ PDFF was used as the ‘gold-standard’ measurement for comparison to IDEAL, FLEX, DIXON and the offline model fit.Results
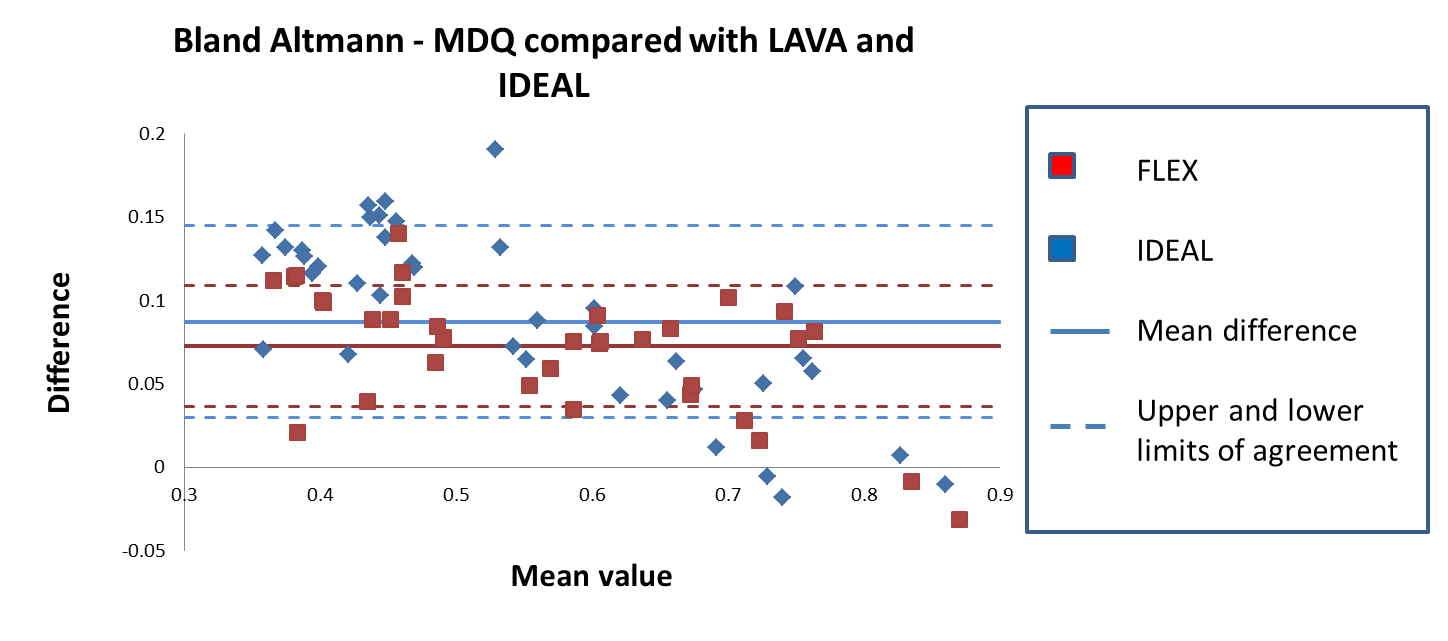
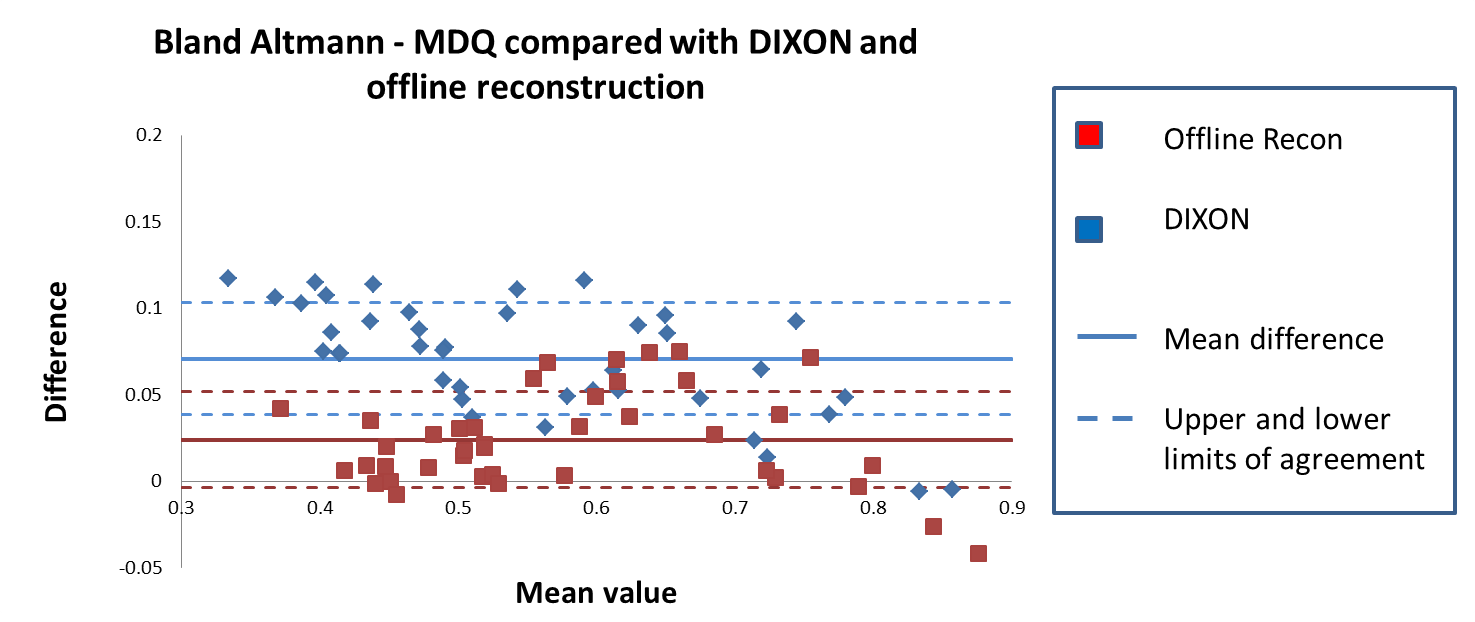
A correlation plot showing data from all methods compared with MDQ PDFF is shown in Figure 2. A Bland Altman plot comparing MDQ PDFF with FLEX and IDEAL is shown in Figure 3. A Bland Altman plot comparing MDQ PDFF with DIXON and also with the offline fitted data is shown in Figure 4. IDEAL, FLEX and DIXON were all similarly biased compared with MDQ PDFF with a mean differences of 0.09 (FLEX), 0.07 (IDEAL) and 0.071 (DIXON). The offline fitted data had a mean difference of 0.024 compared with MDQ PDFF; this was significantly lower than for DIXON from the same machine (p< 0.001, paired t-test).Discussion
FF is a potentially viable imaging biomarker of disease activity and response to therapy in spondyloarthritis. PDFF methods are available from all the main MRI manufacturers (MDQ from Philips; IDEAL IQ from GE; and q-DIXON from Siemens). However, dependant on scanner configuration, users may have to rely on base-level packages. FF measurements on different platforms, using a range of product methods, correlate well, but there is also a bias of approximately 7-9% between the base-level methods and the PDFF method tested (MDQ). This difference is lower than the changes in FF seen in pathology3; however, viable imaging biomarkers should be repeatable and reproducible on different platforms and at expert and non-expert centres6. A potential approach to this problem is to develop a common reconstruction applicable to all platforms. A number of offline methods for measuring fat fraction from multi-echo datasets have been published, but the majority require access to phase, as well as magnitude images that may not be readily available. Reconstruction is possible using magnitude data, but typically suffers from assignment errors between fat and water. Using the FF images calculated from the DIXON acquisitions as a first guess for a magnitude-only reconstruction of the multi-echo GE data from scanner C. Including a multi-peak fat model and a T2* correction term, the measurement bias compared with MDQ was significantly smaller than that of DIXON.
Acknowledgements
NS, and MHC receive funding from the UCL/UCLH BRC. NS is supported
by the Radiological Research Trust (RRT) for this work. TJPB is supported by
Arthritis Research UK Grant 21369.
This work was undertaken at UCLH/UCL, which receives funding from the
UK Department of Health’s the National Institute for Health Research (NIHR)
Biomedical Research Centre (BRC) funding scheme. The views expressed in this
publication are those of the authors and not necessarily those of the UK
Department of Health.
References
[1]: Wanders A, Landewé R, Dougados M, Mielants H, van der Linden S, van der Heijde D. Association between radiographic damage of the spine and spinal mobility for individual patients with ankylosing spondylitis: can assessment of spinal mobility be a proxy for radiographic evaluation? Ann Rheum Dis. 2005;64(7):988–94.
[2]: Sieper J, Rudwaleit M, Baraliakos X, Brandt J, Braun J, Burgos-Vargas R, et al. The Assessment of SpondyloArthritis international Society (ASAS) handbook: a guide to assess spondyloarthritis. Ann Rheum Dis. 2009;68 Suppl 2(May):ii1-44.
[3]: Bray TJP, Bainbridge A, Punwani S, Ioannou Y, Hall-Craggs MA. Simultaneous Quantification of Bone Edema/Adiposity and Structure in Inflamed Bone Using Chemical Shift-Encoded MRI in Spondyloarthritis. Magn Reson Med. 2018 Feb;79(2):1031-1042.
[4]: Hamilton G, Yokoo T, Bydder M, Cruite I, Schroeder ME, Sirlin CB, Middleton MS. In vivo characterization of the liver fat ¹H MR spectrum. NMR Biomed. 2011 Aug;24(7):784-90.
[5]: Bydder M1, Yokoo T, Hamilton G, Middleton MS, Chavez AD, Schwimmer JB, Lavine JE, Sirlin CB. Relaxation effects in the quantification of fat using gradient echo imaging. Magn Reson Imaging. 2008 Apr;26(3):347-59. Epub 2008 Feb 21.
[6]: O'Connor JP, Aboagye EO, Adams JE et al. Imaging biomarker roadmap for cancer studies. Nat Rev Clin Oncol. 2017 Mar;14(3):169-186.
Figures