1282
Mapping of myoglobin oxygen saturation dynamics in the calf during ischemia with a modified slab-selective 2D NMRSI pulse sequence at 3T.1NMR Laboratory, Institute of Myology, Paris, France, 2NMR Laboratory, CEA / DRF / IBFJ/ MIRCen, Paris, France, 3Division MR Physics, Center for Medical Physics and Biomedical Engineering, Medical University of Vienna, Vienna, Austria, 4High Field MR Center, Medical University of Vienna, Vienna, Austria, 5NMR Laboratory, CEA / DRF / IBFJ / MIRCen, Paris, France
Synopsis
Myoglobin in its deoxygenated form is a 1H NMR visible biomarker of intracellular oxygenation. Its low concentration and very short relaxation times have been major challenges to map deoxy-myoglobin dynamically during a transient state, such as ischemia. Here, we interleaved the acquisition of a full 2D CSI data set at the dMb frequency (~79 ppm), a non-localized dMb spectrum and an anatomical image with radial encoding to track dMb dynamics during an ischemic bout with a temporal resolution of 3.5 seconds. Promising proof-of-concept results are shown. This method suggests a strong potential for energy metabolism studies in vivo.
Purpose
Myoglobin (Mb) is a reversible O2 carrier found in muscle. When desaturated, the n-δ proton in F8 histidine is 100% visible by 1H NMR at ~79 ppm and it can be used as an intracellular oxygenation marker1. Despite its low concentration (~250 µM in muscle), the T1 time of deoxygenated Mb (dMb) of ~10 ms at 1.5 T2 allows for fast signal averaging. dMb dynamics have been measured during hypoxia, ischemia or exercise3-8 using pulse-acquire sequences. Tran et al. also performed 2D CSI of dMb in the calf but with a 7-min acquisition time9. Location dependence of dMb content, resaturation time, energy metabolism and blood flow, even along the same muscle, have been reported10,11 and dMB NMRSI is potentially a powerful tool to further investigate the spatial heterogeneity of the skeletal muscle oxidative metabolism. Here, we modified a CSI sequence and interleaved its acquisition with pulse-acquire NMRS and 1H NMRI to track dMb dynamics with a 3.5 s temporal resolution.Methods
Experiments were performed on a 3T Prisma scanner (Siemens Healthineers) on the same volunteer and calf with two different 1H RF coils for comparison. The first coil is a 1Tx/15Rx knee volume coil (QED) and the second coil comprises a Tx-only volume transmitter (20 cm inner diameter) with an inner semi-flexible 18Rx phased-array (3 rings of 6 elements with a sensitive length of 20 cm along the main magnet field direction) built by RAPID Biomedical. Ischemia was achieved with a cuff placed proximal to the knee (8 mins, 250 mmHg).
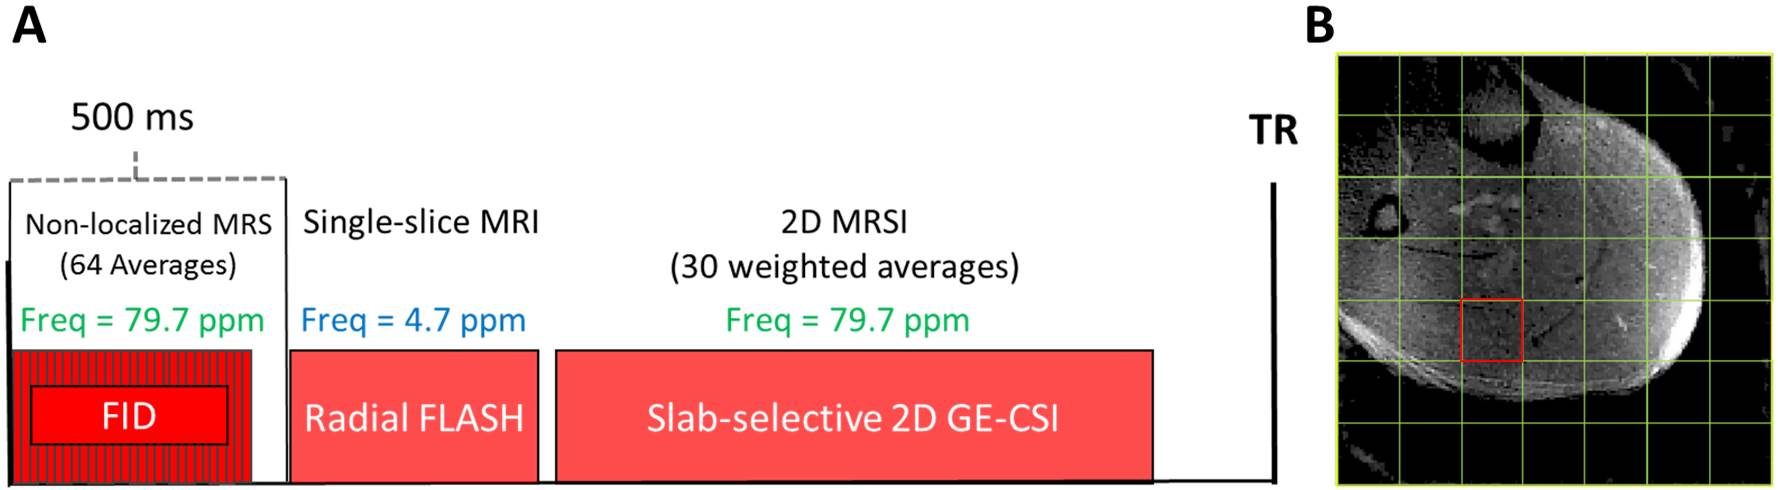
The interleaved 1H NMR pulse sequence acquired 64 non-localized (FID) spectra (256 points, 40 kHz bandwidth), a 2D image (FLASH, radial read-out, 196 points, 64 spokes, 120x120 mm² FOV) and a slab-selective 2D CSI data set (256 points, 40 kHz bandwidth, 30 elliptically-weighted averages, 7x7 encoding matrix, 120x120 mm² FOV, 9 cm slab thickness, TE = 0.45 ms, Gaussian RF pulse length = 0.5 ms) every 3.5 s (fig. 1).
Data was analyzed using in-house Matlab routines (The MathWorks). Radial images were reconstructed using a non-uniform FFT algorithm12. CSI data was reconstructed using Hamming weighting. The 64 FID spectra acquired per TR were averaged. NMRS data was baseline-corrected before applying first- and zero-order phase corrections. Two coil combination schemes of the CSI data were employed: the first giving equal weighting for all channels and the second one using a voxel-specific coil weighting determined by its signal magnitude (Brown method13). DMb quantification was performed by integrating the real part of the dMb resonance after baseline correction on Matlab. No line broadening was applied.
Results
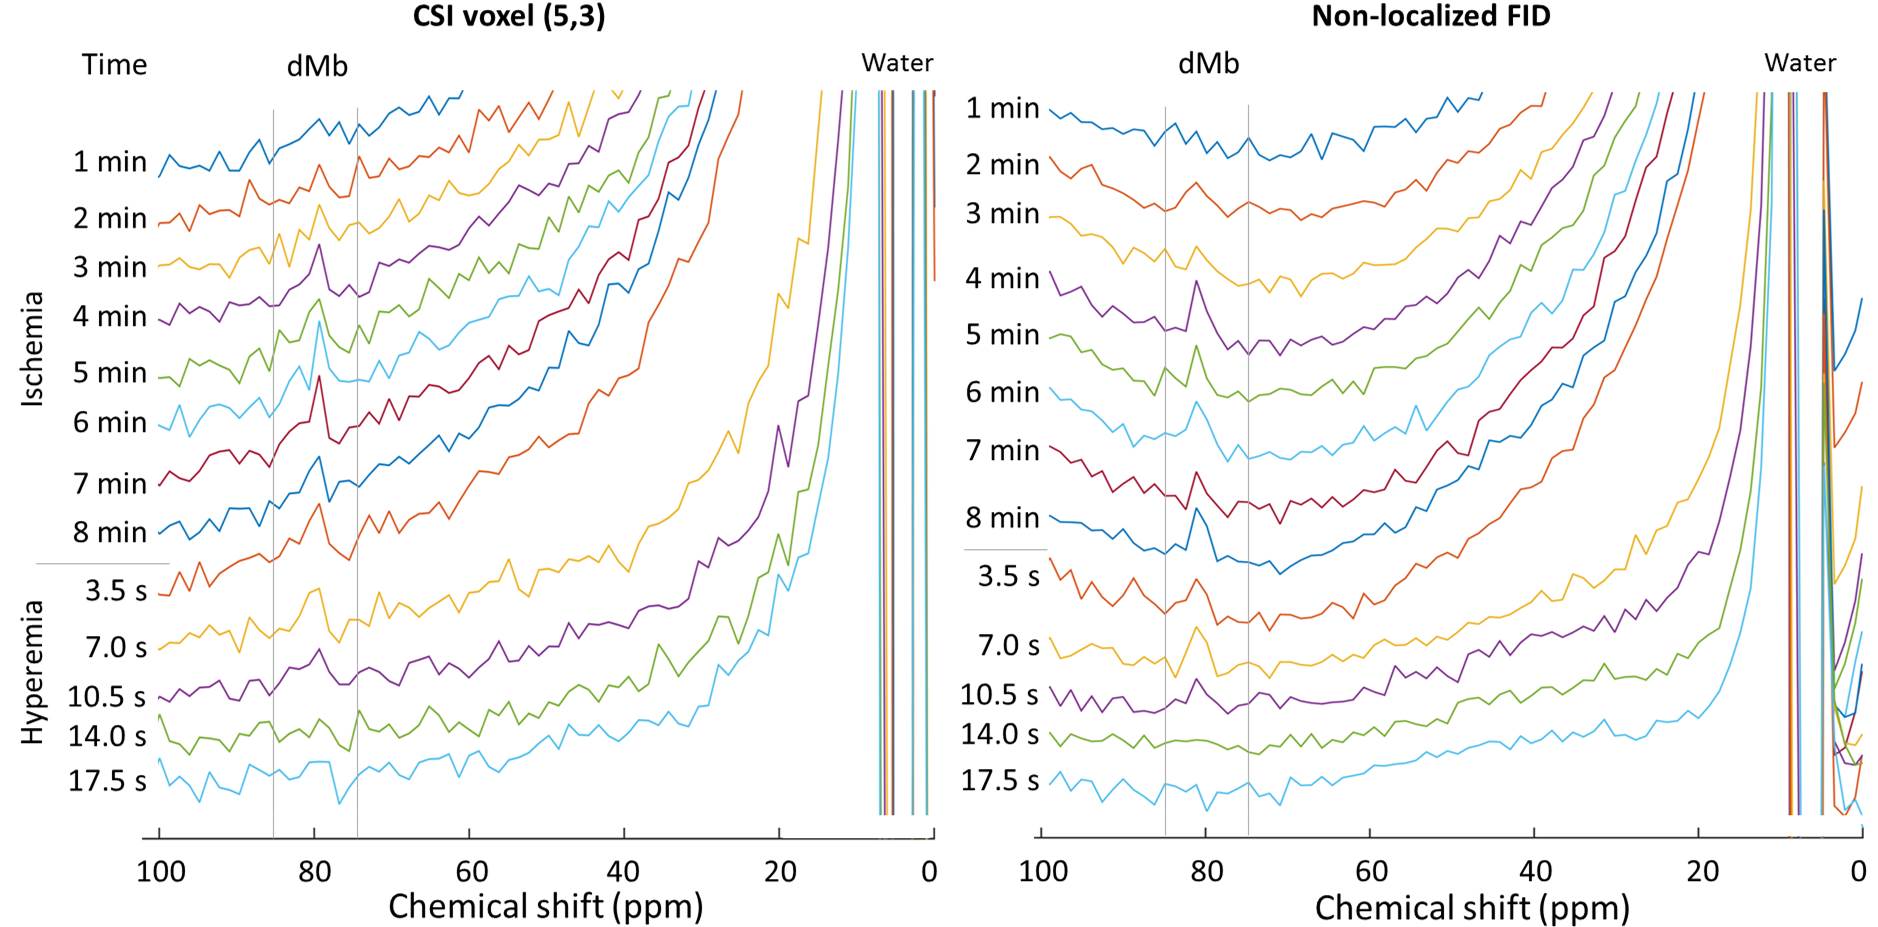
dMb was detected in both the CSI data and FID spectra acquired during ischemia (fig 2). The dMb resonance reached a plateau about 4 min after the onset of ischemia, and dropped to noise levels within 10 to 14 seconds upon release, as observed in earlier reports7,14.
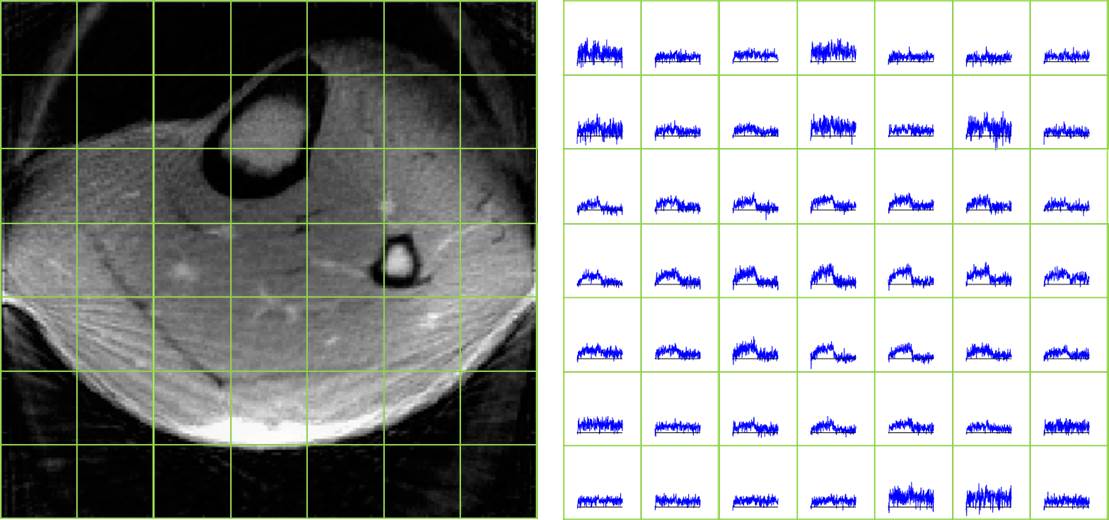
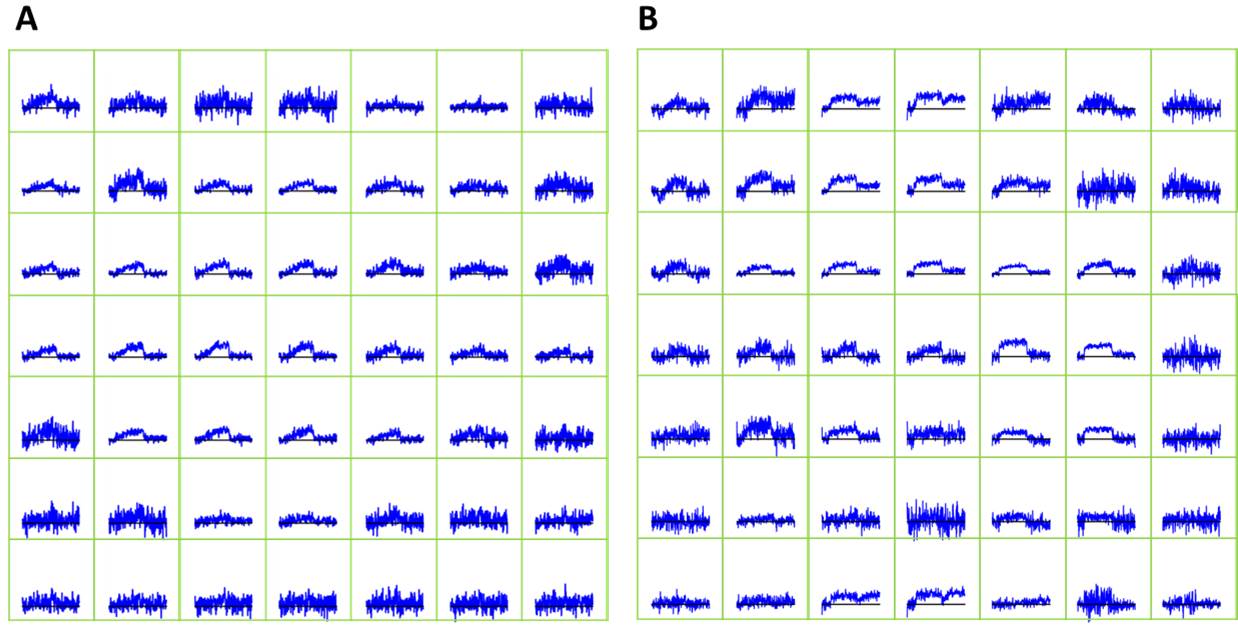
The CSI time courses of the measured deoxy-myoglobin concentration using the QED coil are shown in fig. 3, where no coil weighting was applied before their combination. The time courses obtained with the RAPID Biomed coil and reconstructed using the two coil combination methods are presented in fig 4. The Brown’s method enhanced the sensitivity to the dMb dynamics in voxels in the periphery of the leg.
Discussion & Conclusion
This work demonstrates the possibility to track dMb dynamics spatially using 2D CSI.
Current CSI limitations include a relatively coarse encoding matrix, which is exacerbated by the used elliptical acquisition weighting and Hamming filter which broaden the 1D spatial resolution by 85% of the nominal matrix15. Furthermore, adapting the flip-angle excitation (currently 90°) to the Ernst angle could boost SNR while reducing energy deposition, which prevented us to use a shorter TR of 3 s.
The reduced SNR of NMRSI and the water sideband demand particular attention with regard to the coil combination scheme. In the RAPID Biomed data where the coil's sensitive volume was more than twice as large as the CSI slab, weighting the coils had a major impact on multiple voxels. To further improve data quality and to account for coil coupling, alternative coil combination schemes will be explored16.
These localized dMb measurements suggest a potential for the dMb CSI technique in the evaluation of muscle energy metabolism, particularly when coupled with muscle ASL perfusion measurements and ATP generation rates using localized 31P NMRS3,17-19. Since the feasibility of interleaving it with 1H NMRI is demonstrated, future work will focus on interleaving ASL measurements with dMB MRSI over a larger number of subjects and with an additional ischemic exercise paradigm.
Acknowledgements
No acknowledgement found.References
1. Jue T, Anderson S. Magn Reson Med. 1990; 13:
524-528.
2. Wang Z, Wang DJ, Noyszewski EA, Bodgan A, Haselgrove
J, Reddy R, zimmerman R, Leigh J. Magn Reson Med 1992; 27:362-367.
3. Carlier PG, Bertoldi D, Baligand C, Wary C, Fromes
Y. NMR Biomed. 2006; 19: 954-967.
4. Bendahan D, Chatel B, Jue T. Am J Physiol regul
Integr Comp Physiol. 2017; 313: R740-R753.
5. Richardson RS, Wary C, Wray DW, Hoff J, Rossiter HB,
Layec G, Carlier PG. Med Sci Sports Exerc. 2015; Vol 47, 11: 2299-2307.
6. Richardson RS, Duteil S, Wary C, Wray DW, Hoff J, Carlier
PG. J. Physiol. 2006; 571: 415-424.
7. Brillault-Salvat C, Giacomini E, Jouvensal C, Wary
G, Bloch G, Carlier PG. NMR Biomed. 1997; 10: 315 – 323.
8. Vanderthommen M, Duteil S, Wary C, Raynaud JS,
Leroy-Willig A, Crielaard JM, Carlier PG. J Appl Physiol. 2003; 94: 1012-1024.
9. Tran TK, Sailasuta N, Hurd R, Jue T. NMR Biomed.
1999; 12: 26-30.
10. Boss A, Heskamp L, Breukels V, Bains LJ, van Uden
MJ, Heerschap A.J Physiol. 2018; 596(8): 1467-1483.
11. Kreis R, Bruegger K, Skjelsvik C, Zwicky S, Ith M,
Jung B, Baumgartner I, Boesch C. Magn Reson Med; 2001. 46:240-248.
12. Fessler, JA & Sutton BP. IEEE Trans on Signal
Processing. 2003; 51(2):560-574.
13. Hall EL, Stephenson MC, Price D, Morris PG. Neuroimage.
2013; 86 : 35-42.
14. Duteil S, Bourrilhon C, Raynaud JS, Wary G, Richardson
RS, Leroy-Willig A, Jouanin JC, Guezennec CY, Carlier PG. Am j Physiol Regul
Integr Comp Physiol. 2004; 287: 1441 – 1449.
15. De Graaf, RA. In
Vivo NMR Spectroscopy – 2nd edition: Principles and Techniques.
John Wiley & Sons, 2007.
16. Rodgers CT, Robson MD. Magn Reson Med. 2016; 75(2): 473-487.
17. Lopez Kolkovsky AL, Reyngoudt H, Giacomini E, Niess
F, Meyerspeer M, Carlier PG. ESMRMB. Barcelona, Spain; 2017. Pg. 996.
18. Niess F, Schmid A, Fiedler GB, Frass R, Bogner W,
Lopez Kolkovsky AL, Carlier P, Moser E, Meyerspeer M. ISMRM. Paris, France;
2018. Pg. 0624.
19. Valkovic L, Chmelik M, Meyerspeer M, Gagoski B,
Rodgers CT, Krssak M, Andronesi OC, Trattnig S, Bogner W. NMR Biomed. 2016;
29:1825-1834.
Figures