1281
Multi-parametric MRI analysis of the temporal changes of induced damage and regeneration in dystrophic hind limb muscles1Department of Radiology, University of Washington, Seattle, WA, United States, 2Department of Neurology, University of Washington, Seattle, WA, United States, 3Senator Paul D. Wellstone Muscular Dystrophy Cooperative Research Center, University of Washington, Seattle, WA, United States, 4Department of Biochemistery, University of Washington, Seattle, WA, United States
Synopsis
The mdx mouse model is one of the most commonly used animal models for Duchenne muscular dystrophy (DMD). Although the mdx model has a milder phenotype compared to patients with DMD, the model has shown the similarity in some histopathologic events resulting in wide utilizations in preclinical studies for both disease progression and therapeutic intervention. Over the years MRI has been increasingly being utilized to monitor the disease progression in dystrophic mice and DMD patients. We performed MRI to discriminate the time course of damage in regeneration in skeletal muscles if mdx mice.
Introduction
Duchenne muscular dystrophy (DMD), X-linked autosomal inherited disease is characterized by absence of functional protein dystrophin (dys) leading to muscle damage and wasting [1, 2]. Clinical measures of muscular dystrophy rely on surgical biopsy, which is invasive and provide limited overview of the disease progression. Magnetic resonance imaging (MRI) has the potential to detect pathological changes at the cellular and tissue level in skeletal muscle as it probes different aspects of the spin properties of 1H in tissue water, which are affected by the physiological and pathological status of the tissue. The purpose of this study was to characterize the response of muscles in mdx mice to damage induced by myotoxin injection using MRI as a non-invasive biomarker [3].Methods
We performed multi-parametric MRI to evaluate the changes in young dystrophic mice. The anterior compartment of hind limb muscles of dystrophic mice (12 week old, mdx4cv, n=10) was injected with 50 mL of 0.125 M BaCl2. The mice were imaged on a Bruker 14T Avance MR spectrometer (Bruker Corp. Billerica, MA) on day 0, 1, 2, 3, 5, 7, 14, and 21 post injection to study pathophysiological changes occurring in the muscles. The high resolution MRI protocol included scout imaging (gradient echo, TR (repetition time)/ TE (echo time) = 100/3.42 ms), planning for image planes (multi-slice RARE (rapid acquisition with refocused echoes): TR/TE = 667.54/4.47 ms), high resolution 2 dimensional imaging with 55 thin slices (22 micron thick) (multi-slice RARE: TR/TE = 5031.363/10 ms) for muscle volume evaluation, multi-slice images with refocused echoes for T1 measurements (TR/TE = 5500, 3000, 1500, 1000, 385.8/9.66), multi-slice multi echo imaging (TR/TE = 4000/6.28-7.54 ms, 12 echoes with 6.28 ms spacing) for transverse relaxation time T2 measurements, magnetization transfer (MT) imaging (gradient echo; TR/TE = 938.94/2.28 ms, flip angle 30o). All mice were euthanized at the completion of imaging with the leg tissues harvested for histology.Results and Discussion
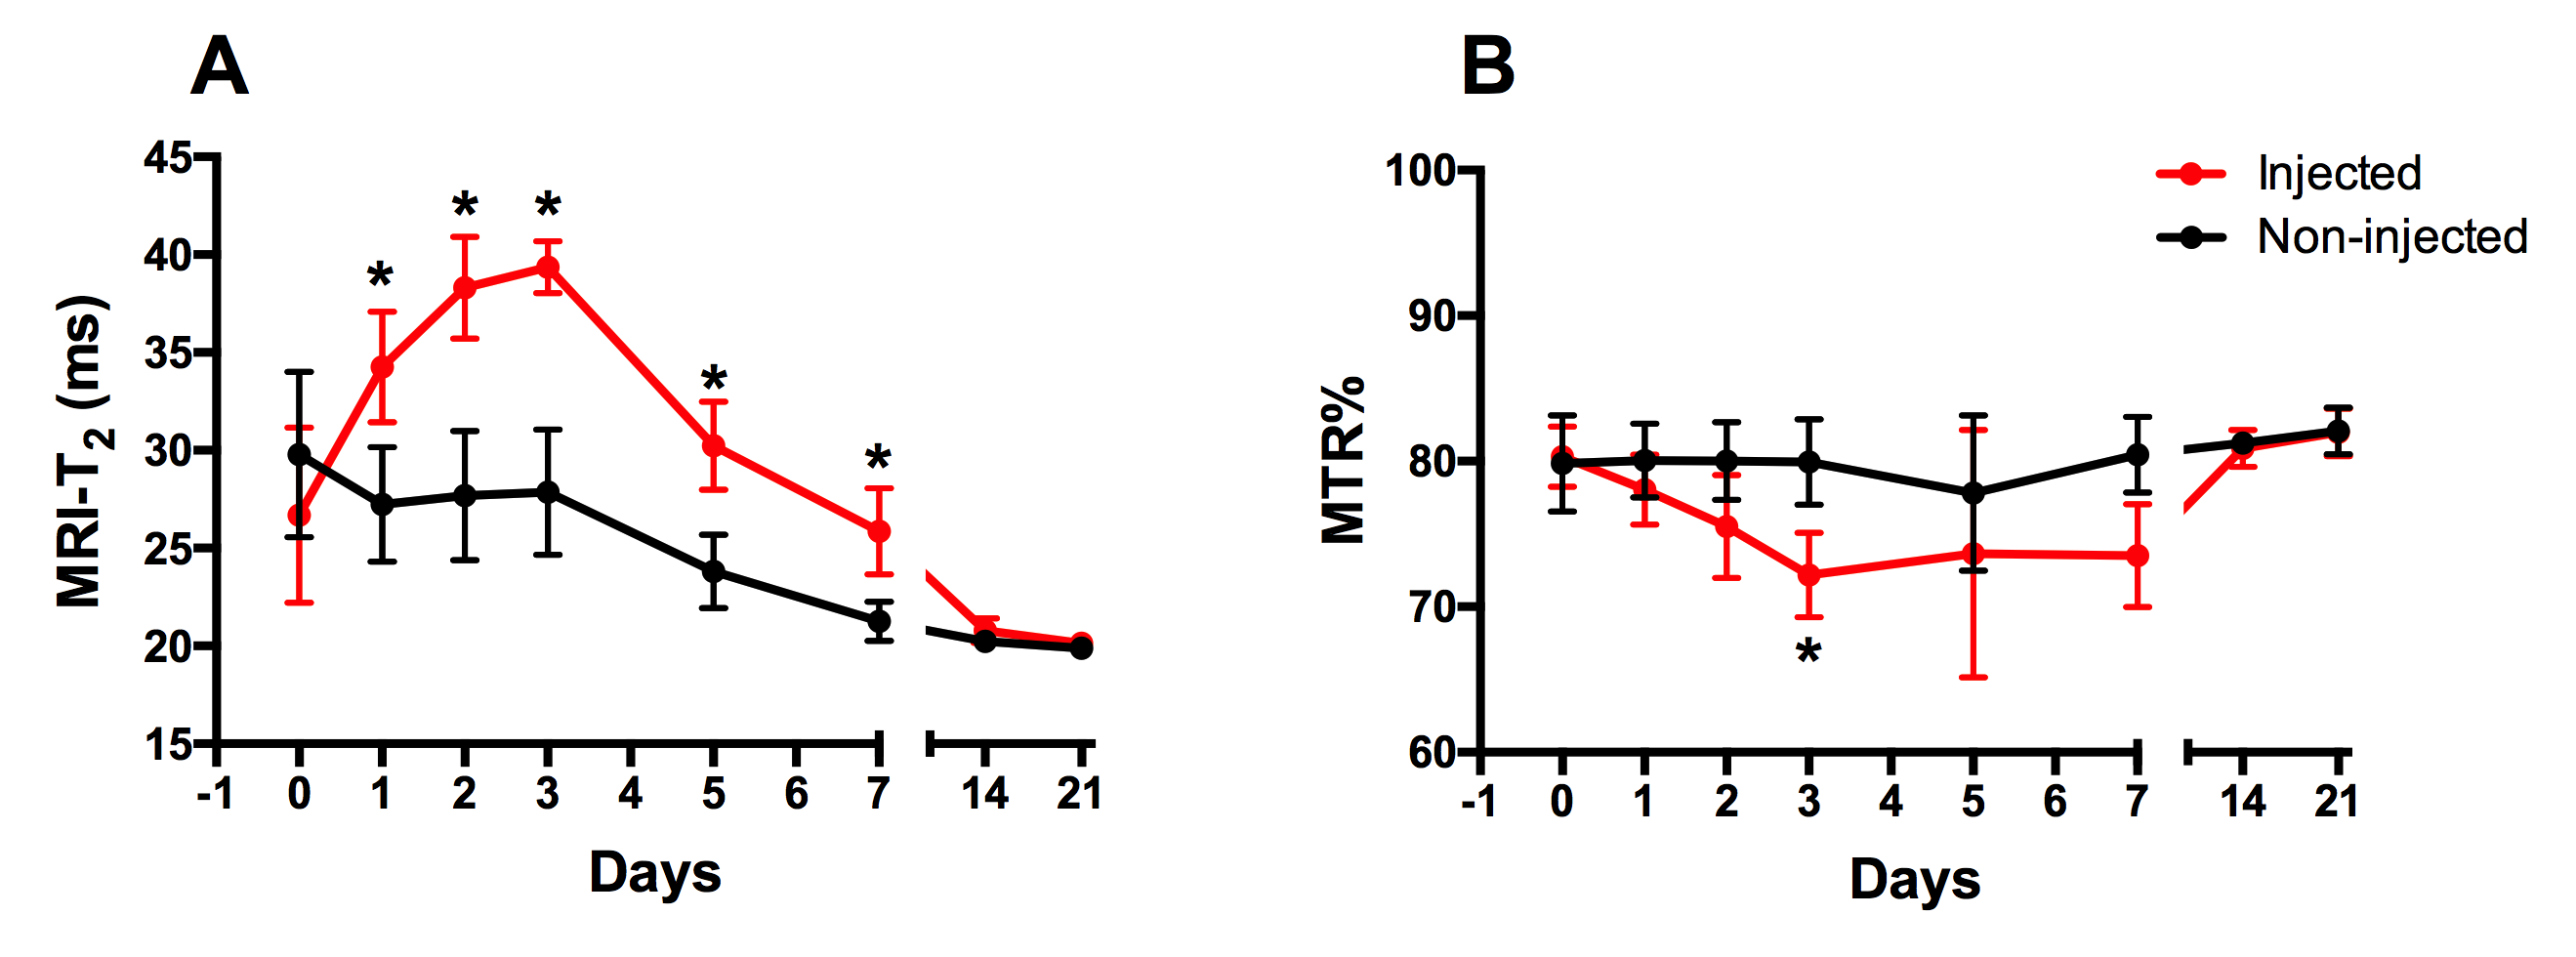
The images in the Figure 1 display the temporal evolution of MR parameters from one representative animal (T2, MTR). On further examining, the time course of the changes in T2 and MTR were slightly different during damage and regeneration process. There was a significant increase in T2 from 26.68 ± 4.50 ms at day 0 to 34.25 ± 2.83 ms at day 1. Furthermore, T2 peaked at day 3 post injection to 39.35 ± 1.32 ms after which T2 started to decline. T2 dropped to control levels at 14-days post injection (Injected; 20.78 ± 0.62 ms vs Non-injected; 20.23 ± 0.46 ms). T2 changes were maximal at 3-day post injection whereas MTR (%) changes were maximal between 3-7 days post injection and stayed there till 7 days post injection (72.17 ± 2.91% at day 3 and 73.65 ± 3.53 % at day 7). T2 values in the injected TA decreased and came to the levels of non-injected TA by day 14 (Injected; 20.78 ± 0.62 ms vs Non-Injected; 20.23 ± 0.46 ms) (Figure 2). Furthermore, there was significant decrease in muscle T2 from day 3 (27.87± 7.19 ms) to day 7 (21.26± 2.22 ms) in the non-injected. The data were exponentially fitted and times for maximal changes were estimated by nonlinear polynomial fits and these times were used to separate the initial and recovery phases (Figure 3). The results demonstrate that T2 peaks and MTR is minimum at day 3 post injection. Additionally, T2 remained elevated in non-injected leg till day 3, which could be due to increased loading on non-injected leg. Alteration in T2 has been associated with muscle damage, edema and and fibrotic tissue deposition [4]. Additionally, changes in MTR has been associated with the presence of inflammatory and myopathic processes [5]. T2 has been demonstrated to be more sensitive measure than MTR.Conclusion
The kinetics of change in the MRI parameters during the damage and repair phases in dystrophic muscles demonstrates that MRI can be used to distinguish the temporal changes between these processes. The changes observed in dystrophic skeletal muscles demonstrate MRI parameters may be used to track the disease progression and future treatment options.Acknowledgements
This project was supported by grants from the MDA 312455 (D.L), NIH R01CA188654 (D.L), NIH R01AR40864 (J.S.C).References
1. Bushby, K., et al., Diagnosis and management of Duchenne muscular dystrophy, part 1: diagnosis, and pharmacological and psychosocial management. Lancet Neurol, 2010. 9(1): p. 77-93.
2. Hoffman, E.P., et al., Dystrophin: the protein product of the Duchenne muscular dystrophy locus. Cell, 1987. 51(6):p.919-28.
3. Feng,S., et al., Multiparameter MRI analysis of the time course of induced muscle damage and regeneration. J Magn Reson Imaging, 2014. 404(4):p.779-88.
4. Vohra RS., et al.,Magnetic Resonance ImagingMonitoring of Disease Progression in mdx mice on different genetic backgrounds. American journal of Pathology. 2017; 187(9):2060-70.
5. McDaniel JD., et al., magnetization transfer imaging of skeletal muscle in autosomal recessive limb girdle muscular dystrophy. J Comput Assist Tomogr 1999; 23:609-614.
Figures