1280
Quantitative evaluation of muscular microvascular permeability by DCE-MRI and texture analysis in diabetic rabbits1Department of Radiology, Renmin Hospital of Wuhan University, Wuhan, China, 2GE Healthcare China, Beijing, China
Synopsis
Our purpose is to quantificationally evaluate the microvascular permeability and subtle changes in diabetic skeletal muscle by DCE-MRI and texture analysis. Alloxan-induced diabetic rabbits and normal rabbits were studied at fixed time points (0, 4, 8, 12, and 16 weeks). Permeability parameters Ktrans and Kep increased and then showed a downward trend, Ve increased and Vp decreased in diabetic group. Texture parameters based on Ktrans map showed difference between the two groups. We can draw a conclusion that the microvascular permeability of diabetic skeletal muscle increases while the perfusion decreases and texture analysis based on Ktrans map can detect these subtle changes in early stage.
Introduction
Skeletal muscle is one of the target tissues impaired by diabetes mellitus(DM), and is characterized by reductions in skeletal muscle structural, functional, and metabolic capacities, which can lead to muscular atrophy, weakness and increased fatigability1. Microvascular lesion, such as dysfunction of the capillary network and endothelial cells, is one of the key factors of this disease2. This paper aims to estimate the perfusion and microvascular permeability of skeletal muscle in a rabbit diabetes model by using quantitative dynamic contrast agent–enhanced magnetic resonance imaging (DCE-MRI) and discuss whether texture analysis based on volume transfer constant (Ktrans) map can evaluate the subtle changes of diabetic skeletal muscle in early stage.
Methods
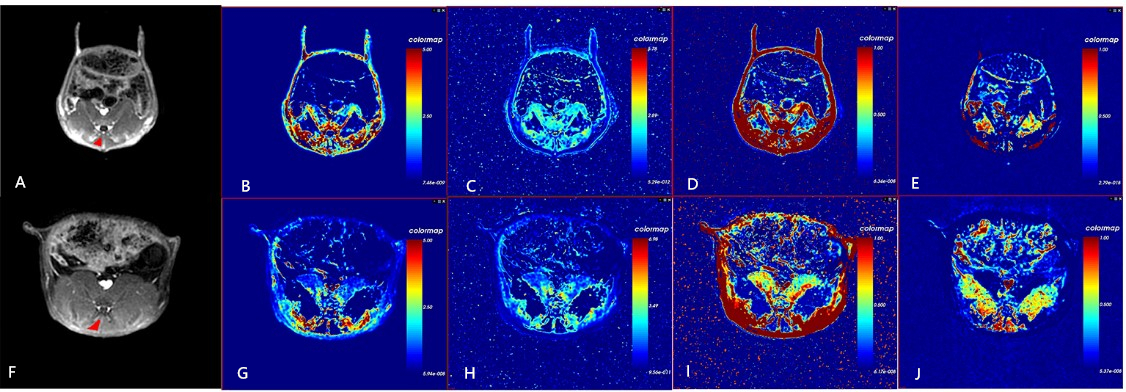
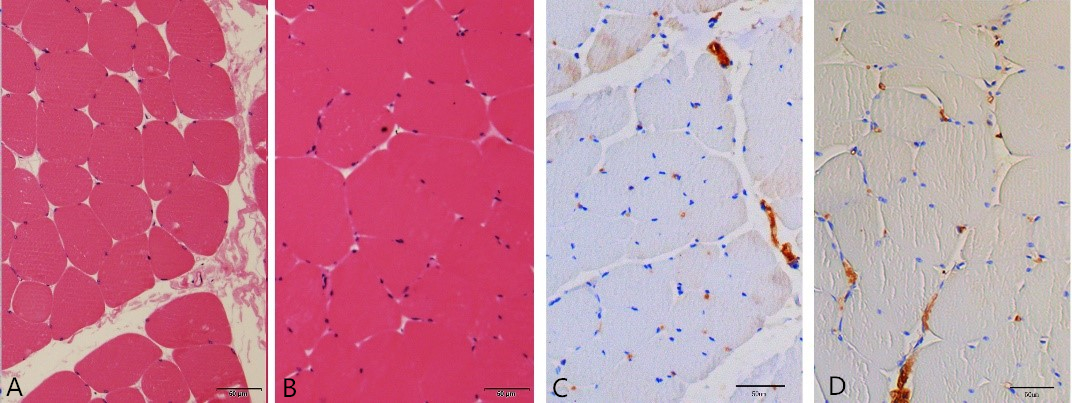
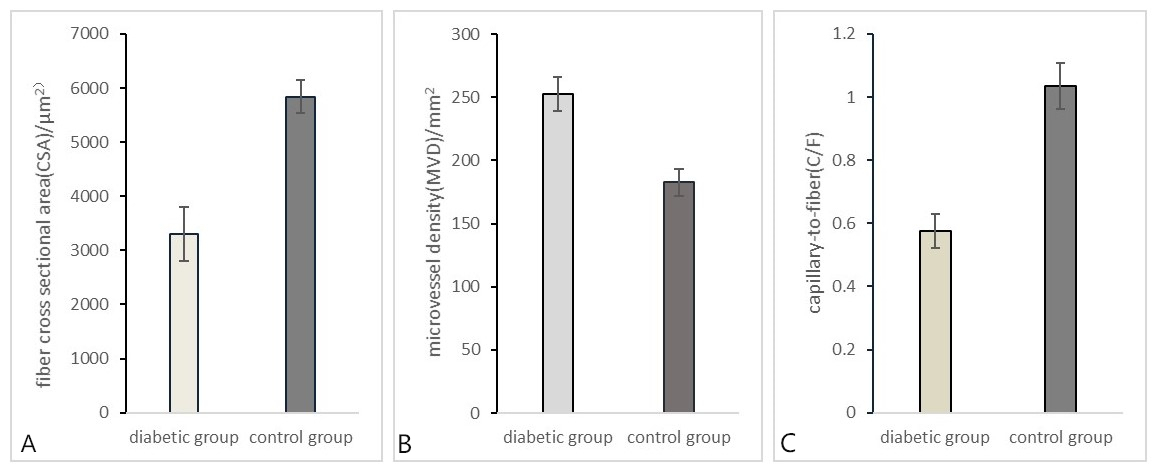
Eighteen young male Japanese big ear rabbits (about 3.0 kg) were randomly assigned to diabetic (n=10) and control (n=10) group. All rabbits underwent axial MR imaging (FSE-T1WI、FSE-T2WI、DCE-MRI) of the multifidus muscle in lumbar region at fixed time points (0, 4, 8, 12 and 16 weeks after alloxan injection). The pharmacokinetic model of Extended Tofts Linear was used to acquire DCE-MRI quantitative permeability parameters,including Ktrans, rate constant (Kep), extravascular extracellular volume fraction (Ve) and plasma volume fraction (Vp). Sixty eight texture features including the first-order (histograms), second-order (grey-level co-occurrence matrices, GLCM) and higher order (run-length matrix,RLM) statistics textural features were extracted from the Ktrans map. Histopathologic examination of multifidus muscle included H&E staining for muscle fiber cross-sectional area (CSA) measurement and CD31 immunohistochemistry for microvessel density (MVD) and capillary-to-fiber ratio (C/F) measurement at week 16. Independent sample t test or Mann-Whitney U test was used to compare the difference of permeability and texture features parameters between diabetic and control group at the same time point,while repeated measures analysis of variance (ANOVA) was used to test for the data difference at different time points. We defined the parameters which had statistically significant differences between the two groups with an area under curve (AUC) of ROC curves higher than 0.7 as the effective texture parameters to distinguish the two groups. Data of CSA, MVD and C/F of the two groups were analyzed by Independent sample t test.Results
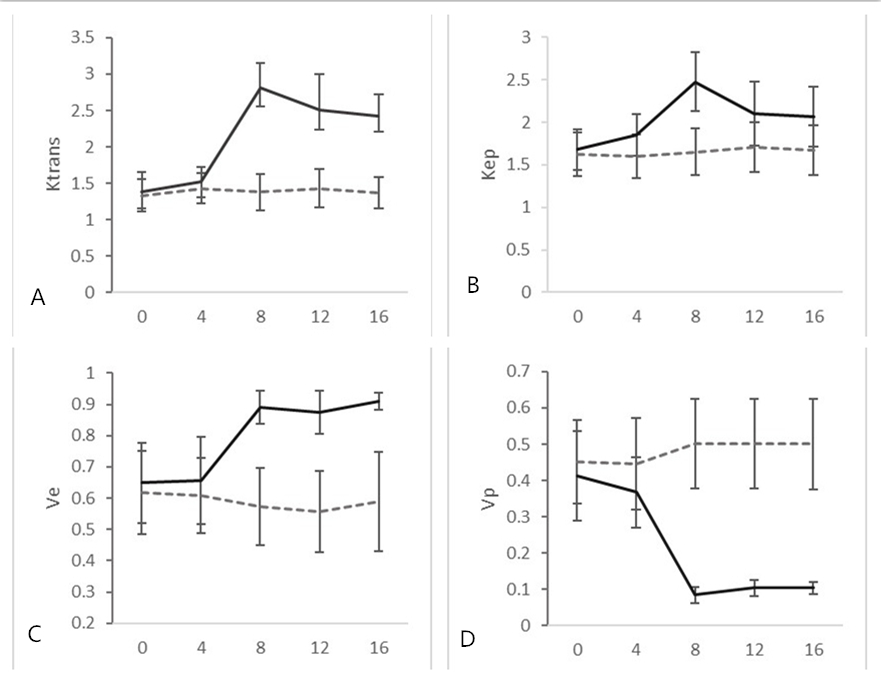
Diabetic group had statistically significant differences in Ktrans, Kep, Ve and Vp at different time point (F=33.792, 8.851, 18.482, 84.807, respectively, all P <0.001)while no statistical difference occurred in the control group (F=0.304, 0.170, 0.309, 0.734,respectively ,all P >0.05).In diabetic group, Ktrans and Kep increased at 8 weeks and then showed a downward trend, they were significantly decreased at week 16 and week 12 respectively when compared to week 8(P<0.05),but still higher than the control group(P<0.05). Ve increased and Vp decreased at 8 weeks in the diabetic group( Fig.1-3).Texture features parameters as we defined were as follows: skewness decreased in diabetic group at week 4,8,12,16, histograms parameters such as median intensity, mean value, quantile50, quantile75 , quantile90, RMS, MPP, GLCM parameter entropy and RLM parameter high grey-level run emphasis(HGRE) increased. Histopathological results showed that CSA and C/F decreased in diabetic group, while MVD had the opposite situation ( Fig.4,5).Discussion
Ktrans and Kep increase in diabetic group at week 8, indicating the increase of microvascular permeability, this could be caused by the damage of vascular endothelial cell. Other factors, such as the sparse vessels ( reduced C/F in our study ), narrowed lumen and impaired angiogenesis3, may lead to the downward trend of Ktrans and Kep since week12 and reduced Vp. Ve is affected by the reduced CSA of the skeletal muscle. All these factors and subtle changes of diabetic skeletal muscle, such as the loss of myofibrillar material and sarcomeric destruction1, could change the texture distribution pattern, which can be reflected in Ktrans map.Conclusion
There exists changes of microvascular permeability and perfusion in diabetic skeletal muscle and texture analysis based on Ktrans map can detect these subtle changes in early stage.
Acknowledgements
Dr Ma Lin (life Science,OMS Team, GE Healthcare China, Wuhan) gave constructive suggestions on the revision of this article.References
1. Monaco C, Perry C, Hawke T J. Diabetic Myopathy: current molecular understanding of this novel neuromuscular disorder. Curr Opin Neurol, 2017,30(5):545-552.
2. Coleman S K, Rebalka I A, D'Souza D M, et al. Skeletal muscle as a therapeutic target for delaying type 1 diabetic complications. World J Diabetes, 2015,6(17):1323-1336.
3. You J, Sun J, Ma T, et al. Curcumin induces therapeutic angiogenesis in a diabetic mouse hindlimb ischemia model via modulating the function of endothelial progenitor cells. Stem Cell Res Ther, 2017,8(1):182.
Figures
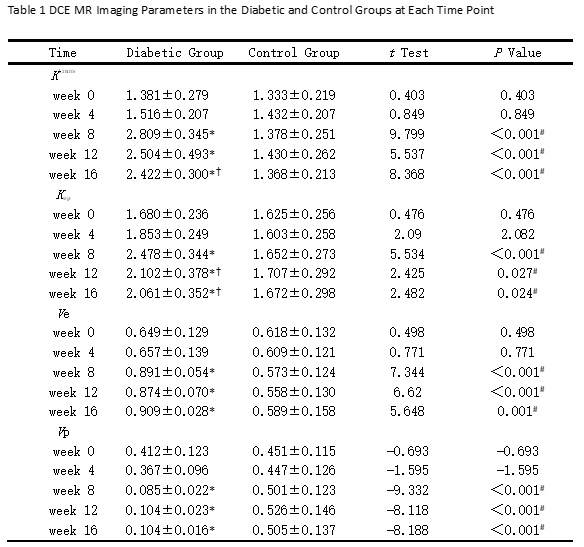
Fig.1 Note.—Data are mean ±standard deviation.
* P<.05 versus week 0 in the same group.
† P<.05 versus week 8 in the same group.
#P <.05 for the diabetic group versus the control group at the same time point.