1279
Semi-quantitative MR muscle analysis of VCP inclusion body myopathy1Department of Radiological Sciences, University of California, Irvine, Irvine, CA, United States, 2Radiology Department, St. Luke's International Hospital, Tokyo, Japan, 3Department of Orthopedics and Physiology & Biophysics, University of California, Irvine, Irvine, CA, United States, 4Division of Genetic and Genomic Medicine, Department of Pediatrics, University of California, Irvine, Irvine, CA, United States
Synopsis
This study was to demonstrate
Introduction
Inclusion body myopathy associated with Paget and dementia (IBMPFD) is a rare disease associated with mutations in the VCP gene1. The disease is characterized by adult onset proximal myopathy and muscle biopsy findings of vacuoles and inclusions that stain positive for TDP43, ubiquitin and autophagy markers2. MRI is the pivotal imaging tool to support clinical diagnosis and monitoring progression of several inherited and acquired neuromuscular disorders, revealing anatomic details and changes in signal intensity within the muscles3,4, however, very limited MRI data is available in VCP disease. T1-weighted images (T1WI) disclose chronic alterations including fatty infiltration and muscle volume decrease5. Semi-quantitative scoring systems exist for the evaluation of fatty infiltration6, MRI quantification methods have been recently applied to evaluate fatty infiltration in clinical researchs7. However, a relationship between semi-quantitative method and MRI quantification has not been fully investigated in muscle involvement of neuromuscular diseases. Therefore, the purpose of this study was to correlate semi-quantification of fatty infiltration with MRI quantification based on fat fraction analysis and to characterize specific patterns of chronic myopathy in VCP IBM with semi-quantitative methods.Methods
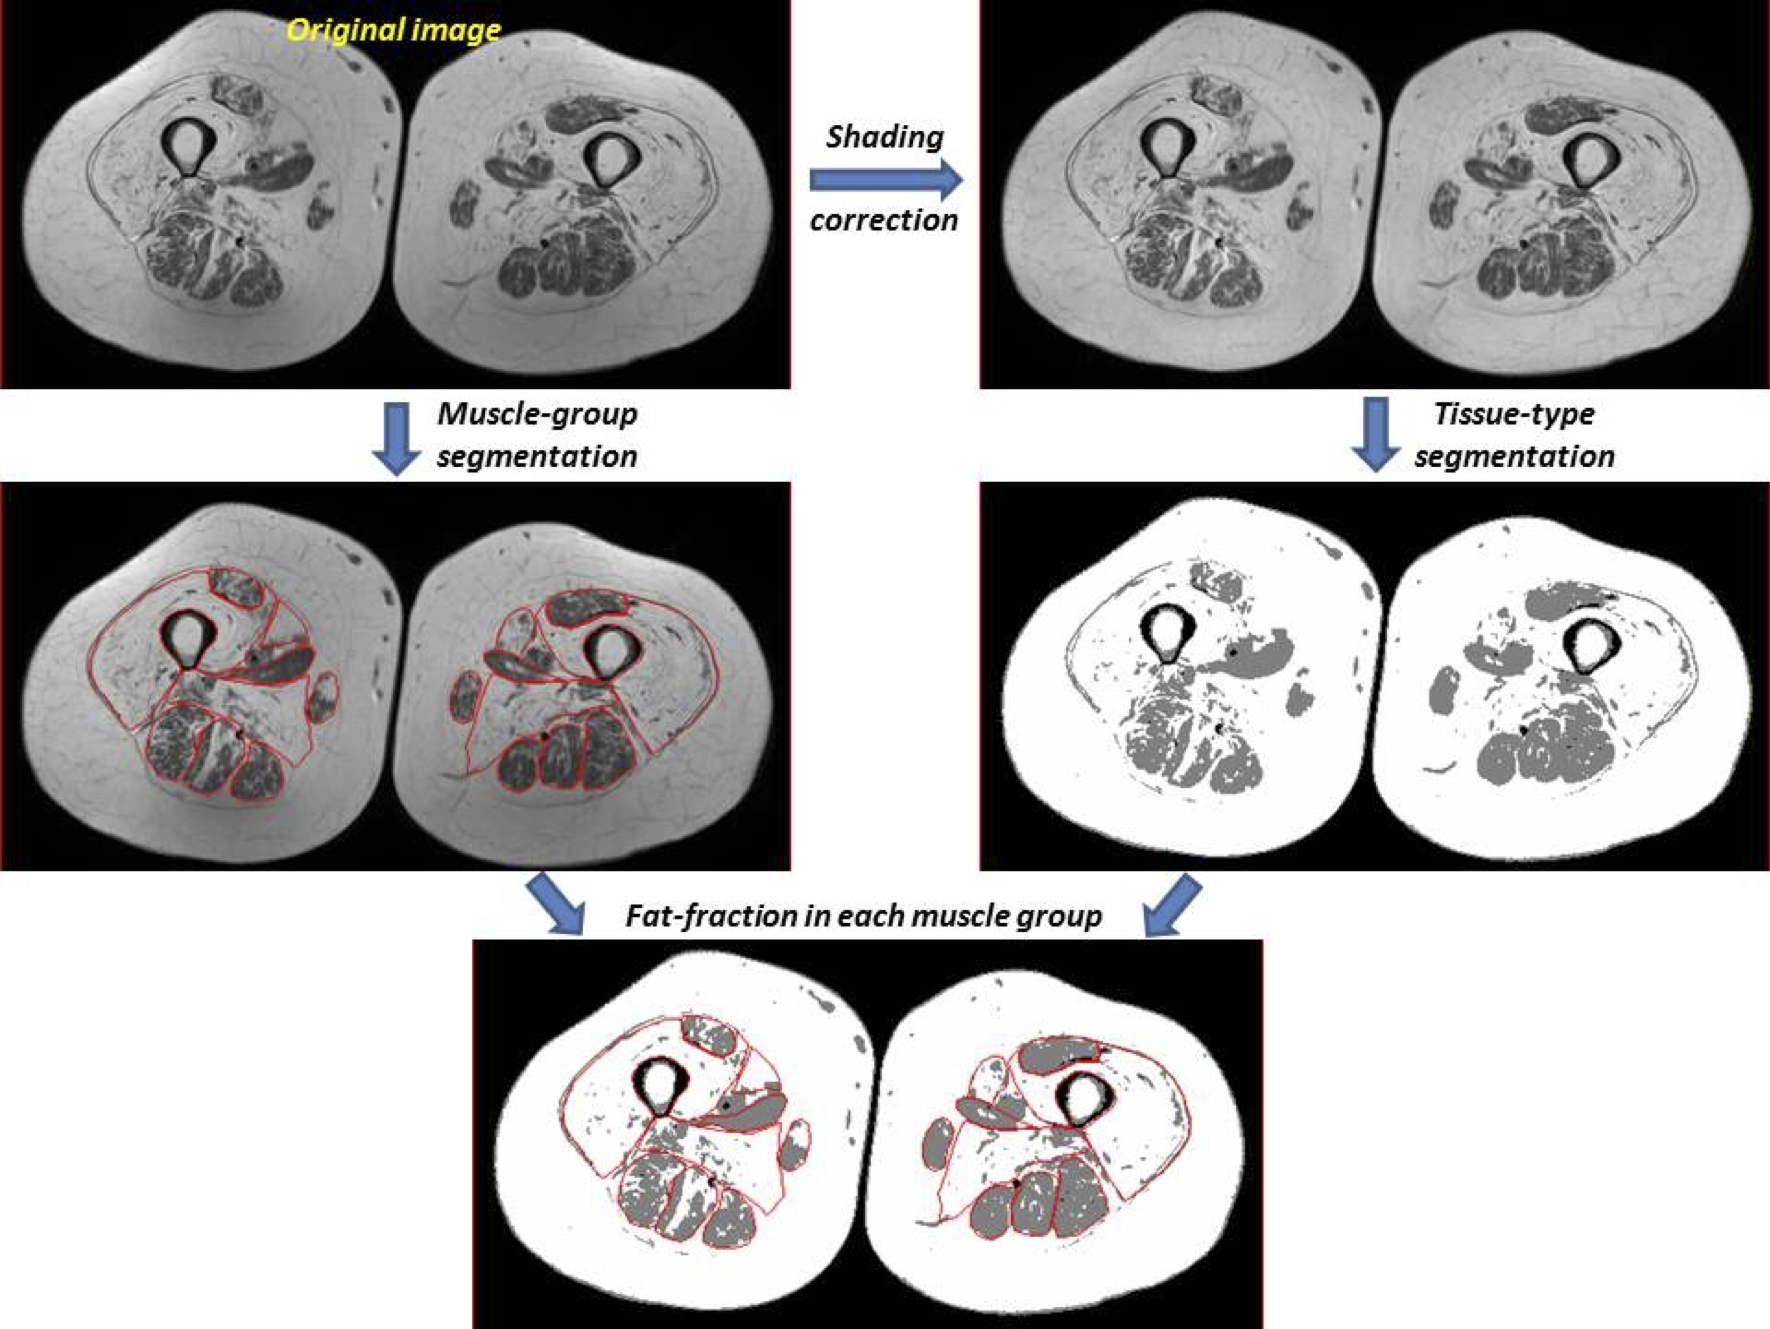
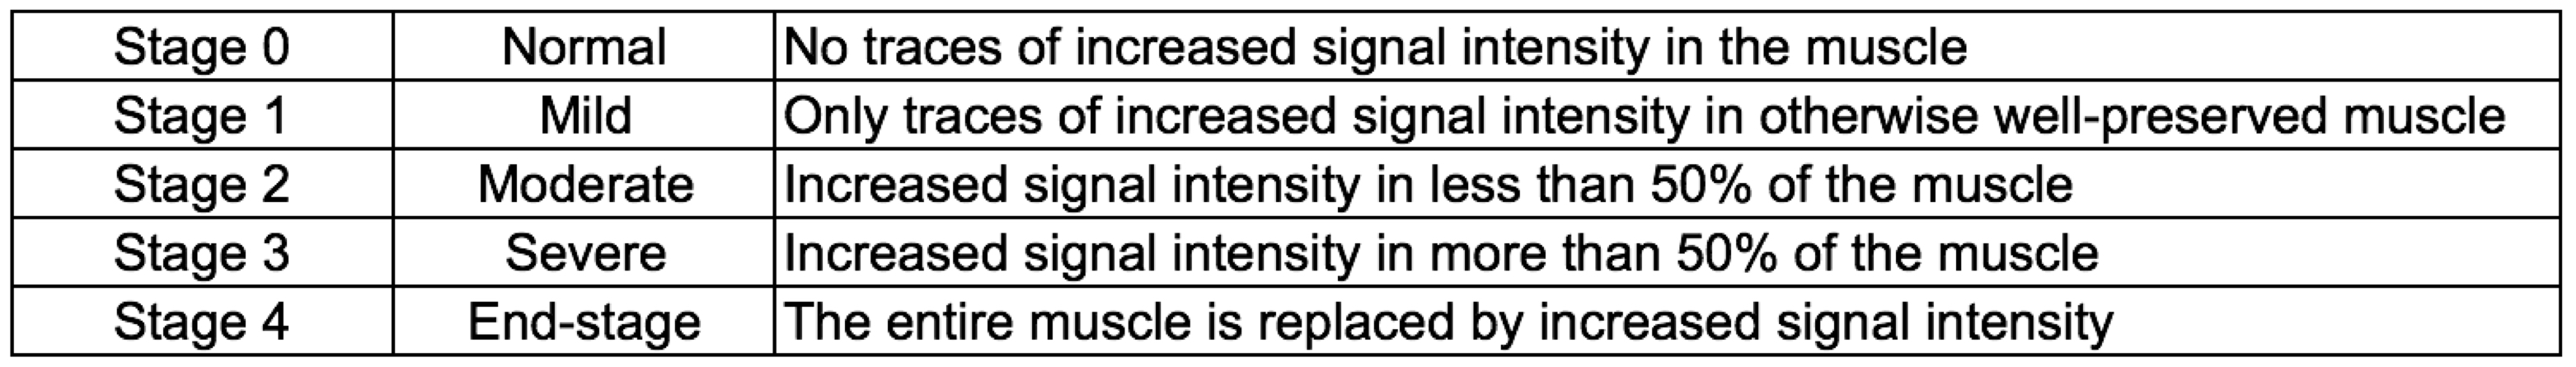
The study protocol was approved by the Institutional Review Board, and all subjects gave written informed consent. We prospectively evaluated 12 patients with varying degrees of myopathy (7 women and 5 men; mean age, 50.3 years; range, 28-64) and 8 healthy volunteers (5 women and 8 men; mean age, 43.1 years; range, 27-65). All MR studies were performed on a 3T scanner (Achieva, Philips Healthcare, Netherlands) using a body coil. Axial images of the thighs were acquired including T1WI. The acquisition parameters were as follows: 2D turbo spin-echo; repetition time (TR)/echo time (TE) = 886/15ms, number of excitation (NEX) = 1, and total acquisition time = 5 minutes, field of view (FOV) = 380mm, slice thickness/gap = 5/5mm, image matrix = 512×512, and number of slices = 20-25. The thigh muscles were assessed for fatty infiltration in the middle section,where following muscles were all visible: the rectus femoris, quadriceps except for rectus femoris, sartorius, gracilis, semimembranosus, semitendinosus, biceps femoris, adductor longus, and adductor magnus.For the semi-quantitative assessment, the degree of fatty infiltration was graded by a radiologist according to 5-point scale6(Table 1). The presence or absence of muscle volume decrease was graded on a/b sub-scale: a, with presence of muscle volume decrease; and b, with absence of muscle volume decrease. For the MRI quantification, T1W images were first corrected for shading or intensity inhomogeneity across the FOV based on N3 algorithm and then segmented for different tissue types based on a 3-class fuzzy c-means (FCM) algorithm using MIPAV software (http://mipav.cit.nih.gov). Also, manual muscle segmentation of the bilateral thigh muscles was performed by a radiologist using MIPAV software. Then, the fat fraction value in each muscle was calculated7(Fig.1). The Pearson correlation coefficient was used to correlate between fat fraction value and semi-quantitative scale. Kruskal-Wallis rank sum test and the Steel-Dwass post-hoc test were used to compare the relationship between fat fraction value and the semi-quantitative scale.Results
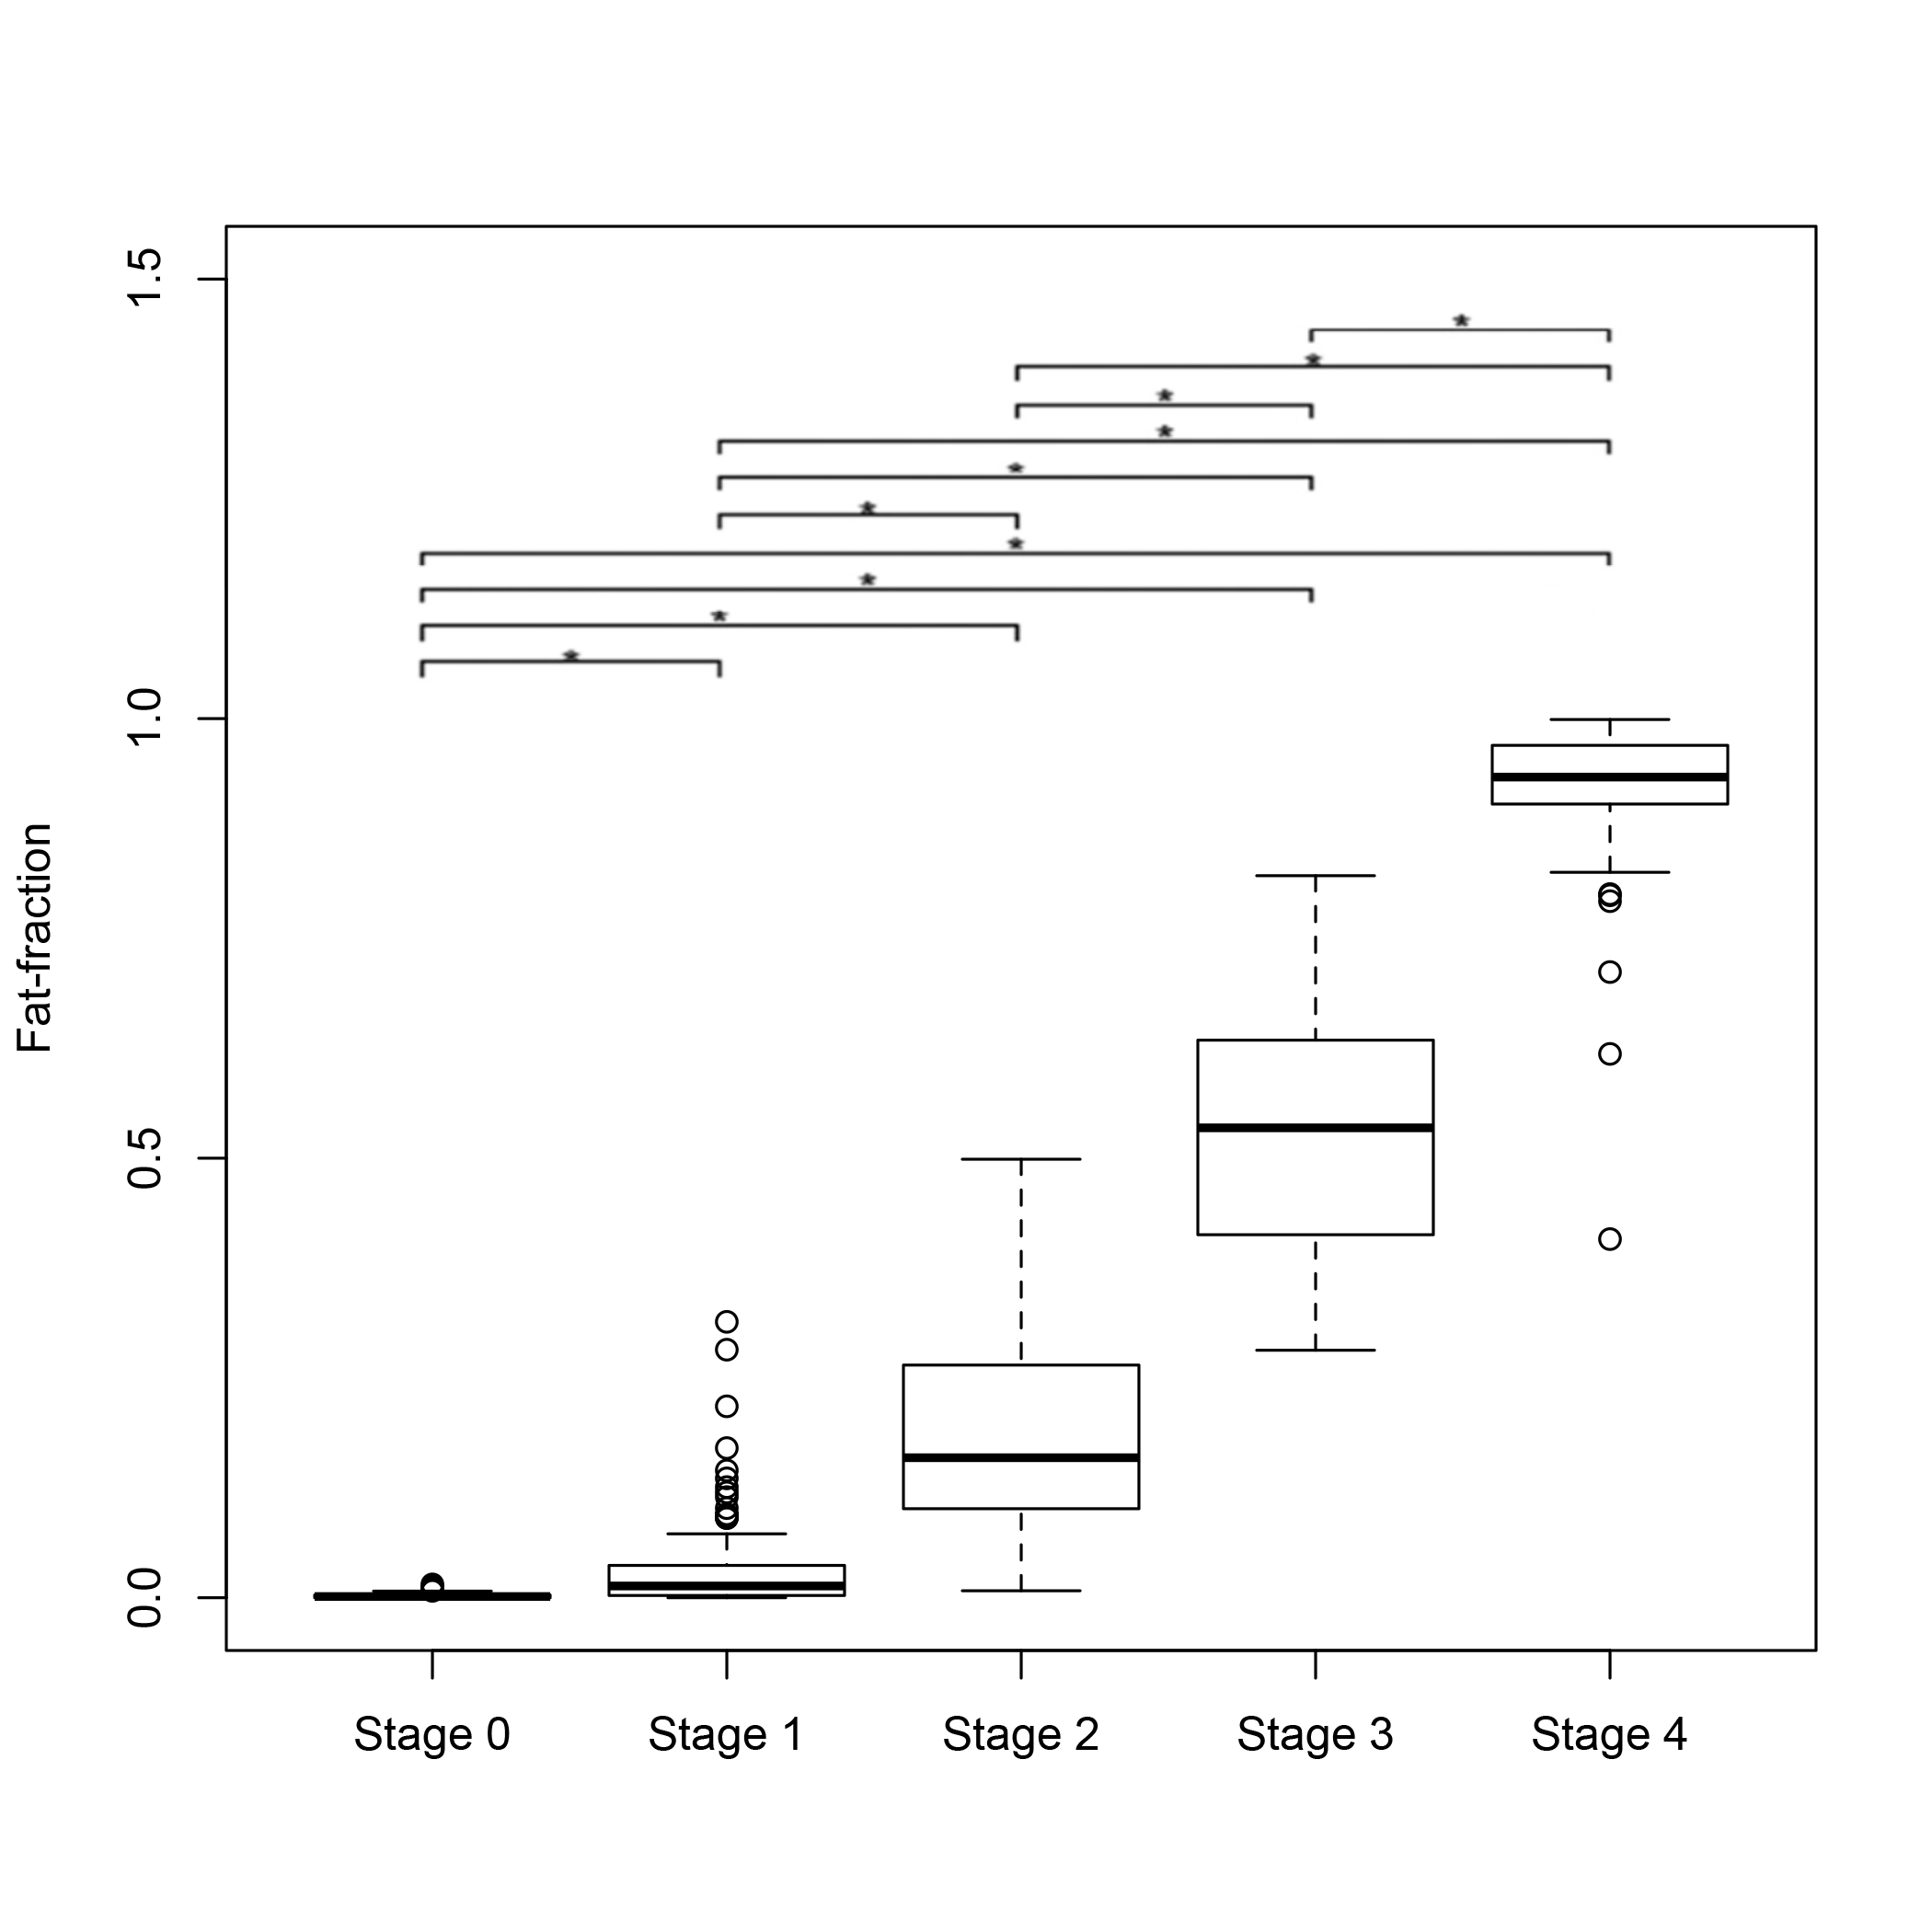
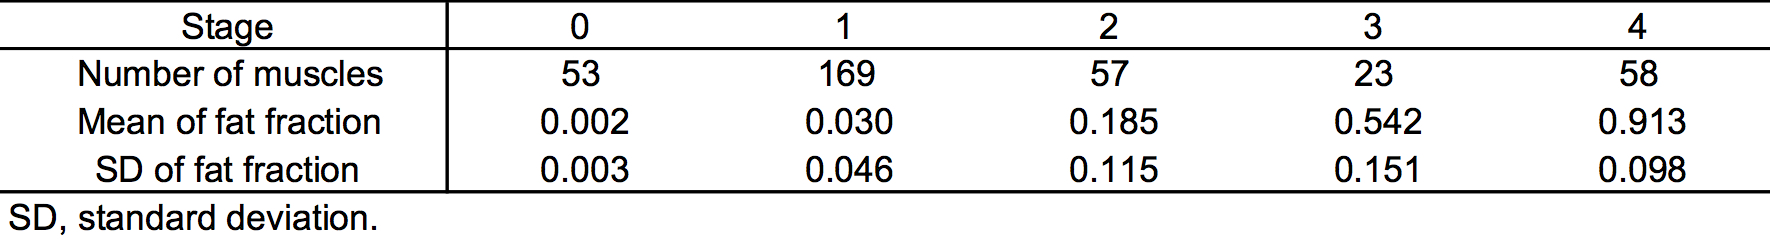
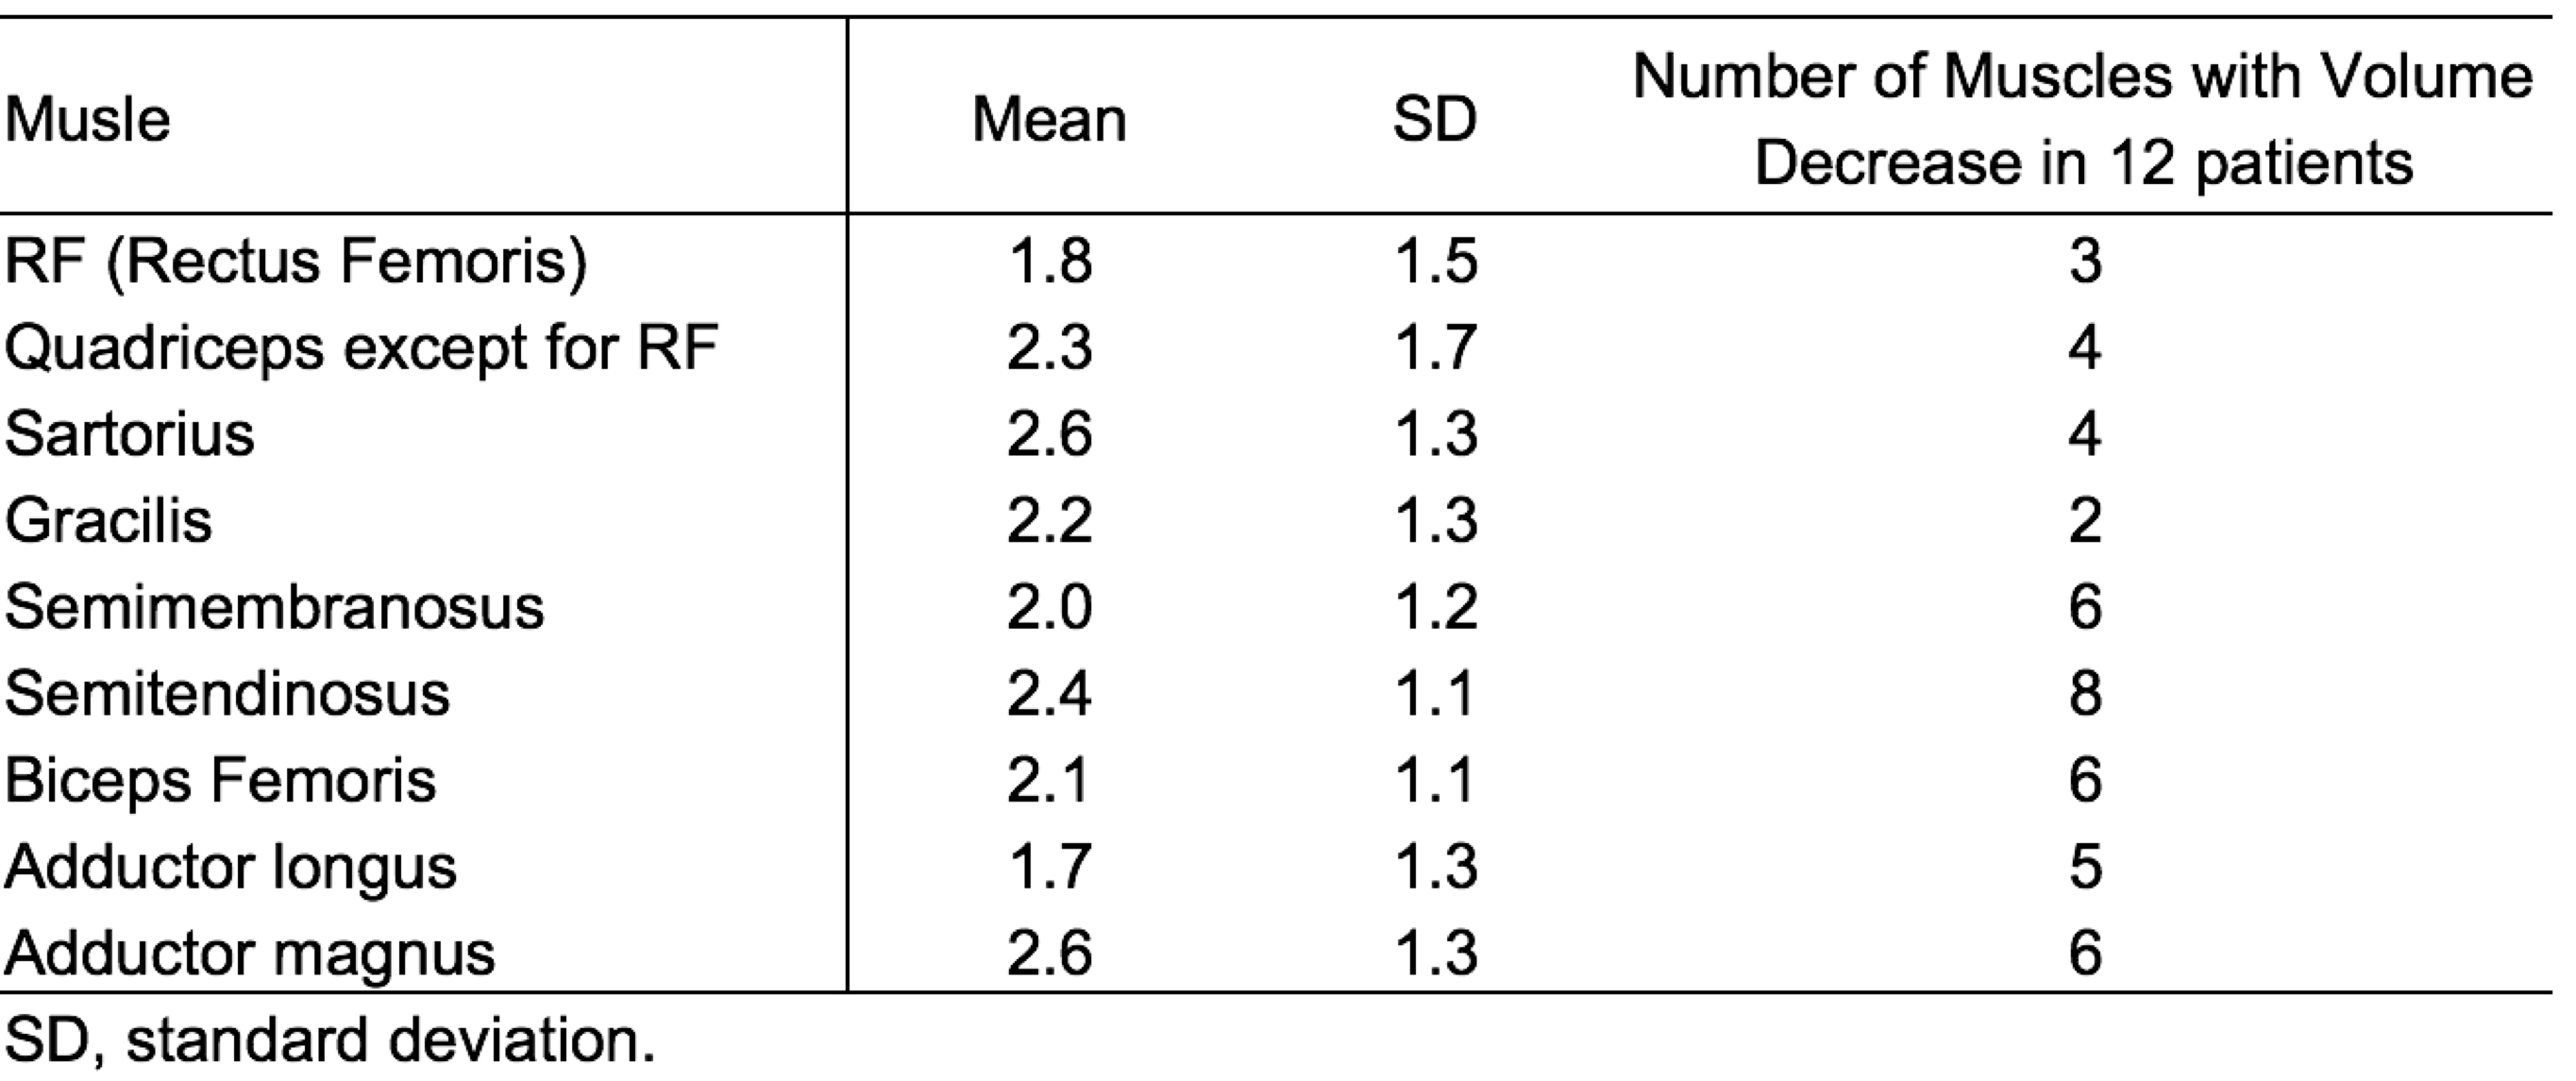
Table 2 shows the results of ratings based on 5-point semi-quantitative scale with mean and standard deviation of fat fraction values. The Pearson correlation coefficient between fat fraction value and semi-quantitative scale for all muscles was 0.928 (p < 0.001). Figure 2 shows the box plot of fat fraction values stratified by 5-point semi-quantitative scale. Fat fraction values showed a stepwise increase in higher point semi-quantitative scales (p < 0.001 for all). Table 3 shows mean scores for semi-quantitative analysis of fatty infiltration and number of muscles with volume decrease in 12 patients with IBM. The sartorius and adductor magnus were most affected by fatty infiltration, while the adductor longus and rectus femoris were relatively well-preserved. The semitendinosus was most subject to decrease in muscle volume, that was frequently seen in the hamstring muscles (semimembranosus, semitendinosus, biceps femoris) and the adductor muscles (adductor longus, adductor magnus).Conclusion
We demonstrated that 5-point semi-quantitative scale can provide equivalent accuracy as the quantification of fatty infiltration, and semi-quantitative scale with sub-scale of presence or absence of muscle volume decrease was feasible for characterization of specific patterns of chronic muscle alterations in IBM patients. This method can widely and easily available in clinical settings and assist noninvasive initial and follow up diagnosis of IBM.Acknowledgements
National Institute of Health: grant AR050236 (V.K.) and the UC Irvine ICTS (Institute ofClinical Translational Science).References
- Watts GD, Wymer J, Kovach MJ, et al. Inclusion body myopathy associated with Paget disease of bone and frontotemporal dementia is caused by mutant valosin-containing protein. Nat Genet. 2004;36:377-381.
- Al-Obeidi E, Al-Tahan S, Surampalli A, et al. Genotype-phenotype study in patients with VCP valosin-containing protein mutations associated with multisystem proteinopathy, Clin Genet. 2017 Jul 10.
- Mercuri E, Pichiecchio A, Allsop J, et al. Muscle MRI in inherited neuromuscular disorders: past, present, and future. J Magn Reson Imaging. 2007;25(2):433-440.4.
- Marcuzzo S, Zucca I, Mastropietro A, et al. Hind limb muscle atrophy precedes cerebral neuronal degeneration in G93A-SOD1 mouse model of amyotrophic lateral sclerosis: a longitudinal MRI study. Exp Neurol. 2011;231(1):30-37.5.
- Murphy WA, Totty WG, Carroll JE. MRI of normal and pathological skeletal muscle. AJR Am J Roentgenol. 1986;146:565–574.6.
- Fischer D, Kley RA, Strach K, et al. Distinct muscle imaging patterns in myofibrillar myopathies. Neurology. 2008;71(10):758-765.7.
- Lin M, Chan S, Chen JH, et al. A new bias field correction method combining N3 and FCM for improved segmentation of breast density on MRI. Med Phys. 2011 Jan;38(1):5-14.
Figures