1278
Gender- and age-related changes in trunk muscle composition using chemical shift encoding-based water-fat MRI1Department of Diagnostic and Interventional Neuroradiology, Klinikum rechts der Isar, Munich, Germany, 2Department of Diagnostic and Interventional Radiology, Klinikum rechts der Isar, Munich, Germany, 3Institute of Nutritional Medicine, Klinikum rechts der Isar, Munich, Germany
Synopsis
Chemical shift encoding-based water-fat MRI derived proton density fat fraction (PDFF) of muscles has been emerging as a surrogate marker for quantification of ectopic fat accumulation. Increased fatty deposits are a risk factor for metabolic and cardiovascular diseases. With skeletal muscle being the largest body compartment in adults, we are still at the beginning of understanding the functional consequences of these changes. The purpose of the present analysis was to investigate the gender- and age-related changes in PDFF of trunk musculature of healthy adults using chemical shift encoding-based water-fat MRI.
Purpose
Ageing, sarcopenia, and malnutrition are associated with quantitative and qualitative changes of body composition [1,2]. There are several imaging modalities including magnetic resonance imaging (MRI) for the assessment of trunk muscle tissue composition [3]. In this analysis, we investigated the gender- and age-related changes in trunk muscle composition using chemical shift encoding-based water-fat MRI.Methods
Subjects:
79 subjects (26 men: 38.85 ± 10.38 years; 53 women: 39.51 ± 15.03 years) were included in the analysis. Subjects who appeared healthy according to self-report, showed no history of severe diseases or surgery within the last three months and did not have acute physical impairment were eligible. Pregnant and breast-feeding women as well as subjects with standard contraindications for MRI examinations were excluded.
MRI:
All subjects underwent 3T MRI (Ingenia, Philips Healthcare). An axial six-echo multi-echo 3D spoiled gradient-echo sequence was used for chemical shift-encoding based water‑fat separation at the abdomen using the anterior and posterior coil arrays. The sequence acquired the six echoes in a single TR using non-flyback (bipolar) read-out gradients and covered the entire abdomen in two axial stacks (starting from the top of the liver and covering a feet/head distance of 300 mm) with the following imaging parameters per stack: TR/TE1/ΔTE = 7.8/1.35/1.1 ms, FOV = 300×400×150 mm3, fold-over suppression in both L/R directions with 50 mm, acquisition matrix size = 152×133, acquisition voxel size = 2×3×6 mm³, SENSE with reduction factor = 2.2x1.2, receiver bandwidth = 1678 Hz/pixel, frequency direction = A/P (to minimize breathing artifacts), 1 average, acquired in a 15 s breath-hold. A flip angle of 3° was used to minimize T1-bias effects.
Imaging-Based Fat Quantification:
The gradient echo imaging data were processed on-line using the fat quantification routine of the vendor. The routine performs first a phase error correction and then a complex-based water-fat decomposition using a pre-calibrated seven-peak fat spectrum and a single T2* to model the signal variation with echo time. PDFF maps were then computed as the ratio of the fat signal over the sum of fat and water signals.
Manual Segmentation and PDFF calculation:
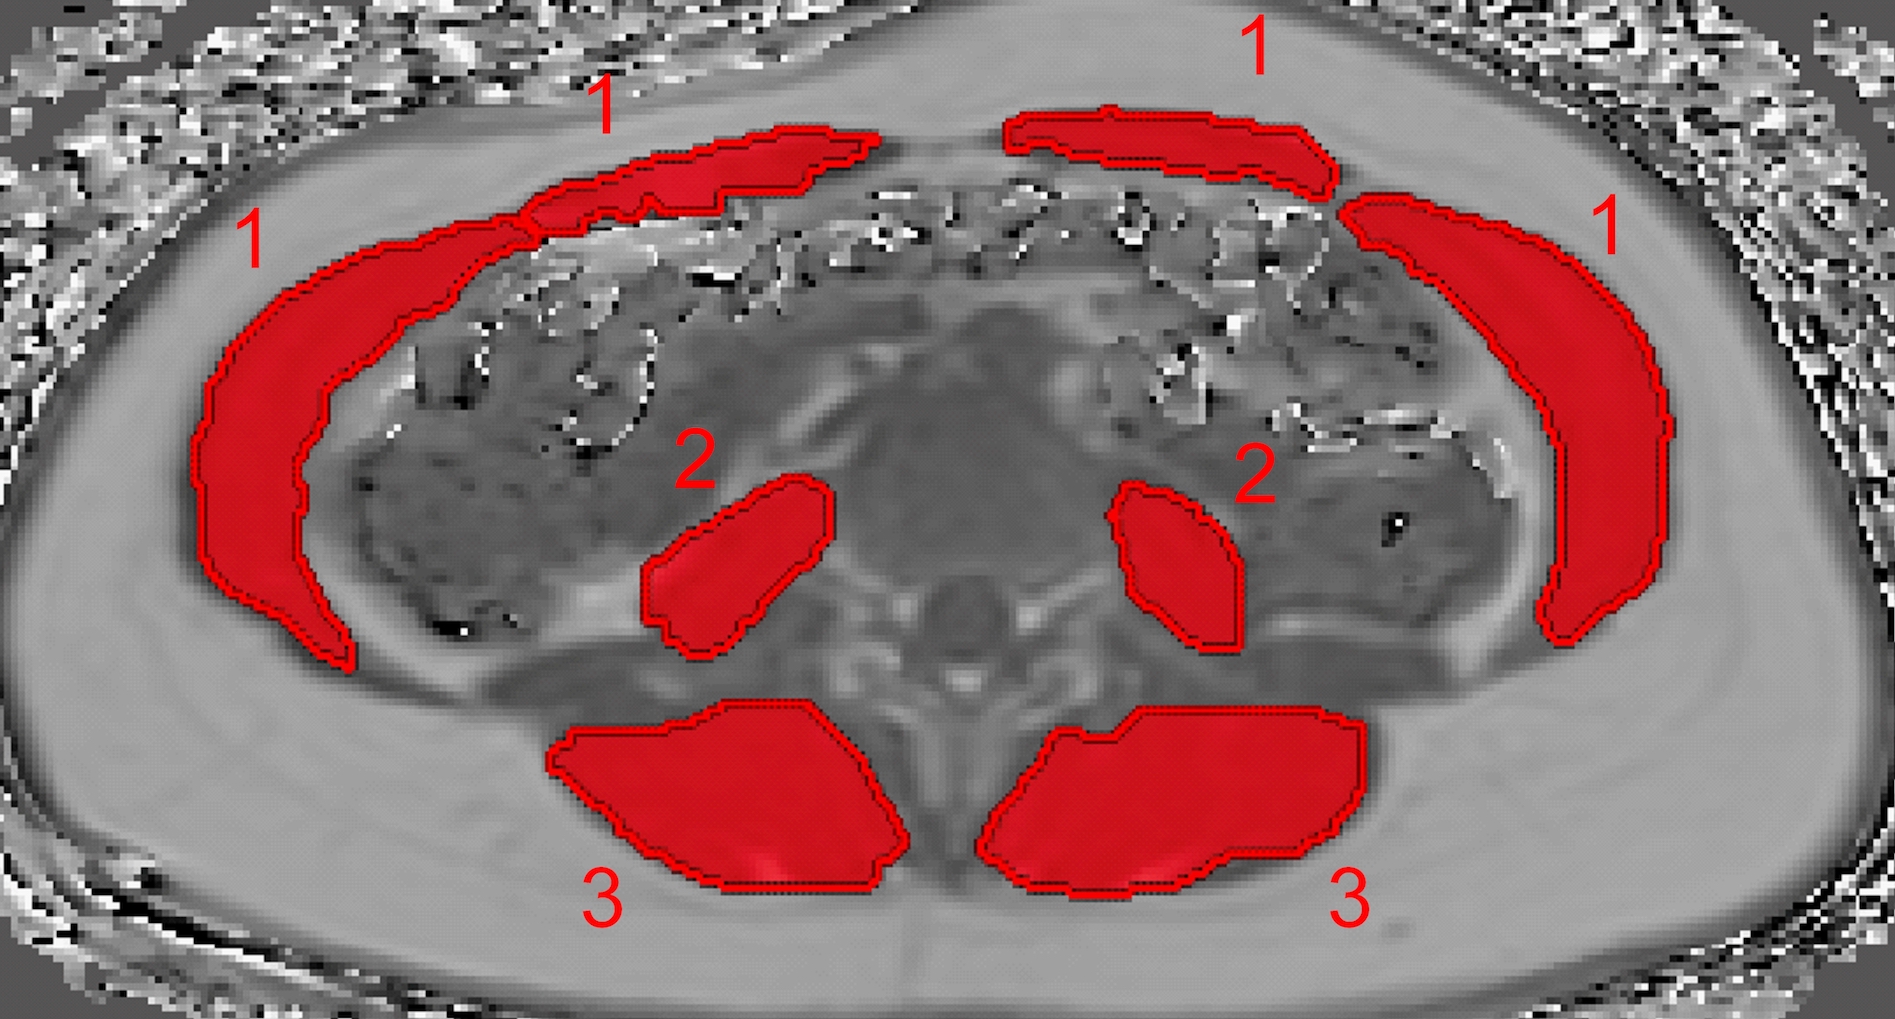
The
abdominal muscles, the psoas muscle and the erector spinae were included in the
analysis and manually segmented in the PDFF maps by a radiologist in a single
slice at midvertebral L4 level (Figure 1) bilaterally. Segmentation was performed by
using the free open-source software Medical Imaging Interaction Toolkit (MITK,
www.mitk.org). PDFF and CSA (cross-sectional area) values of each ROI were
recorded and the average value of both sides was calculated.
Results
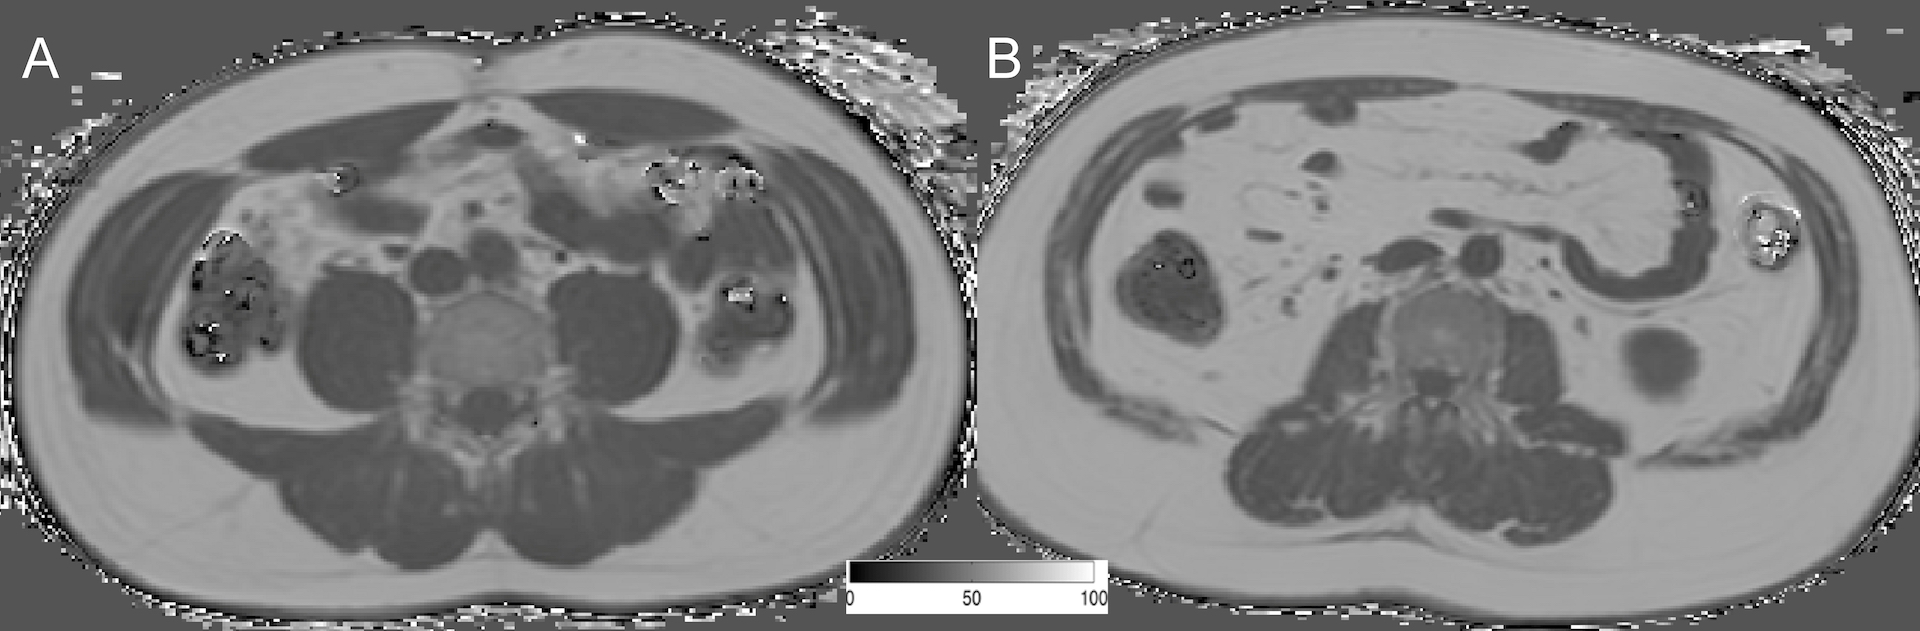
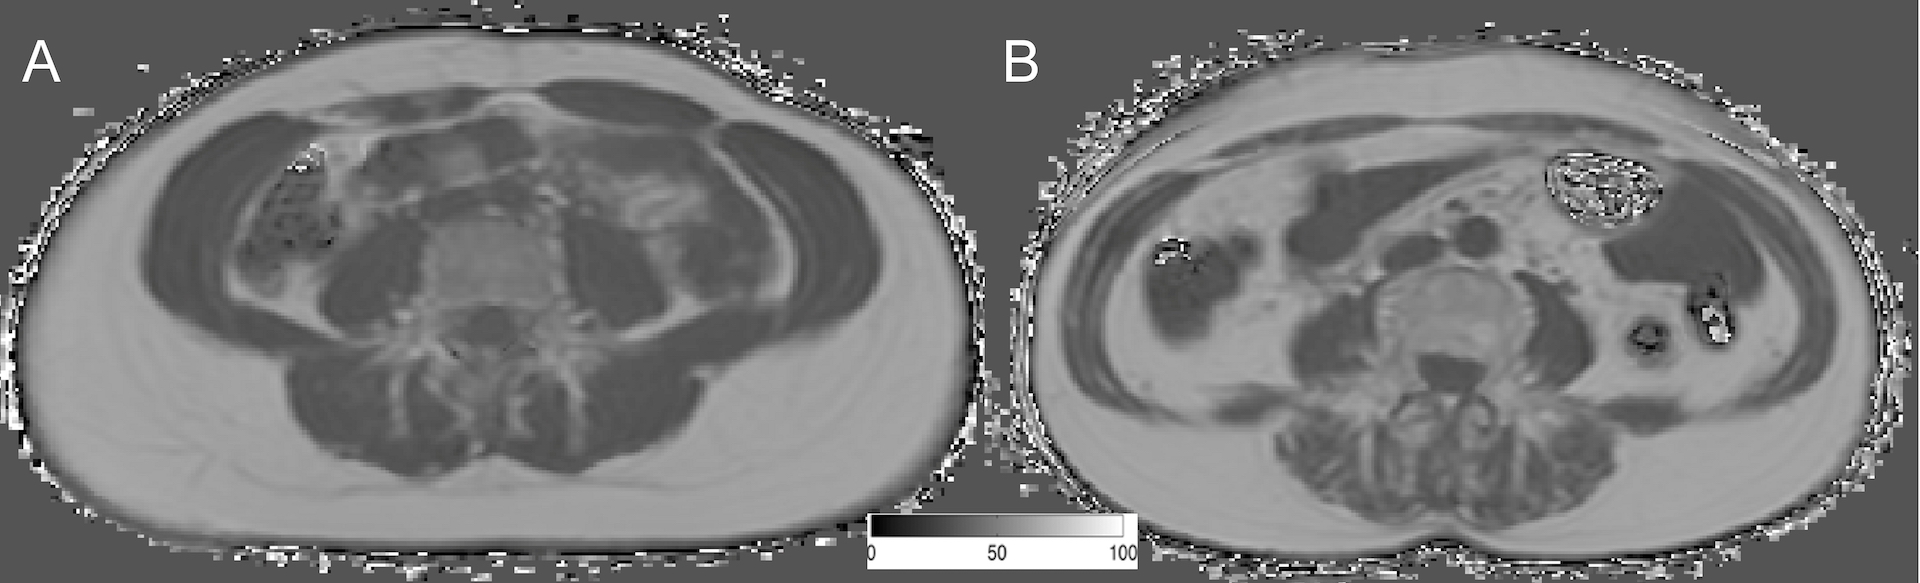
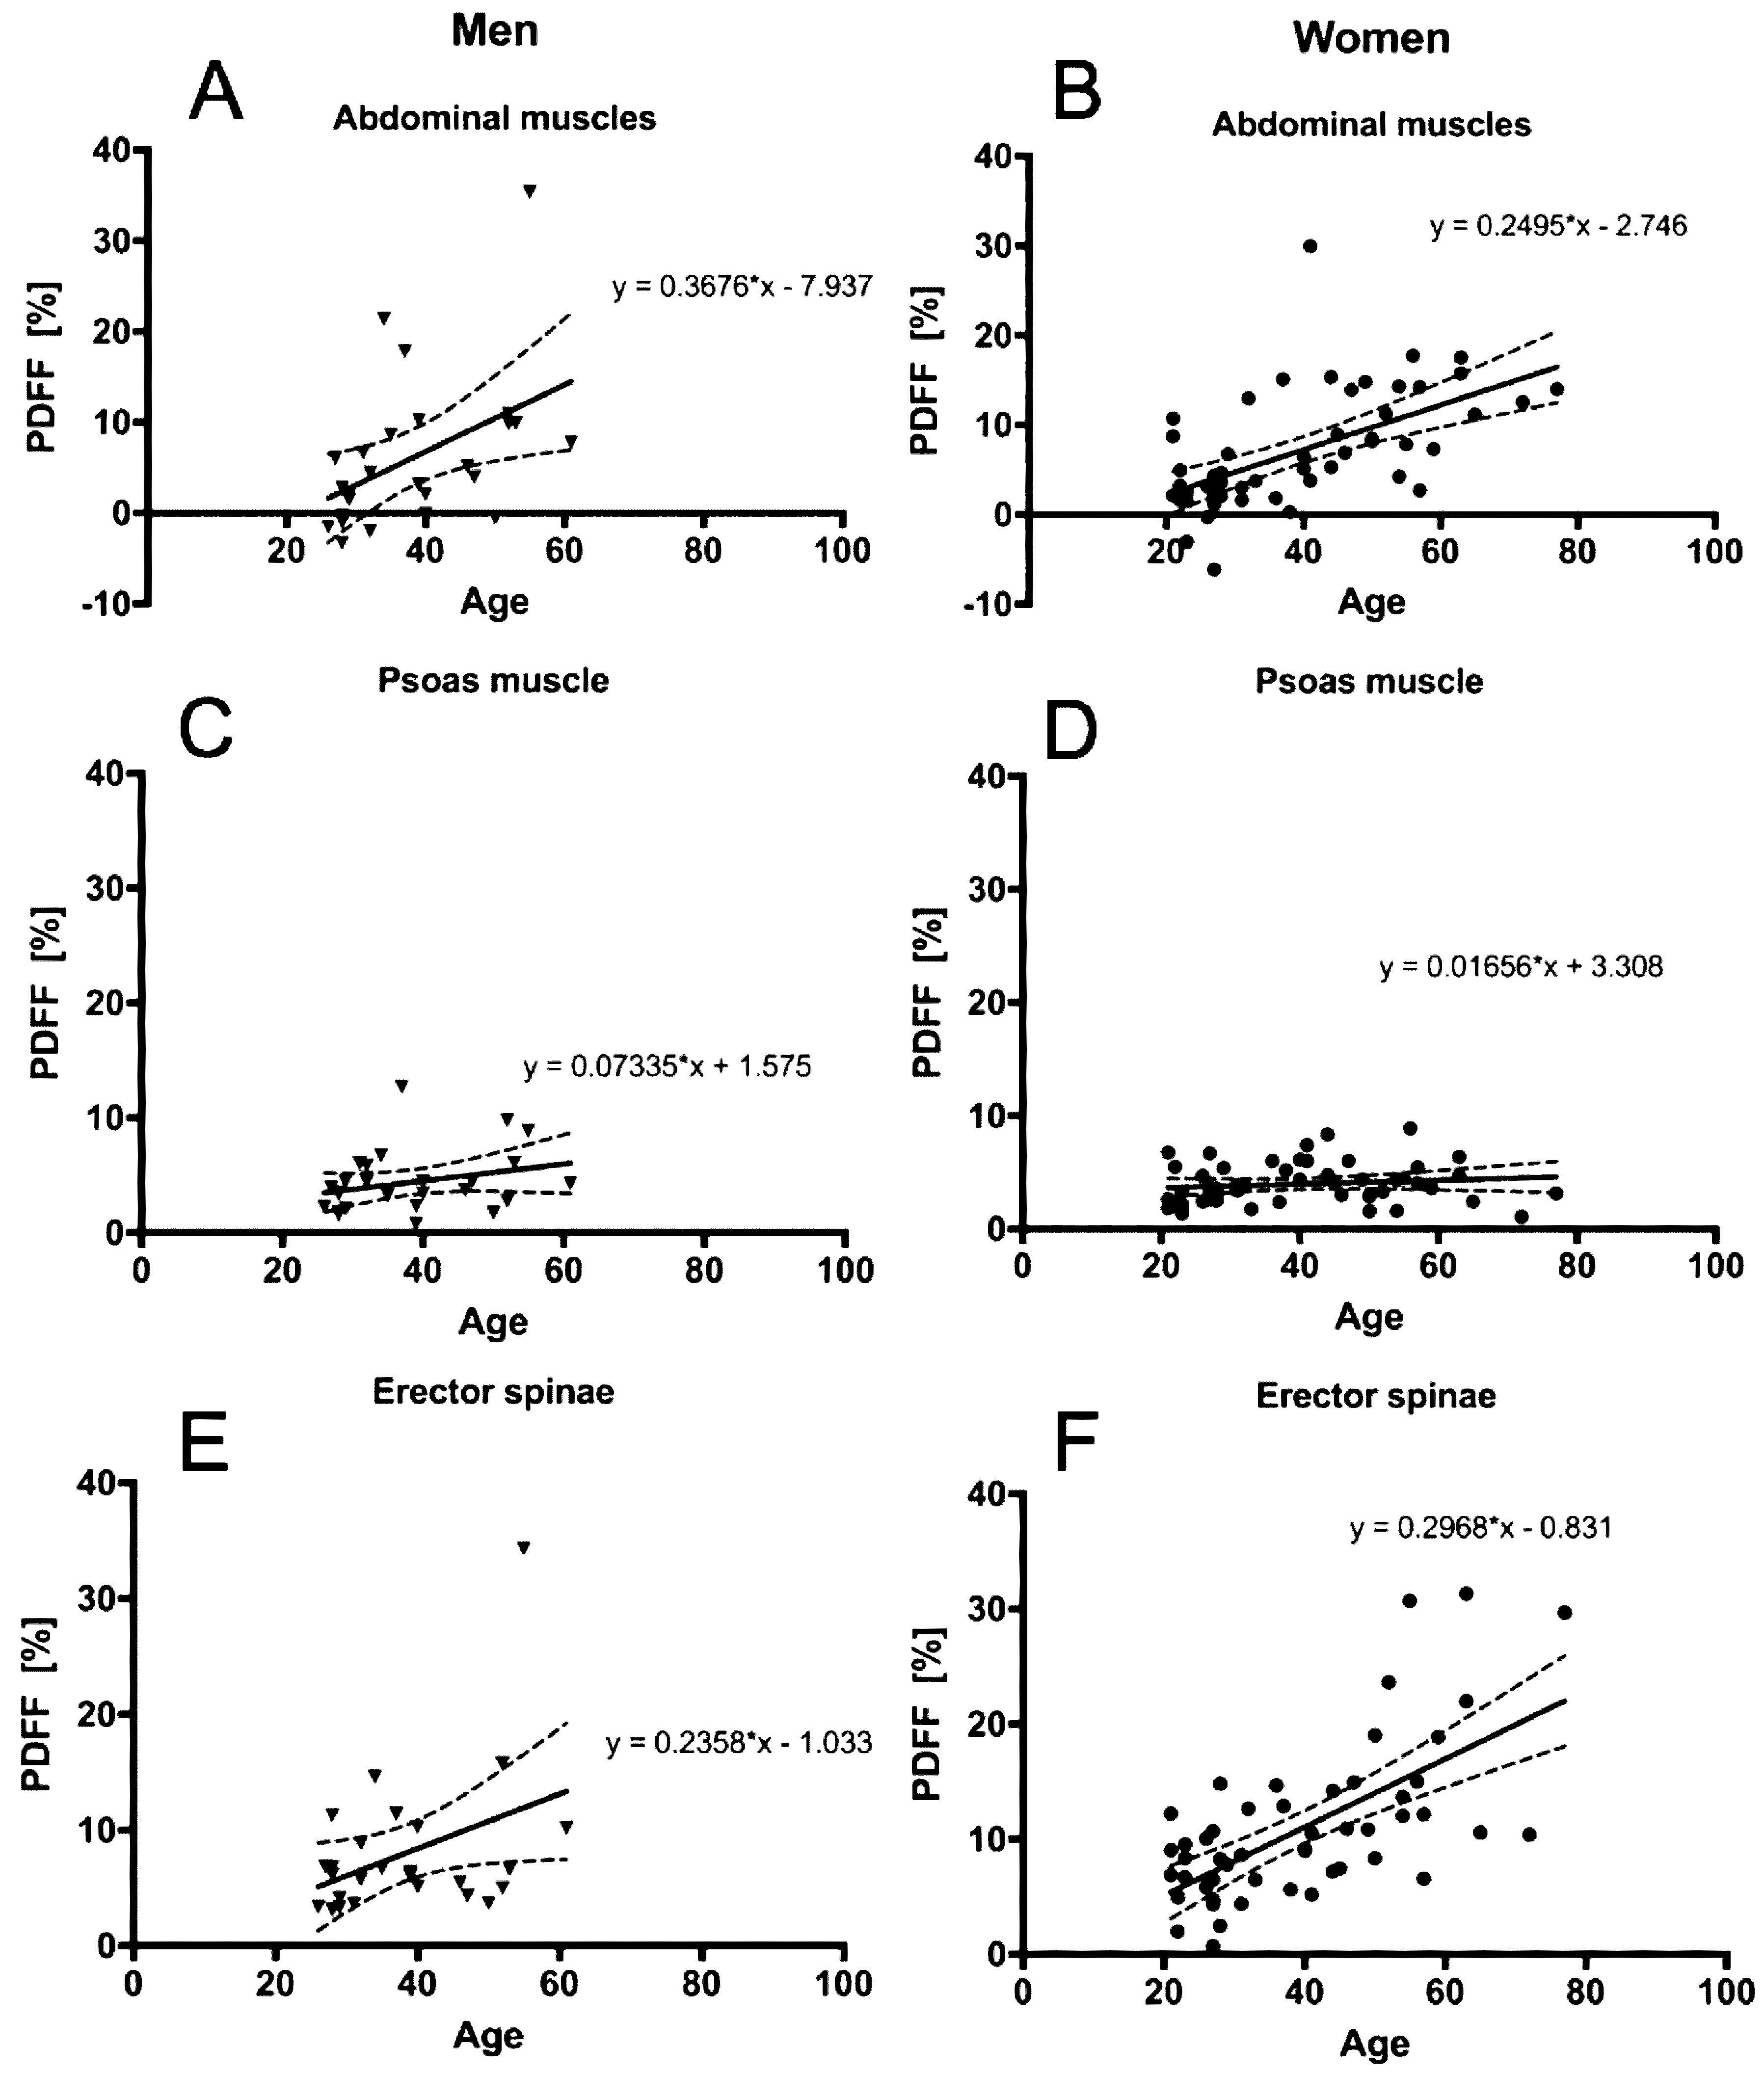
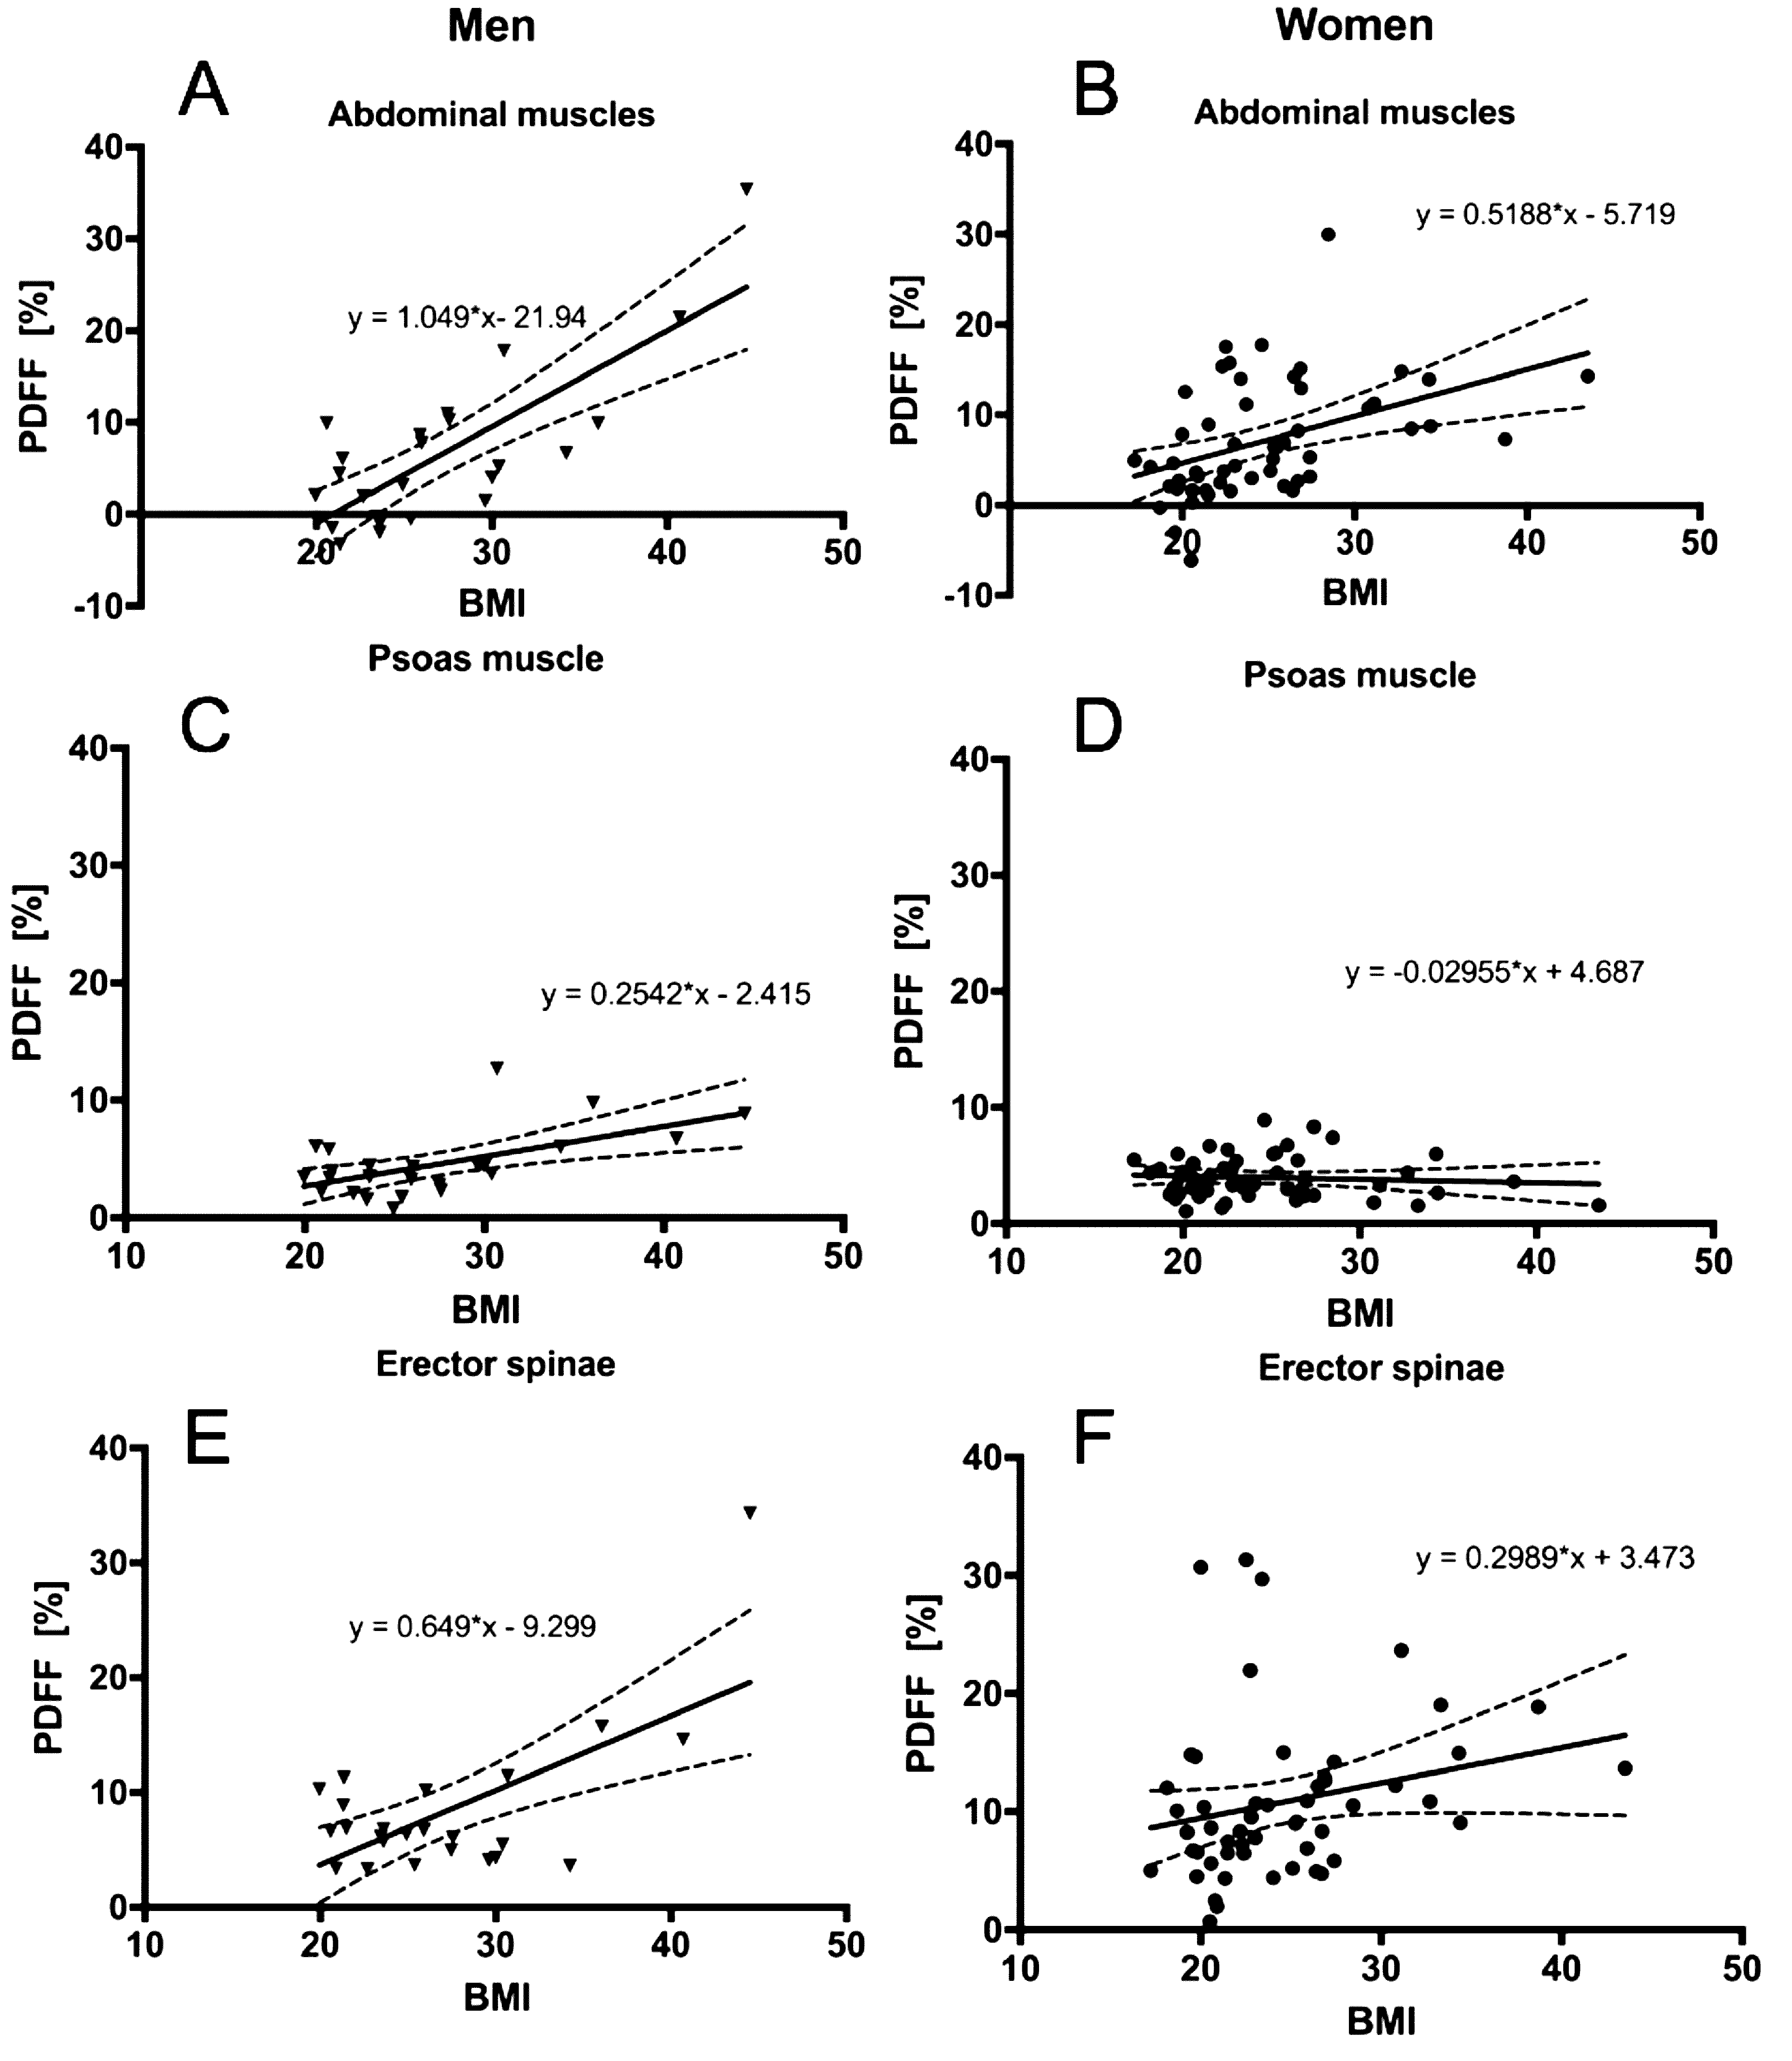
The average PDFF of the erector spinae muscle was 7.99 ± 6.36% (range: 3.32–34.29%) in men and 14.87 ± 6.74% (range: 0.71–31.34%) in women (p = 0.011). No significant differences between men and women regarding PDFF could be detected in the psoas muscle (p = 0.650) and the abdominal muscles (p = 0.262). However, all muscular compartments showed significant differences in CSA (p < 0.0001) (Table 1). Representative PDFF maps of the abdominal muscles, the psoas muscle and the erector spinae muscles from men and women are shown in Figure 2 and Figure 3. A positive correlation between BMI (r = 0.510, p = 0.022) and age (r = 0.638, p < 0.0001) with the abdominal muscle PDFF could be detected in men (Table 2). However, partial correlation did not result in a significant correlation with age (r = 0.362, p = 0.128) after adjusting for BMI. In women, BMI (r = 0.512, p < 0.0001) and age (r = 0.709, p < 0.0001) correlated significantly with the abdominal muscle PDFF. In addition, correlations between BMI (r = 0.340, p = 0.018) and age (r = 0.674, p < 0.0001) with erector spinae muscle PDFF could be detected (Table 3). When performing partial correlation testing with BMI as a control variable, statistical significance was preserved for age versus abdominal muscle PDFF (r = 0.631, p < 0.0001). PDFF of the different muscle compartments are plotted against age and BMI in Figure 4 and 5.Discussion & Conclusion
In conclusion, the results of the present analysis suggest an age-driven abdominal muscle fat accumulation in women, measured quantitatively with PDFF based on chemical shift encoding-based water-fat MRI. In contrast, in men BMI seems to have a bigger impact on muscular fat deposition. PDFF may serve as a new quantitative imaging biomarker of ectopic fat in muscle, but larger studies with more intensive metabolic phenotyping are needed.Acknowledgements
The present work was supported by the European Research Council (grant agreement No 677661 - ProFatMRI and No 637164 - iBack), the German Research Foundation (DFG-SFB824/A9), Philips Healthcare and the Else Kroener-Fresenius-Foundation, Bad Homburg, Germany and the Helmholtz cross-program topic “Metabolic Dysfunction”.References
[1] Batsis, J.A. et al. Sarcopenic obesity in older adults: aetiology, epidemiology and treatment strategies. Nat Rev Endocrinol, 2018. 14(9): 513-537.
[2] S.B. Heymsfield, et al. Skeletal muscle mass and quality: evolution of modern measurement concepts in the context of sarcopenia. Proc Nutr Soc 2015. 74: 355-66.
[3] Karampinos et al. T1-corrected fat quantification using chemical shift-based water/fat separation: application to skeletal muscle. Magn Reson Med 2011; 66:1312.
Figures