1277
Bidirectional Filtering for Psoas Major Muscle Magnetic Resonance Elastography1Radiological Sciences, Tokyo Metropolitan University, Tokyo, Japan
Synopsis
The purpose of this present work was to apply bidirectional
INTRODUCTION
Magnetic Resonance Elastography (MRE)1 can directly visualize and measure shear wave propagation that can be mapped into shear modulus map subjected to harmonic mechanical excitation. Various wave inversion algorithms have been proposed to perform such calculations. While performing such wave inversions, the complex wave interferences due to reflection and refraction create difficulties in calculations as they interact with tissue displacement, hence results into areas of low SNR. They need to be removed for clear visualization of wave chroma and to obtain improved quality of inversion reconstruction maps. Manduca et al2 proposed a directional spatio-temporal image filtering for improved inversion of MR elastograms. We propose a bidirectional filtering combined with gaussian bandpass filter (GBF) as a pre-processing step for psoas major MRE (PMMRE). A directional filter could decompose the wave field into separate components, so that the interfering waves can be processed separately. PMMRE is an emerging technique that needs robust wave image processing techniques. It is observed that the rigidity of PM muscle could be a strong sign of low back pain due to the compression of lumbar intervertebral discs3. Numano et al4 proposed that PMMRE could prove to be a new bioimaging marker for investigating non-specific back pain.METHODS
All MRE experiments were carried out on a clinical MR scanner (Achieva 3.0 T; Philips Healthcare, Best, The Netherlands). A self-designed waveform generation system (LabView, USB-6221; National Instruments, TX, USA) was used to generate the vibration waveform. A power amplifier (XTi 1000; Crown, IN, USA) and a pneumatic pressure generator (Subwoofer TIT320C-4”; Dayton Audio, OH, USA) units were used to supply vibrations to a vibration pad. The vibration pad was designed using a 3D printer that adjusts the lower back region.
The multi-echo gradient-echo type MRE pulse sequence was applied5. The parameters of the sequence were TR: 40 ms, 1st TE: 2.2 ms, 2nd TE: 12.2 ms, Flip Angle: 20°, Image Matrix: 512 x 512, Vibration Phase Offset: 4, MEG-like effect (RO) direction: AP and total acquisition time: 82 s. PM muscle MRE experiments were performed at 50 Hz with breath-holding manoeuvre during each MRE acquisition. The axial imaging plane was selected at the IVD level of L3-L4. Vibration must be adequate to reach to PM muscle. Torso phased-array coil was used for the volunteer studies.
Phase unwrapping was performed by using Laplacian-Based Estimate (LBE)6 before image filtering. A bidirectional filter was designed that could select waves propagating in specified bi-directions in PM muscle. This filter was applied as a pre-processing step in addition to spatial frequency Gaussian bandpass (GBP) filter in MREWave7. The preferential direction was from the lumbar vertebral column in the right direction for right PM muscle and to the left direction for left PM muscle. For simplicity, Local Frequency Estimate (LFE) wave inversion method is selected, developed by Knutsson8. LFE combines local estimates of instantaneous frequency over several scales with the assumption of zero attenuation. All the elastograms were created by using LFE from MREWave. For reference, we took MRE datasets coming with MREWave. The resultant wave images, amplitude maps and stiffness values obtained by using both bidirectional and GBP filter were compared to the corresponding images obtained by using GBP filter only.
RESULTS and DISCUSSION
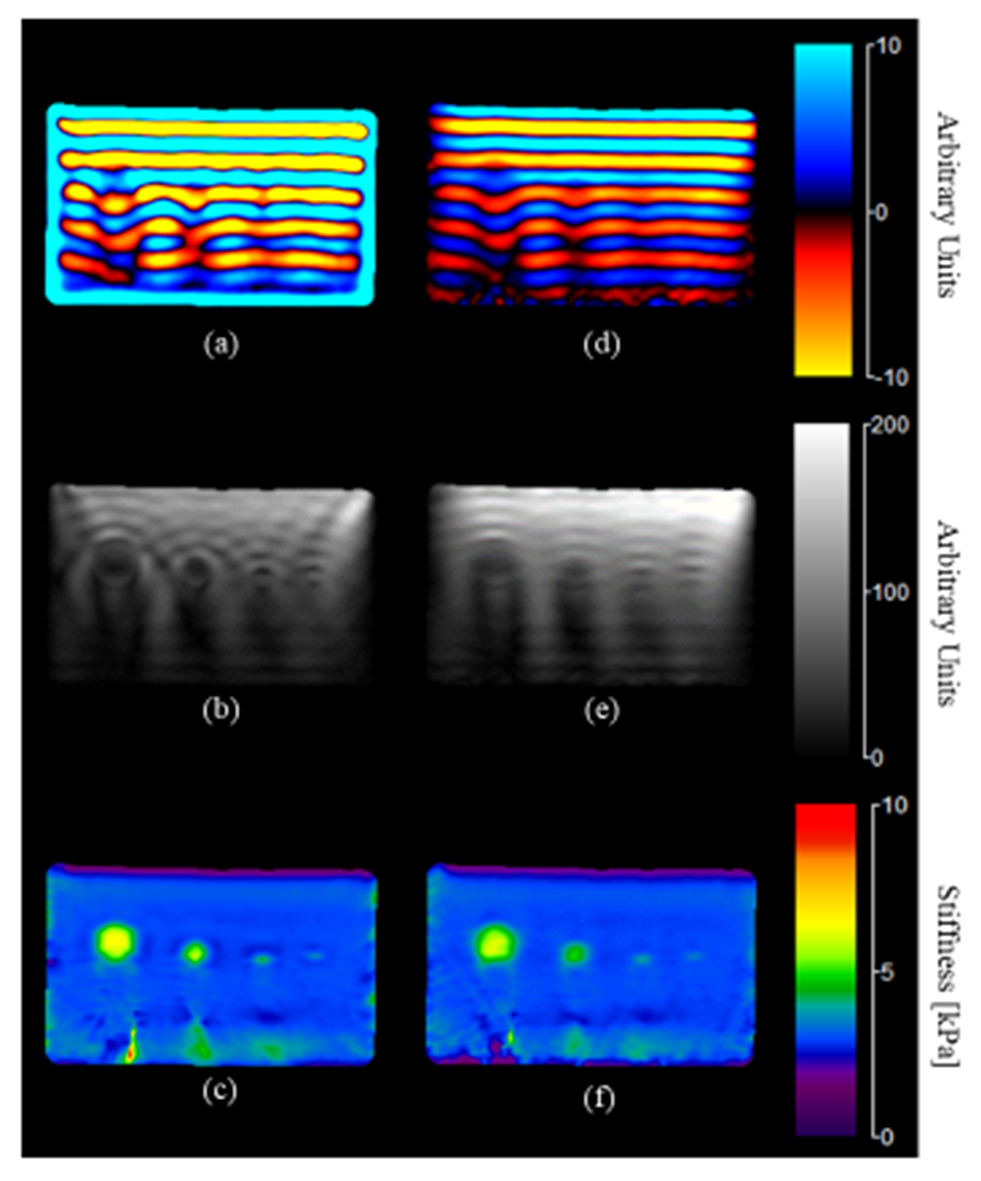
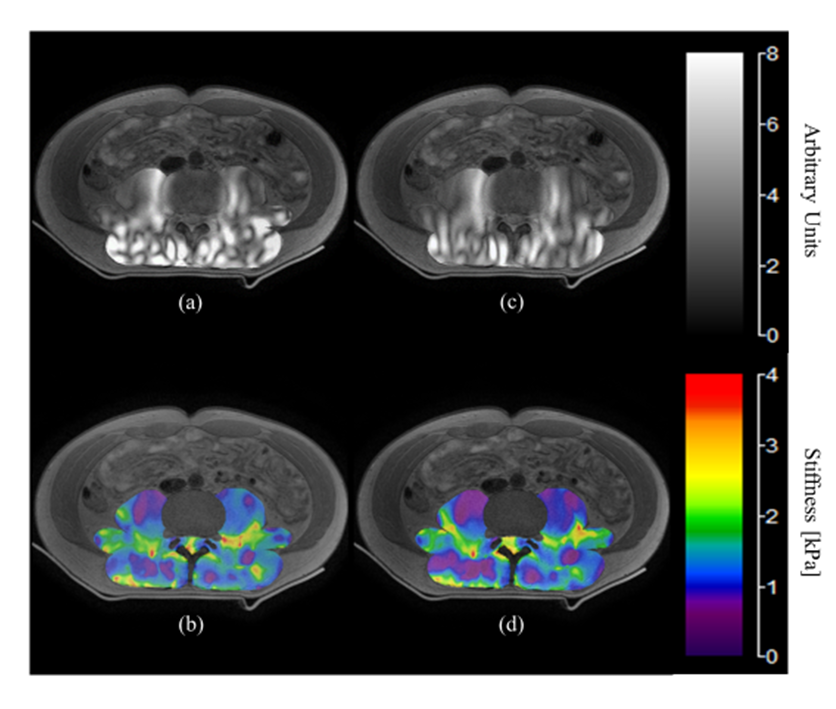
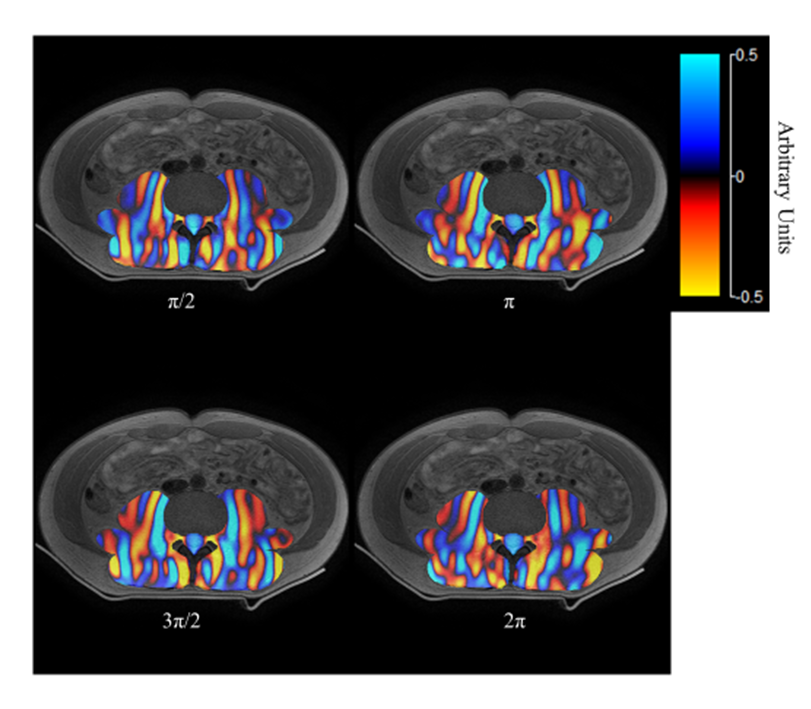
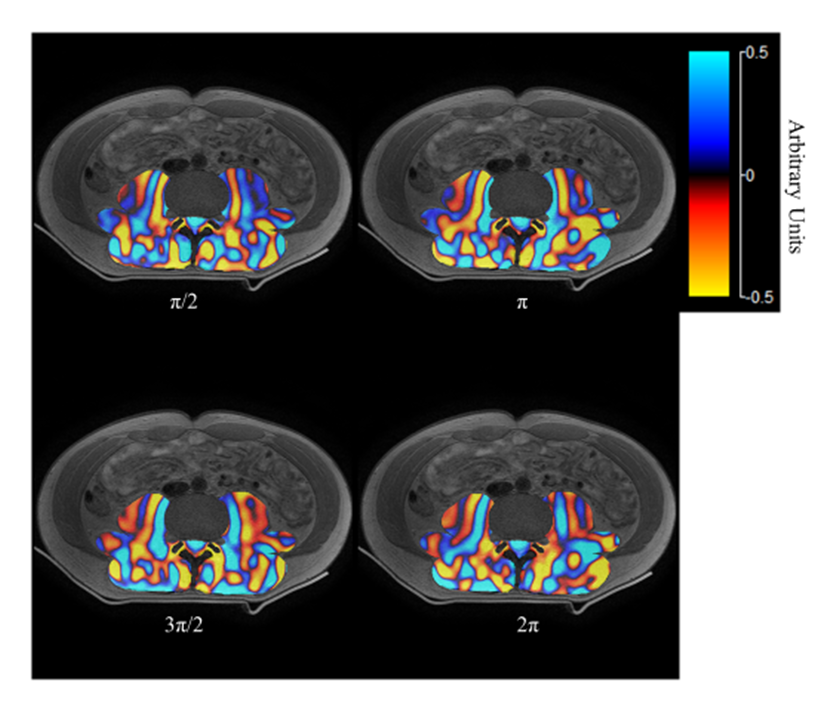
Figure 1 (a-f) shows the nodes in the directionally filtered MREWave image are greatly reduced than the non-directionally filtered image. Figure 2 (a) shows that the non-directionally filtered image contained many areas of nodes due to counteracting of wave interferences from adjacent tissues to the main wave propagation direction in PM muscle. The nodes are significantly reduced in bidirectionally filtered image (c). The wave motion was much clearer by using combined bidirectional and GBF filter as the pre-processor as shown in Figure 3 in compared to only using GBF as illustrated in Figure 4. Bidirectional filtered PM images showed improvement in visualization of wave propagation as the reflection and refraction waves from vortices and adjacent heterogenous tissues were greatly reduced. The amplitude map of the directionally filtered image depicted clearer wave bands in PM muscle than the only GBP filtered image.
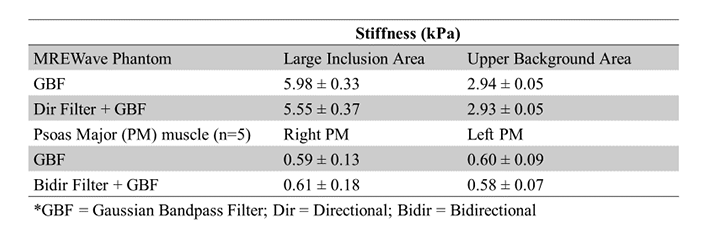
The quantitative values for shear modulus (kPa) for ROIs drawn in MREWave data and PM muscles are demonstrated in Figure 4. The LFE algorithm with bidirectional filtering showed no change in stiffness values as the LFE already incorporates similar filtering method. Taken together, the bidirectional filter along with GBP is recommended for PMMMRE. However, the usage of the bidirectional filter in PM muscle in other wave inversion methods are suggested for future work.
Acknowledgements
The author is thankful to the Tokyo Metropolitan Government, Japan for providing research grant.References
1. Muthupillai R, Lomas DJ, Rossman PJ, Greenleaf JF, Manduca A, Ehman RL. Magnetic resonance elastography by direct visualization of propagating acoustic strain waves. Science. 1995;269(5232):1854-7.
2. Manduca A, Lake DS, Kruse SA, Ehman RL. Spatio-temporal directional filtering for improved inversion of MR elastography images. Medical Image Analysis. 2003;7(4):465-73.
3. Arbanas J, Pavlovic I, Marijancic V, Vlahovic H, Starcevic-Klasan G, Peharec S, Bajek S, Miletic D, Malnar D. MRI features of the psoas major muscle in patients with low back pain. European Spine Journal. 2013;22(9):1965-71.
4. Numano T, Ito D, Takamoto K, Mizuhara K and Nishijo H. Application of MR Elastography to Transvertebral Psoas Major Muscle. Proceedings from the Joint Annual Meeting ISMRM-ESMRMB, Paris, France. 2018; Abstract Number: 1404.
5. Numano, T., Mizuhara, K., Hata, J., Washio, T., & Homma, K. A simple method for MR elastography: a gradient-echo type multi-echo sequence. Magnetic Resonance Imaging. 2015; 33:31-37.
6. Barnhill E, Kennedy P, Johnson CL, Mada M, Roberts N. Real‐time 4D phase unwrapping applied to magnetic resonance elastography. Magnetic Resonance in Medicine. 2015;73(6):2321-31.
7. Grimm RC, Lake DS, Manduca A, Ehman RL. MRE / Wave. Rochester (MN): Mayo Clinic. 2006. http://www.mayo.edu/research/labs/magnetic-resonance-imaging/mre-wave.
8. Knutsson H, Westin CF, Granlund G. Local multiscale frequency and bandwidth estimation. Proceedings of IEEE on Image Processing. 1994:36-40.
Figures