1276
Fascicle Ellipticity as an Explanation of Transverse Anisotropy in Diffusion MRI Measurements of Skeletal Muscle1Mechanical Science and Engineering, Univeristy of Illinois at Urbana Champaign, Urbana, IL, United States, 2Biomedical Engineering, Illinois Institute of Technology, Chicago, IL, United States, 3Mechanical Science and Engineering, University of Illinois at Urbana Champaign, urbana, IL, United States
Synopsis
Diffusion MRI of skeletal muscle exhibits a transverse anisotropy, the source of which has yet to be conclusively determined. To explore this, histological images were segmented into intracellular and extracellular domains and used to inform a direct numerical simulation of the Bloch-Torrey equation. Histology images were examined at the myocyte and fascicle scale and it was found that results from the fascicle images exhibited increased transverse anisotropy. These results suggest that fascicle organization may pay a hereunto unrecognized role in affecting dMRI in skeletal muscle.
Introduction
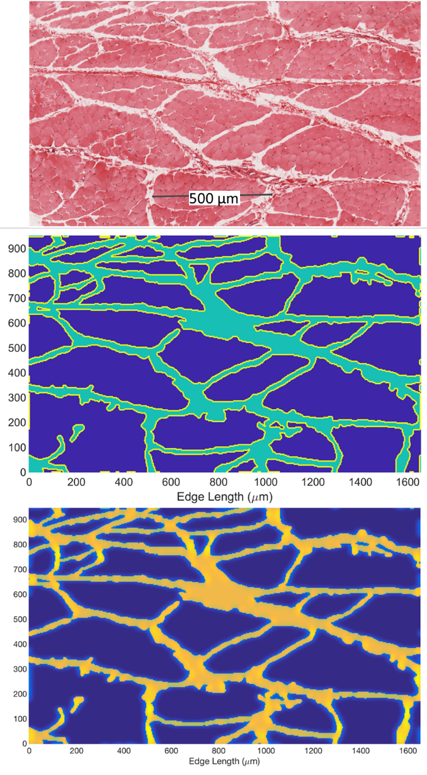
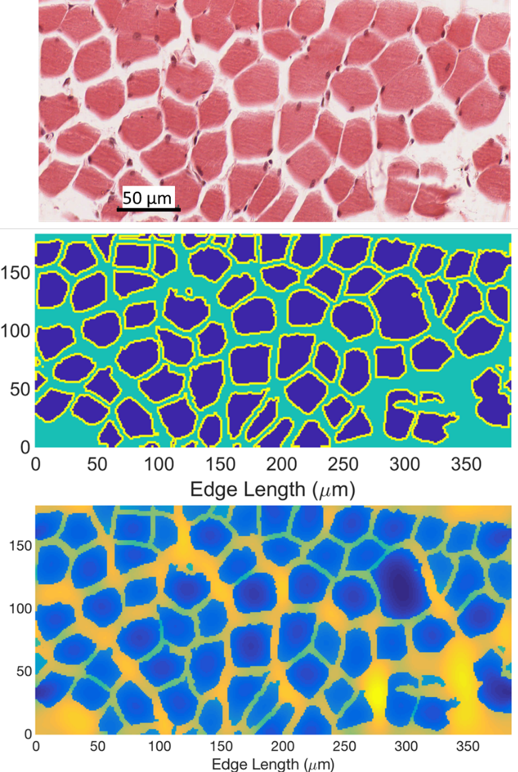
Diffusion MRI in skeletal muscle exhibits anisotropic diffusion behavior with three distinct eigenvalues (λ1/ λ2/ λ3).1 While the explanation for the difference in the primary and secondary values is well established to relate to diffusion in the axial direction of the muscle cell, the origin of the difference in λ2 and λ3 has not been conclusively determined. Myocardium also exhibits transverse anisotropy which is associated with its sheet-like structure,2 however, skeletal muscle does not exhibit such sheet-like organization. Skeletal muscle has a hierarchical organization of organized bundles (fascicles) surrounded by a connective collagen tissue (perimysium). These fascicles are in turn made up of individual muscle fibers (myocytes) and are also surrounded by connective tissue (endomysium). Most investigations of skeletal muscle structure’s effect on dMRI signal focus on this myocyte level because its length scale relates to the diffusion distance typical in dMRI experiments. The length scale of fascicles is much larger than this diffusion distance and so not expected to influence the signal. Myocyte ellipticity has been proposed as an explanation for the transverse anisotropy,3 however, such ellipticity would need long-range organization for its cumulative effect to appear at the voxel level which has not been observed. Contrary to this, ellipticity of fascicles can be readily observed in histological images (Figure 1). Though the fascicle is larger than the diffusion distance, the perimysium thickness is on the order of the diffusion distance and occupies enough voxel volume (~10%) to affect the dMRI signal. In this abstract, histological images of myocyte and fascicle structures are used to numerically simulate dMRI experiments to examine how realistic structures at these different spatial scales affect dMRI signal.Methods
Histological images of fascicle and myocytes from different muscle groups and species were collected and processed with ImageJ4 which segmented the image into intra- and extracellular domains. These domains related either to the perimysium and fascicle space or the endomysium and myocyte space. Three histology images at the fascicle level5-7 and four at the myocyte level7-10 were obtained. These images were used as the basis of a periodic domain over which the Bloch-Torrey equation was numerically solved11 for an applied PGSE pulse with b = 800 s/mm2 and δ/Δ/TE=10/60/70 ms applied in 10 gradient directions. The intracellular space had a diffusion coefficient of 1.5 µm2/ms and T2 of 40 ms while the extracellular space had a diffusion coefficient of 2.0 µm2/ms and T2 of 80 ms. Surrounding the cell is a sarcolemma membrane with permeability of 40 µm/ms. Parameters were chosen in keeping with reported literature values. The simulated signals were used to estimate a diffusion tensor using custom code written in MATLAB from which eigenvectors, eigenvalues, FA and ADC were determined.Results
Representative cases of the original histology image, segmented image, and the simulated signal for fascicle and myocyte structures are shown in Figures 1 and 2 respectively. Figures 1 and 2 are from the same high-resolution histology image at different levels of magnification.7 Within each fascicle the domain is assumed to be homogeneous and isotropic to avoid effects of myocyte structure on the signal. Table 1 shows the computed DTI metrics of the simulations and DTI measurements from a previous dataset of the vastus medialis as a reference of typically measured values.12Discussion and Conclusion
It has been hypothesized that skeletal muscle’s transverse anisotropy is due to structural similarity to myocardium1 or due to ellipticity of the muscle fibers,3 but such structures have not been observed in histology. Combining these hypotheses, fascicle ellipticity partially explain the observed transverse anisotropy. Though the fascicle is much larger than the diffusion distance, its elongated organization leads to a perimysium pathway along which diffusion is unrestricted. This pathway has a large enough volume fraction of the domain to materially influence the signal. Under this interpretation, the larger λ2 is reflective of this perimysium pathway. The origin of this fascicle ellipticity is unknown and needs to be carefully investigated to ensure it is not an artifact of histology preparation, though differences in the ellipticity of fascicles and myocytes have also been examined in determining effective mechancial properties.13 The secondary eigenvectors’ directions are macroscopically organized and can be tracked,14 and examination of this transverse anisotropy could be a new avenue of using dMRI to understand muscle organization beyond tractography. Additionally, these results challenge the common assumption of modeling skeletal muscle as a system of packed myocytes with no regard for larger structural features. Explaining this transverse anisotropy may require sophisticated multiscale models of diffusion in muscle which incorporate both myocyte and fascicle level structural information.Acknowledgements
Funding for this work was provided by NSF Grant CMMI-1437113 and NSF Graduate Research Fellowship for NMN. This work used the Extreme Science and Engineering Discovery Environment (XSEDE), which is supported by National Science Foundation grant number ACI-1548562 and provided access to the SDSC Comet Cluster under allocation #TG-MCB180044.References
[1] Galbán, C. J., Maderwald, S., Uffmann, K., et al. (2004). Diffusive sensitivity to muscle architecture: a magnetic resonance diffusion tensor imaging study of the human calf. European Journal of Applied Physiology, 93(3), 253–262.
[2] Dou, J., Tseng, W.-Y. I., Reese, T. G., & Wedeen, V. J. (2003). Combined diffusion and strain MRI reveals structure and function of human myocardial laminar sheets in vivo. Magnetic Resonance in Medicine, 50(1), 107–113.
[3] Karampinos, D. C., King, K. F., Sutton, B. P., & Georgiadis, J. G. (2009). Myofiber ellipticity as an explanation for transverse asymmetry of skeletal muscle diffusion MRI in vivo signal. Annals of Biomedical Engineering, 37(12), 2532–2546.
[4] Schneider, C. A., Rasband, W. S., & Eliceiri, K. W. (2012). NIH Image to ImageJ: 25 years of image analysis. Nature methods, 9(7), 671.
[5] University of Wisconsin Medical School – Department of Anatomy. Retrieved from: http://histologyatlas.wisc.edu/slides/291/labeled. (accessed Nov. 6, 2018).
[6] Skeletal Muscle 100x H&E. Retrieved from: http://histology-world.com/photoalbum/displayimage.php?album=27&pid=1372. (accessed Nov. 6, 2018).
[7] Skeletal muscle, cross section, H&E, 40X. Retrieved from: http://virtualslides.med.umich.edu/Histology/Basic%20Tissues/Muscle/058T_HISTO_40X.svs/view.apml?cwidth=817&cheight=737&chost=virtualslides.med.umich.edu&csis=1&X=0&Y=0&zoom=4.09417768499188&listview=1. (accessed Nov. 6, 2018).
[8] Cross Section of Skeletal Muscle. Retrieved from: https://anatomyclass01.us/cross-section-of-skeletal-muscle/cross-section-of-skeletal-muscle-skeletal-muscle-veterinary-histology/. (accessed Nov. 6, 2018).
[9] Cross section of normal skeletal muscle from mouse quadriceps. Retrieved from: https://www.flickr.com/photos/agaphd/5923238105/in/photostream/. (accessed Nov. 6, 2018). [10] Jennings, R. and Premanandan, C. (2017) Veterinary Histology Chapter 4: Skeletal Muscle. https://ohiostate.pressbooks.pub/vethisto/chapter/4-skeletal-muscle/
[11] Naughton, N. M., Tennyson, C. G., & Georgiadis, J. G., Lattice Boltzmann method for simulation of diffusion magnetic resonance imaging physics in heterogeneous tissue models. Journal of Computational Physics, (submitted 2018)
[12] Gharibans, A. A., Johnson, C. L., Chen, D. D., et al. (2012). Using DTI to Assess the Effect of Diet or Exercise in Elderly Obese Women. International Society for Magnetic Resonance in Medicine, Melbourne,1426.
[13] Sharafi, B., & Blemker, S. S. (2010). A micromechanical model of skeletal muscle to explore the effects of fiber and fascicle geometry. Journal of Biomechanics, 43(16), 3207–3213.
[14] Gharibans, A. A., Johnson, C. L., Chen, D. D., & Georgiadis, J. G. (2011). Reconstruction of 3D fabric structure and fiber nets in skeletal muscle via in vivo DTI. International Society for Magnetic Resonance in Medicine, Montreal, 1154.
Figures