1275
Extended phase graph model based tissue-water T2 estimation from CPMG image data in fat-infiltrated skeletal muscle: application in amyotrophic lateral sclerosis and Kennedy’s disease1UCL Queen Square Institute of Neurology, University College London, London, United Kingdom, 2Glaxo Smith Kline, London, United Kingdom, 3Department of Biomedical Engineering, King’s College London, London, United Kingdom
Synopsis
An MRI CPMG extended phase graph signal model was used to determine muscle-water T2 (T2m) in fat-infiltrated skeletal muscle, using a fixed two-component approximation to the fat signal. Stable estimates of T2m and apparent fat fraction (ffa) in the thigh muscles of amyotrophic lateral sclerosis and Kennedy’s disease patients and healthy controls were obtained. T2m were elevated in both patient groups, as was ffa with a distribution consistent with that obtained by 3-point Dixon MRI.
Introduction
In many neuromuscular diseases the dominant pathological pathway involves intra-muscular fat infiltration, making the determination of the remaining muscle tissue-water T2 (T2m), a measure potentially sensitive to active disease processes, challenging. One method proposed to achieve this is multi-component analysis of CPMG multi-echo imaging data1-3. We have improved the existing methods by implementing a multi-component slice-profile compensated extended phase graph (EPG) model of the CPMG signal, with the fat signal incorporated as two EPG components with fixed parameters, and the remaining unknown parameters determined by maximum likelihood estimation (MLE)4. In the current work we applied this new method to lower-limb data obtained at baseline in a prospective cohort study of patients with amyotrophic lateral sclerosis (ALS), Kennedy’s disease (KD) and matched healthy controls (CTR).Methods
Participant groups comprised: KD (n=20, mean ± SD age 50.7 ±17y) and ALS (n=20, age 57.3 ±14.8y), CTR (n=16, age 55.4 ±13.5y). Height and weight did not significantly differ between the patient groups and controls, except for ALS patients having a significantly lower body mass index (BMI) compared to their control group (p=0.009). Lower limb MRI was performed at 3T (Siemens MAGNETOM Skyra) using a combination of a flexible matrix-coil (4-Channel Flex Coil) and peripheral vascular coil (36-channels). Data were acquired with a multi-echo spin-echo sequence (TR= 3630/3500ms, 22 TEs from 10-220ms with 10ms interval, 9 x 6 mm slices, matrix 320x160, in-plane resolution 1.3125x1.3125 mm). Ten thigh muscles were manually segmented on a central slices using ITK-snap software. A multi-component slice profile-corrected EPG model [s(TE) = (1 - ffa) · sEPG(B1f, T2m, α, σN, TE) + ffa · [ 0.33 · sEPG(B1f, T2=40ms, α, σN, TE) + 0.67 · sEPG(B1f, T2=198ms, α, σN, TE)] was fitted pixel-wise to the data using MLE in a custom-written MATLAB tool, to estimate T2m, the B1 field error factor (B1f) , apparent fat fraction (ffa), overall amplitude (α) and Rician noise SD (σN). The fixed 2-component fat signal model parameters were determined in a preliminary calibration as mean values estimated from 4 subcutaneous fat ROIs in 8 representative subjects. For quality control, pixel values were excluded which failed to meet fit-quality criteria [R2 (goodness of fit) > 0.8, and T2m>11ms] or appeared as pure fat (T2m<15ms & ffa >90%). Median T2m and ffa were calculated for all individual muscle ROIs; for comparison mean cross-sectional muscle fat-fraction was determined independently by 3-point Dixon MRI (ffd).Results
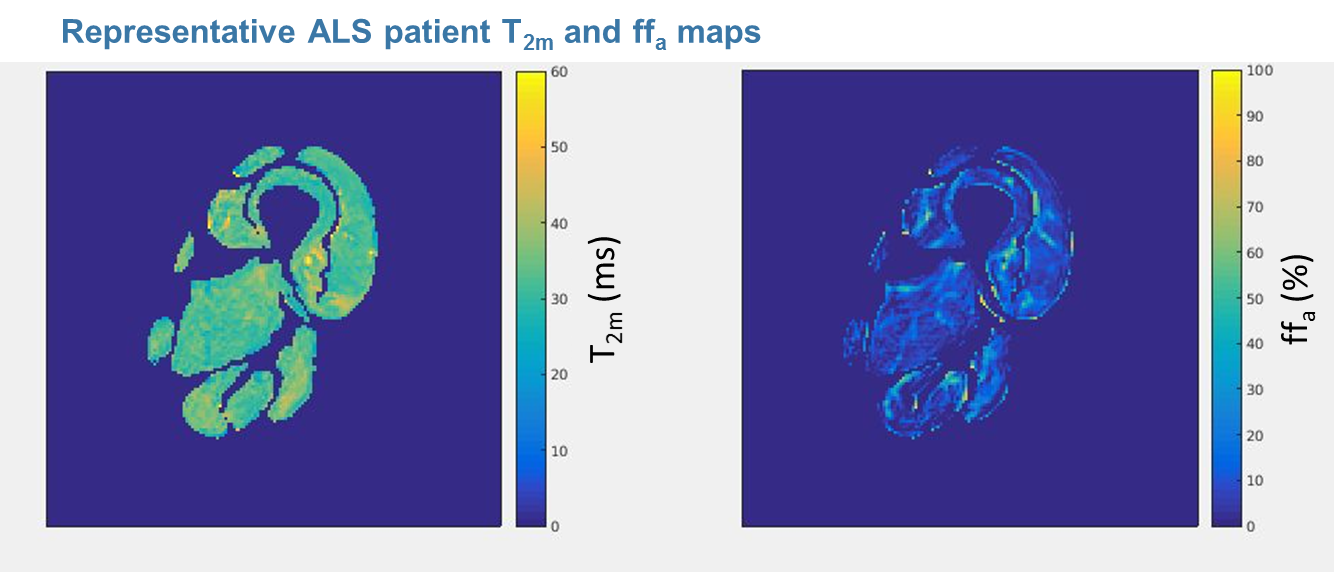
Image data quality was adequate to yield T2m maps (fig 1) from 15 CTR, 18 ALS and 18 KD participants.
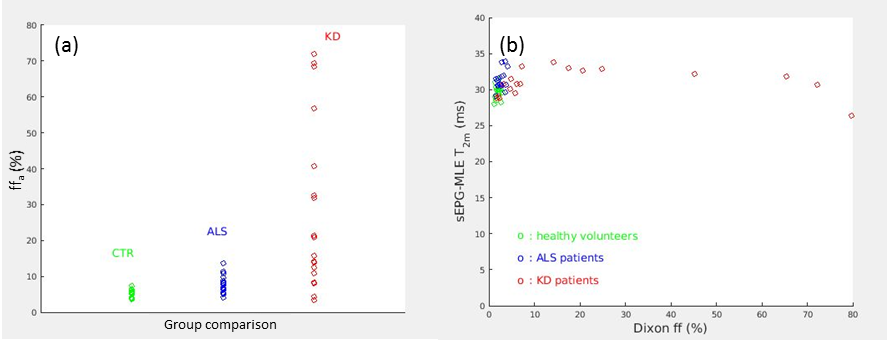
Median ffa across all thigh–level muscles was increased in ALS and more markedly in KD vs. controls (fig 2a); 3-point Dixon obtained ff distributions were qualitatively similar. Whole thigh-level muscle group mean ± SD T2m was 29.6 ± 1.0ms in controls, 31.3 ± 1.4ms in ALS, and 31.2 ± 1.6ms in KD (p=0.0004 and p=0.0007 vs. controls respectively). Importantly overall cross-sectional mean T2m were largely independent of 3-point Dixon-determined ff for both groups (fig 2b).
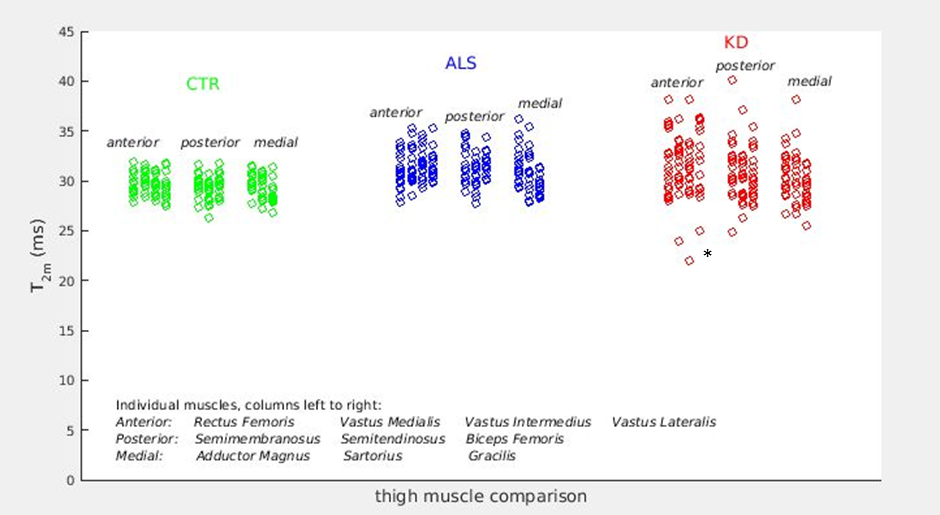
At the level of individual muscles (Fig 3), CTR median T2m distributions were consistent between muscles. In both the ALS and KD patients, there was evidence of varied patterns of T2m elevation.
Discussion
Using a standard multi-echo acquisition with MLE fitting of parameters in a slice-compensated multi-component EPG signal model, we have obtained highly consistent T2m estimates in the CTR group, and evidence of disease-associated elevated T2m in both ALS and KD patients, apparently independent of disease-related fat content increase. CPMG-obtained ffa were qualitatively consistent with those from Dixon MRI, but there were small systematic differences which are the subject of ongoing investigations. T2m obtained from CPMG images using these methods may therefore be a sensitive measure of neuromuscular pathology.Acknowledgements
This research was funded through an EPSRC CASE studentship with GSK, and support from the National Institute for Health Research University College London Hospitals Biomedical Research Centre.References
1. AZZABOU, N., LOUREIRO DE SOUSA, P., CALDAS, E. & CARLIER, P. G. 2015. Validation of a generic approach to muscle water T2 determination at 3T in fat-infiltrated skeletal muscle. J Magn Reson Imaging, 41, 645-53.
2. LEBEL, R. M. & WILMAN, A. H. 2010. Transverse relaxometry with stimulated echo compensation. Magn Reson Med, 64, 1005-14.
3. MARTY, B., BAUDIN, P. Y., REYNGOUDT, H., AZZABOU, N., ARAUJO, E. C., CARLIER, P. G. & DE SOUSA, P. L. 2016. Simultaneous muscle water T2 and fat fraction mapping using transverse relaxometry with stimulated echo compensation. NMR Biomed, 29, 431-43.
4. ZAFEIROPOULOS, N, 2018. Improved muscle T2 estimation by maximum-likelihood parameter estimation using an extended-phase-graph signal model with locally estimated Rician noise levels. ISMRM 2018 abstract 2763.
Figures