1274
Compressed-Sensing 4D Flow MRI of the Skeletal Muscle during Nerve vs Muscle Electrical Stimulation1Department of Radiology, Division of Radiological Physics, University Hospital Basel, Basel, Switzerland, 2Department of Biomedical Engineering, University of Basel, Basel, Switzerland, 3Institute of Sport Sciences, University of Lausanne, Lausanne, Switzerland, 4Department of Radiology, University Hospital Basel, Basel, Switzerland, 5Siemens Medical Solutions, Cleveland, OH, United States
Synopsis
The purpose of this study was to use dynamic 4D phase contrast MR imaging to compare the stimulation patterns of neuromuscular electrical stimulation of the calf muscles when delivered through the muscle belly or through the nerve trunk. Experiments were performed on healthy volunteers and strain maps were obtained for each stimulation modality. A more homogeneous activation of the muscle group was obtained for nerve stimulation, with overall lower strain values with respect to muscle stimulation.
Purpose
The purpose of this study was to use dynamic 4D phase contrast MR imaging synchronized with neuromuscular electrical stimulation (NMES) in order to study the contraction of the triceps surae muscle group during transcutaneous stimulation delivered either through the nerve trunk (“nerve stimulation”) or through the muscle belly (“muscle stimulation”). Although both types of stimulation have been compared in the past1-3, there is little information about the difference in the actual three-dimensional (3D) patterns of muscle contraction, due to lack of available imaging methods. In general, nerve stimulation is hypothesized to yield a more homogeneous and less superficial recruitment than muscle stimulation under certain conditions. Using a compressed-sensing approach, a time-resolved, three-directional, 3D velocity acquisition (“4D-flow”) is now feasible during NMES-evoked exercise without the insurgence of fatigue. Here, we exploited this method to investigate the 3D contraction patterns in four healthy volunteers.Methods
Four healthy volunteers (1 female, mean age 35y, range: 24-46y) were scanned at a 3T whole-body scanner (Magnetom Prisma, Siemens Healthcare, Erlangen, Germany) during NMES.
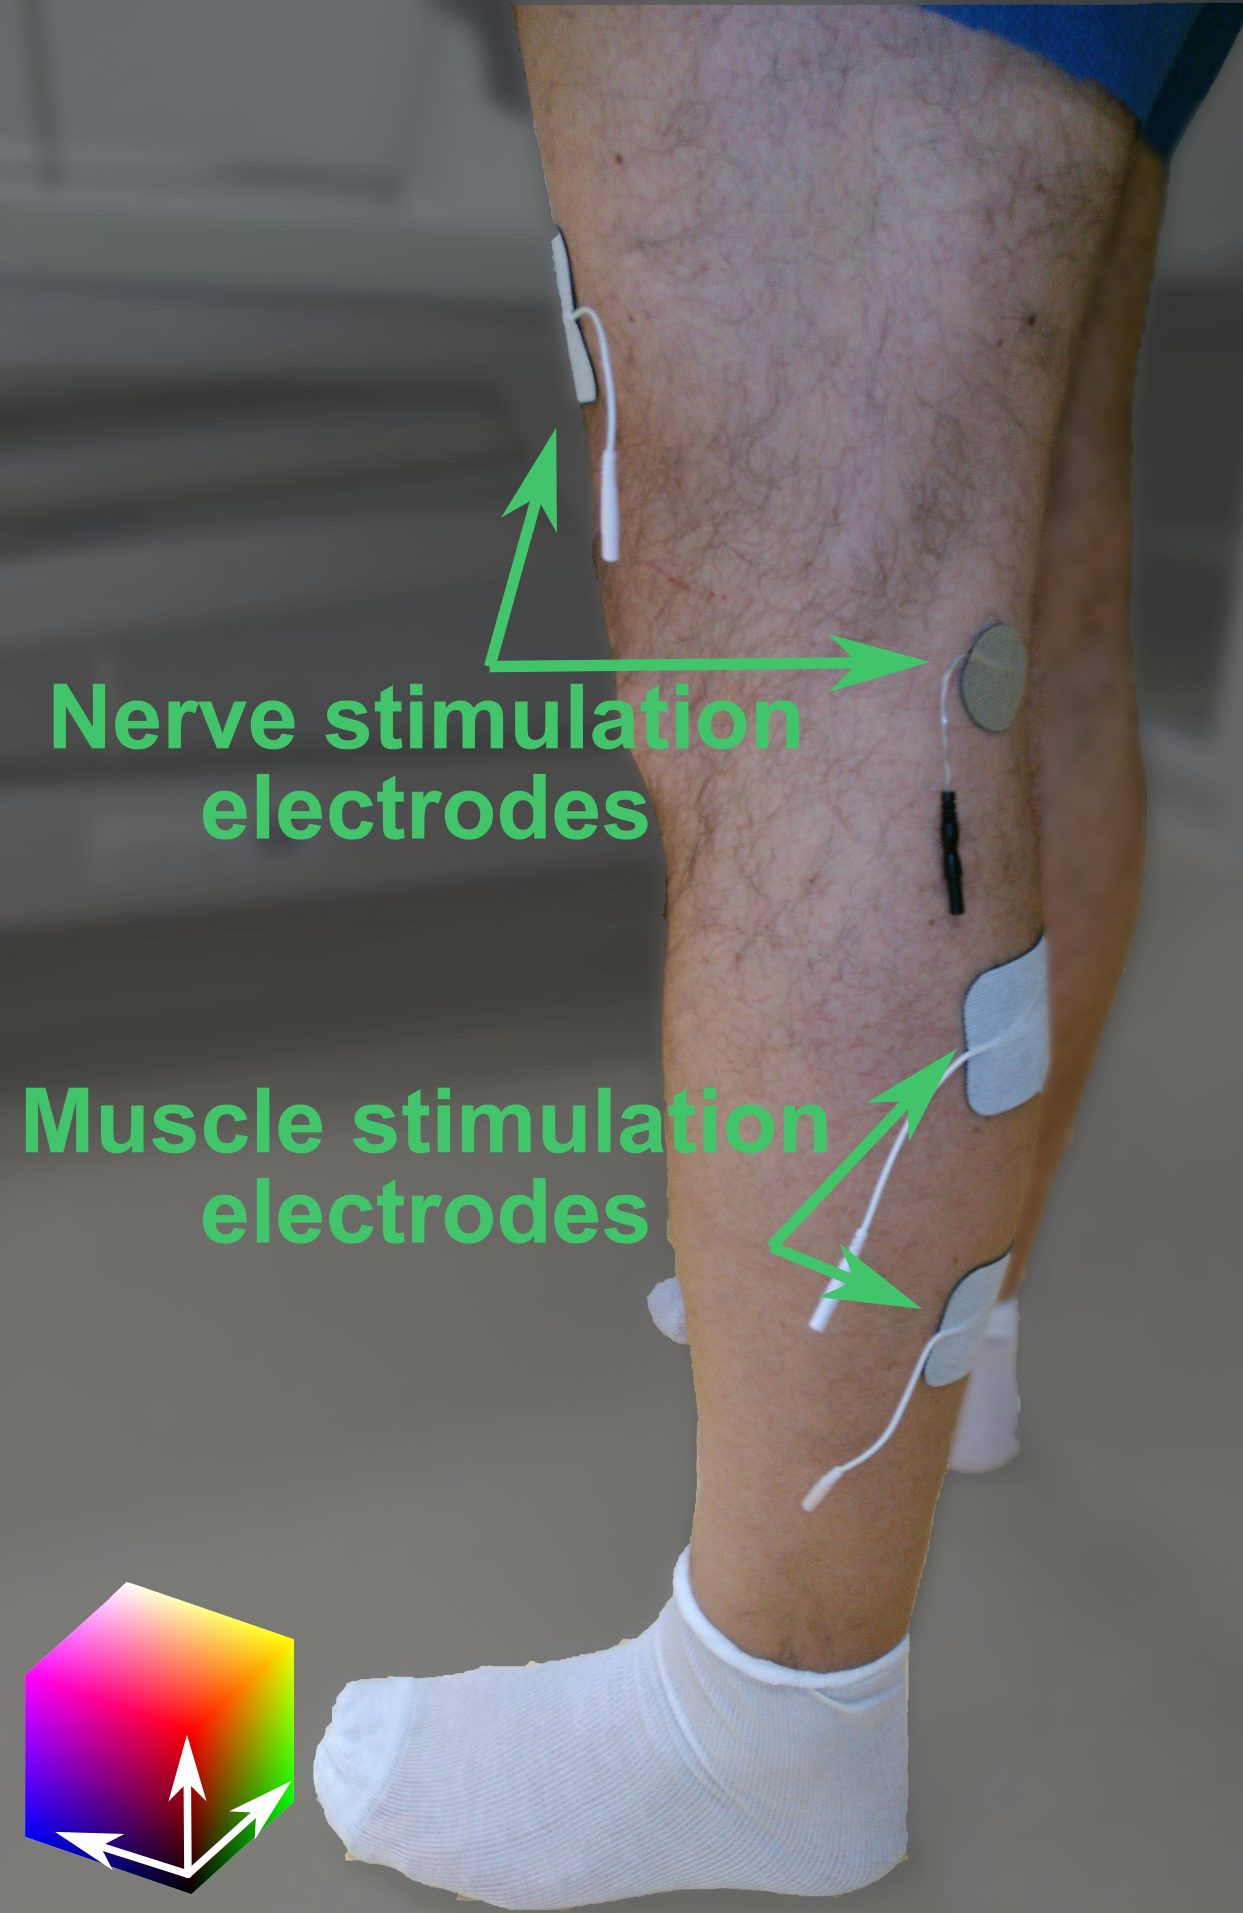
The subjects were prepared by placing two sets of gel-based electrodes on one of the subject’s legs (Figure 1). The stimulation intensity was tested and the evoked force was measured before the scan with a custom made MR-compatible sensor4, as well as the maximum voluntary force (MVF) in the same position. The stimulation intensity was established immediately before the dynamic acquisition as the current required to elicit a force of approximately 25N, equal for both muscle and nerve stimulation. This target was identified as a sufficient force to elicit a visible muscle twitching, but less than 10% of the MVF to avoid fatigue during the scan.
For the stimulation, a commercial 2-channel EMS device (EM49, Beurer GmbH, Ulm, Germany), was used to induce periodic muscle contraction of the calf muscles. Biphasic stimulation with rectangular pulses was applied (pulse width: 400μs, pulse frequency: 80Hz, contraction duration: 750ms, release duration: 750ms release).
During the MR acquisition, the second channel of the stimulator was converted to a trigger signal by a custom electronic device5.
For the dynamic acquisition, a prototype prospectively-gated highly accelerated Cartesian 4D flow imaging sequence using L1-regularized wavelet-based compressed sensing6,7 was placed in a sagittal orientation to cover the whole calf. The force output of the plantar flexion was continuously recorded.
The imaging protocol had the following parameters: TE/TR 4.2/6.87ms, flip angle 10°, bandwidth 455Hz/px, matrix size 144x108x48, resolution 2.1x2.1x2.5mm³, Venc 15cm/s, 2 k-space lines per segment, acceleration factor 7.6. The acquisition time was 5 minutes per each dataset.
The 4D acquisition was repeated twice, firstly during nerve stimulation and then after a 10-minute pause, another acquisition was performed during muscle belly stimulation.
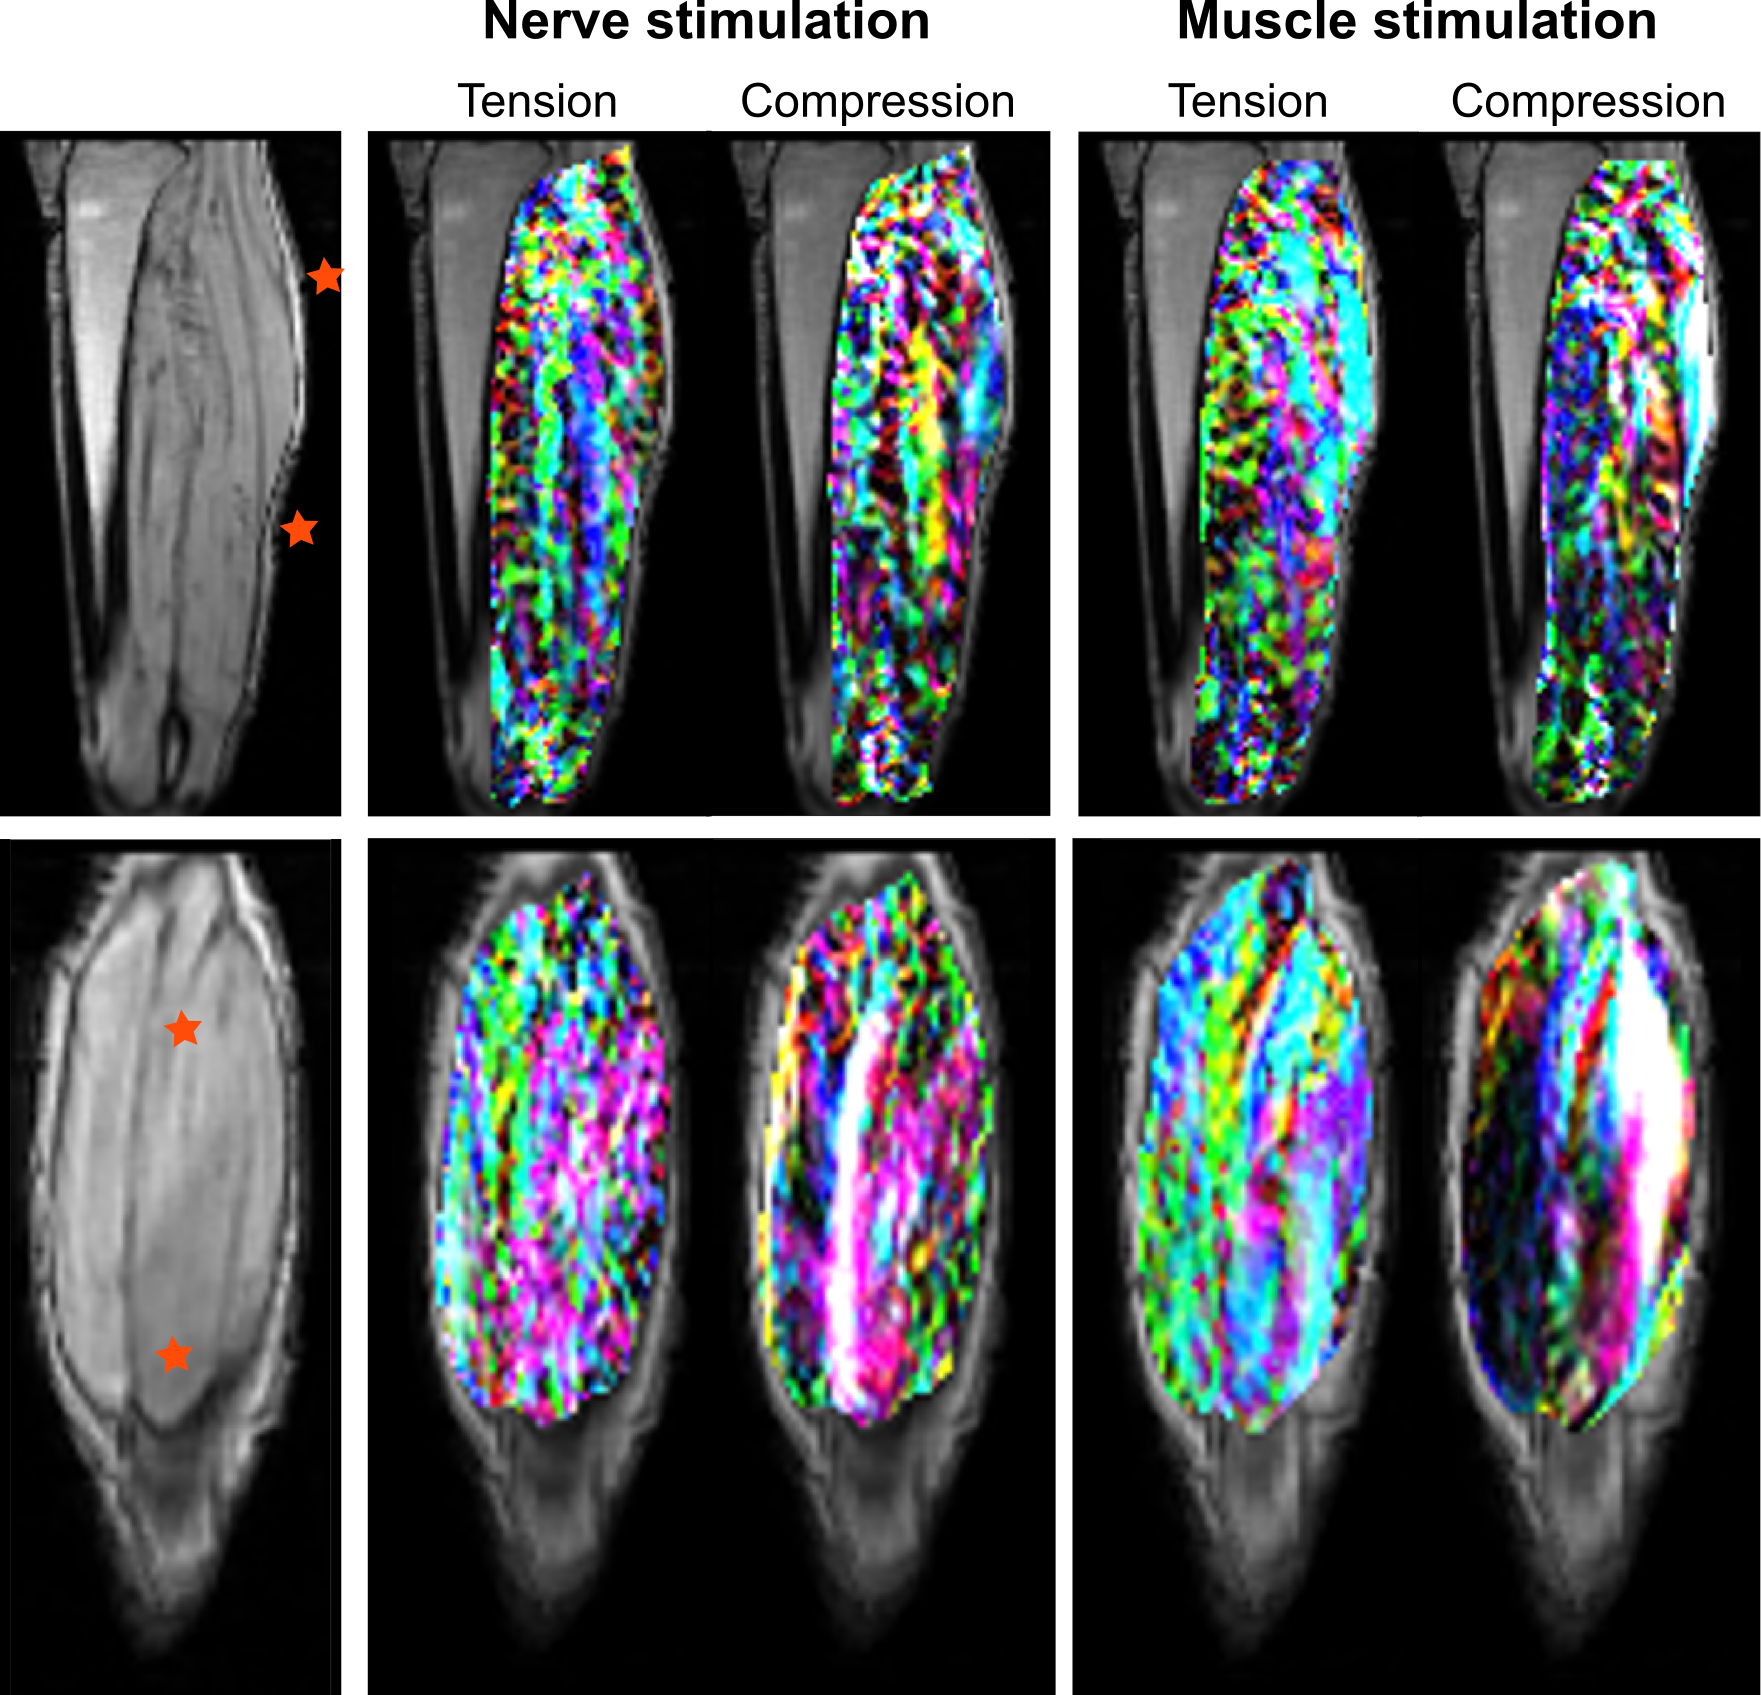
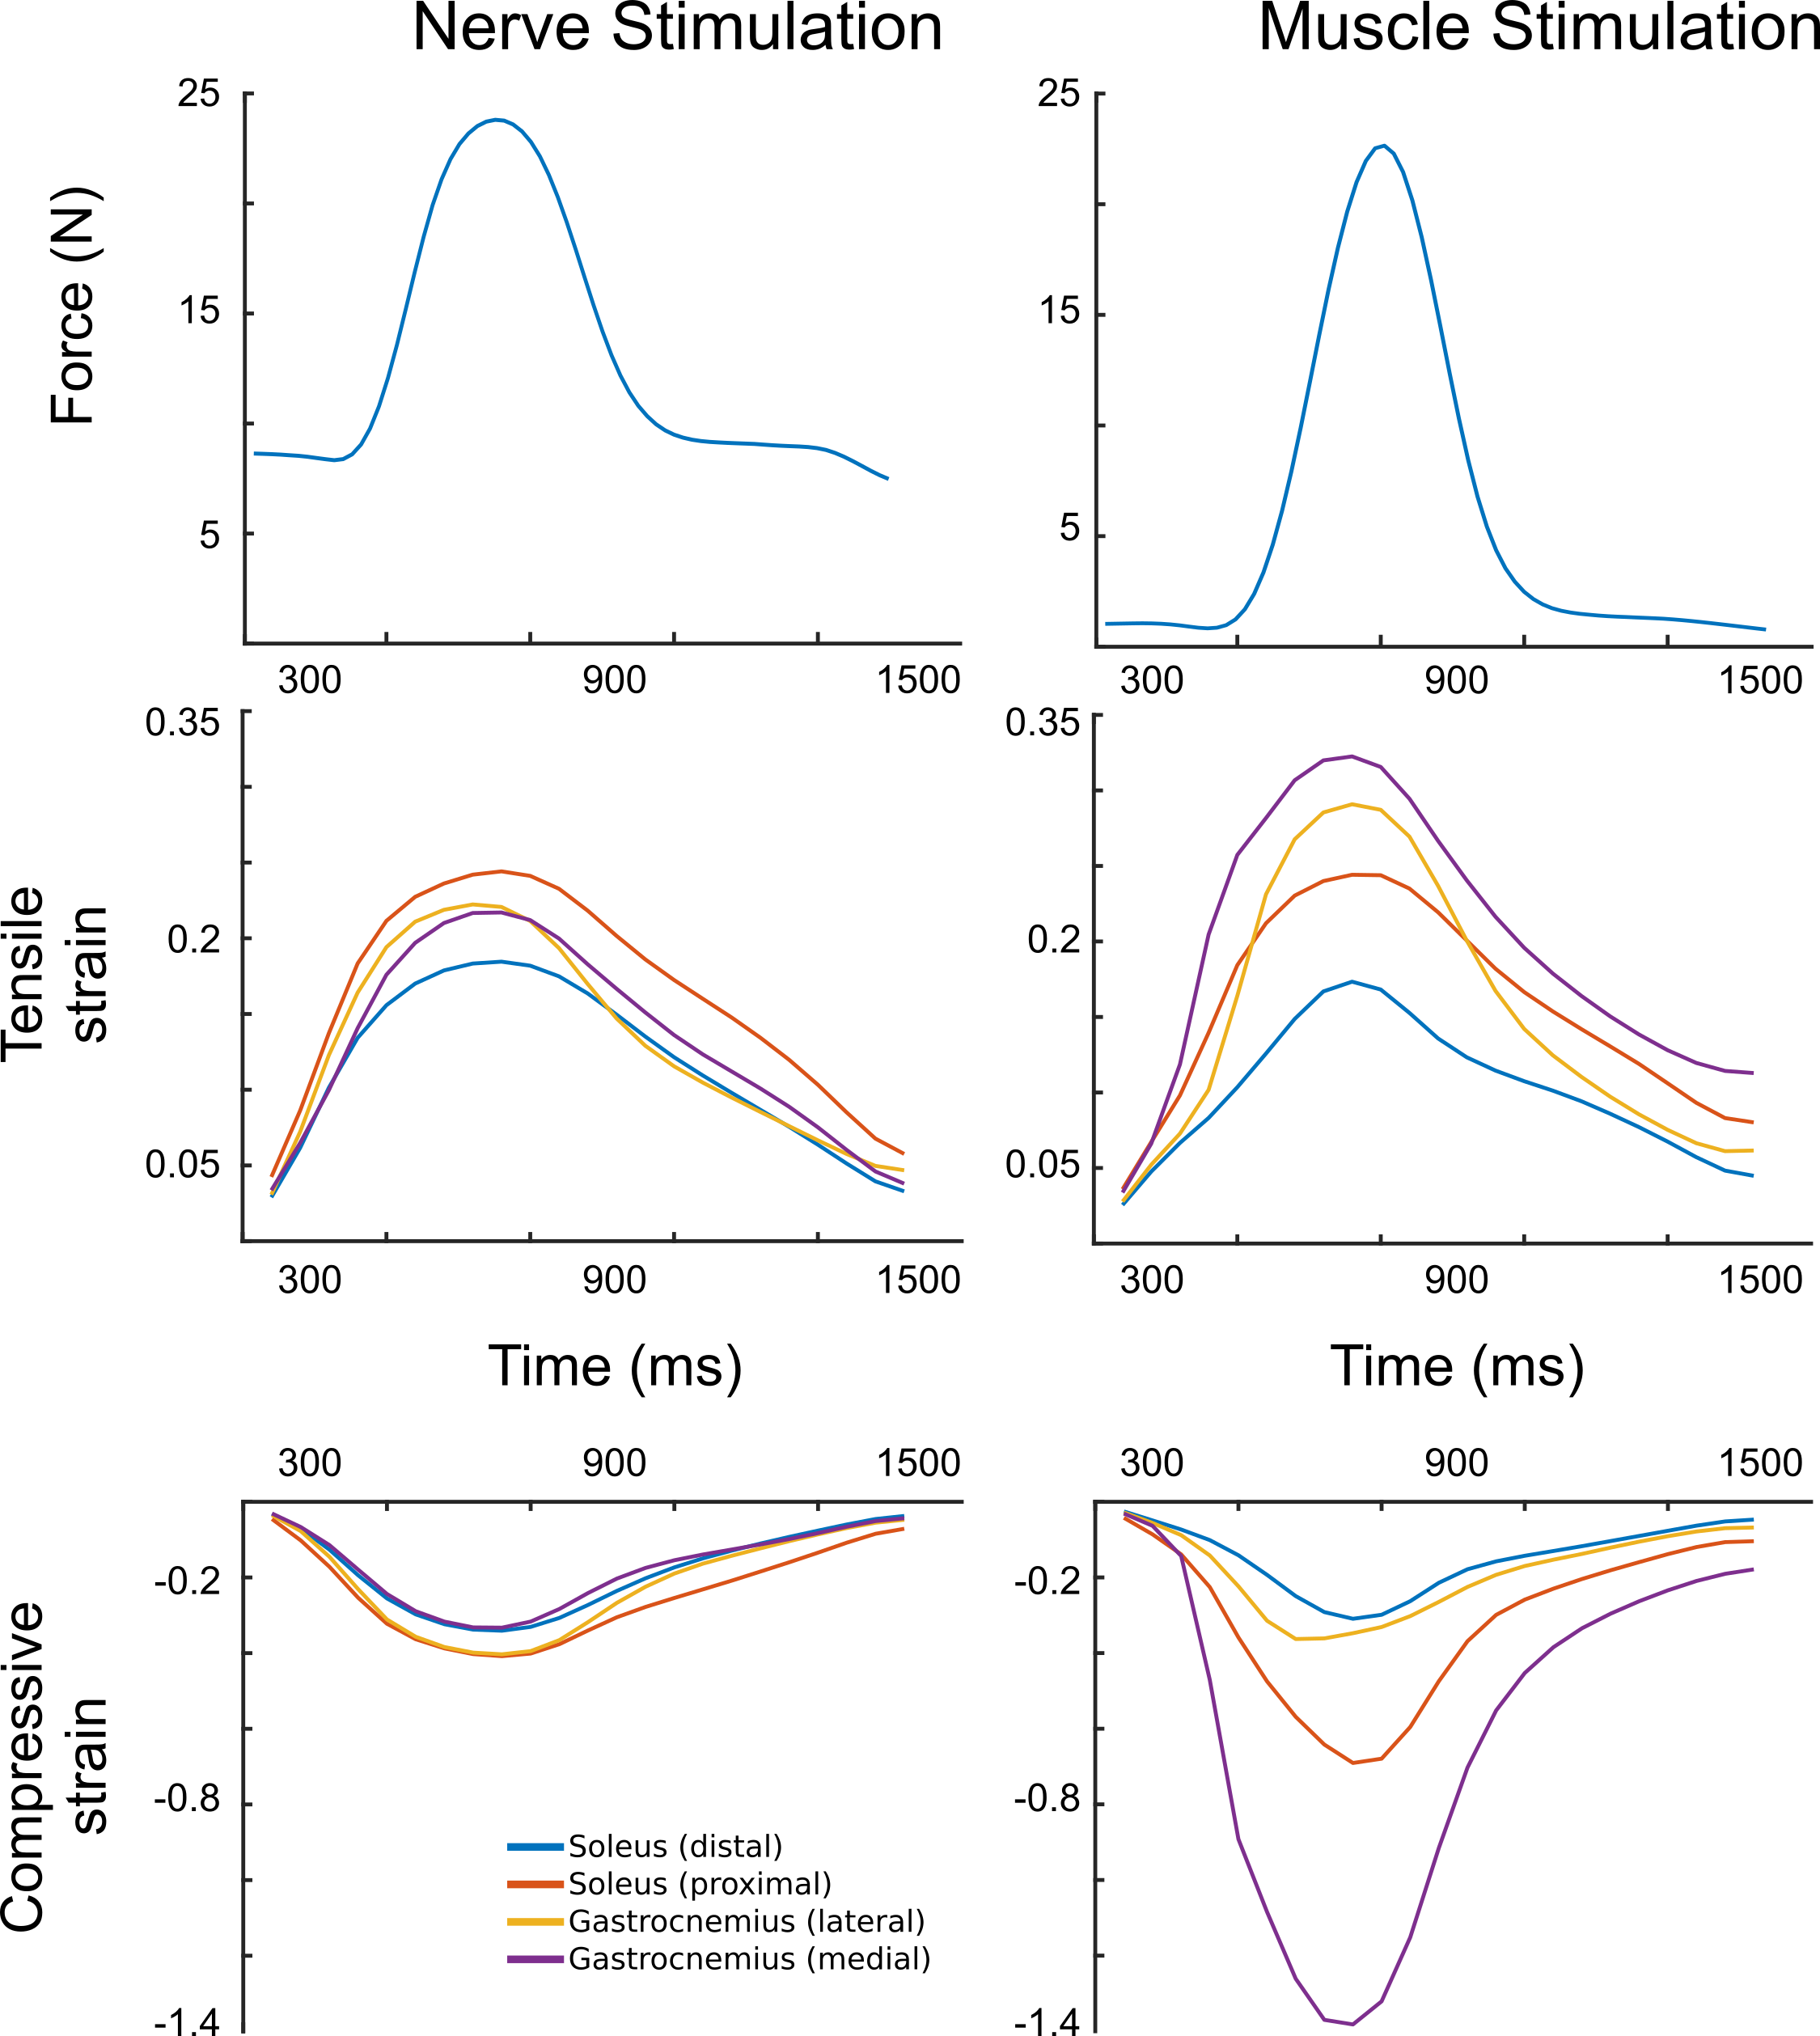
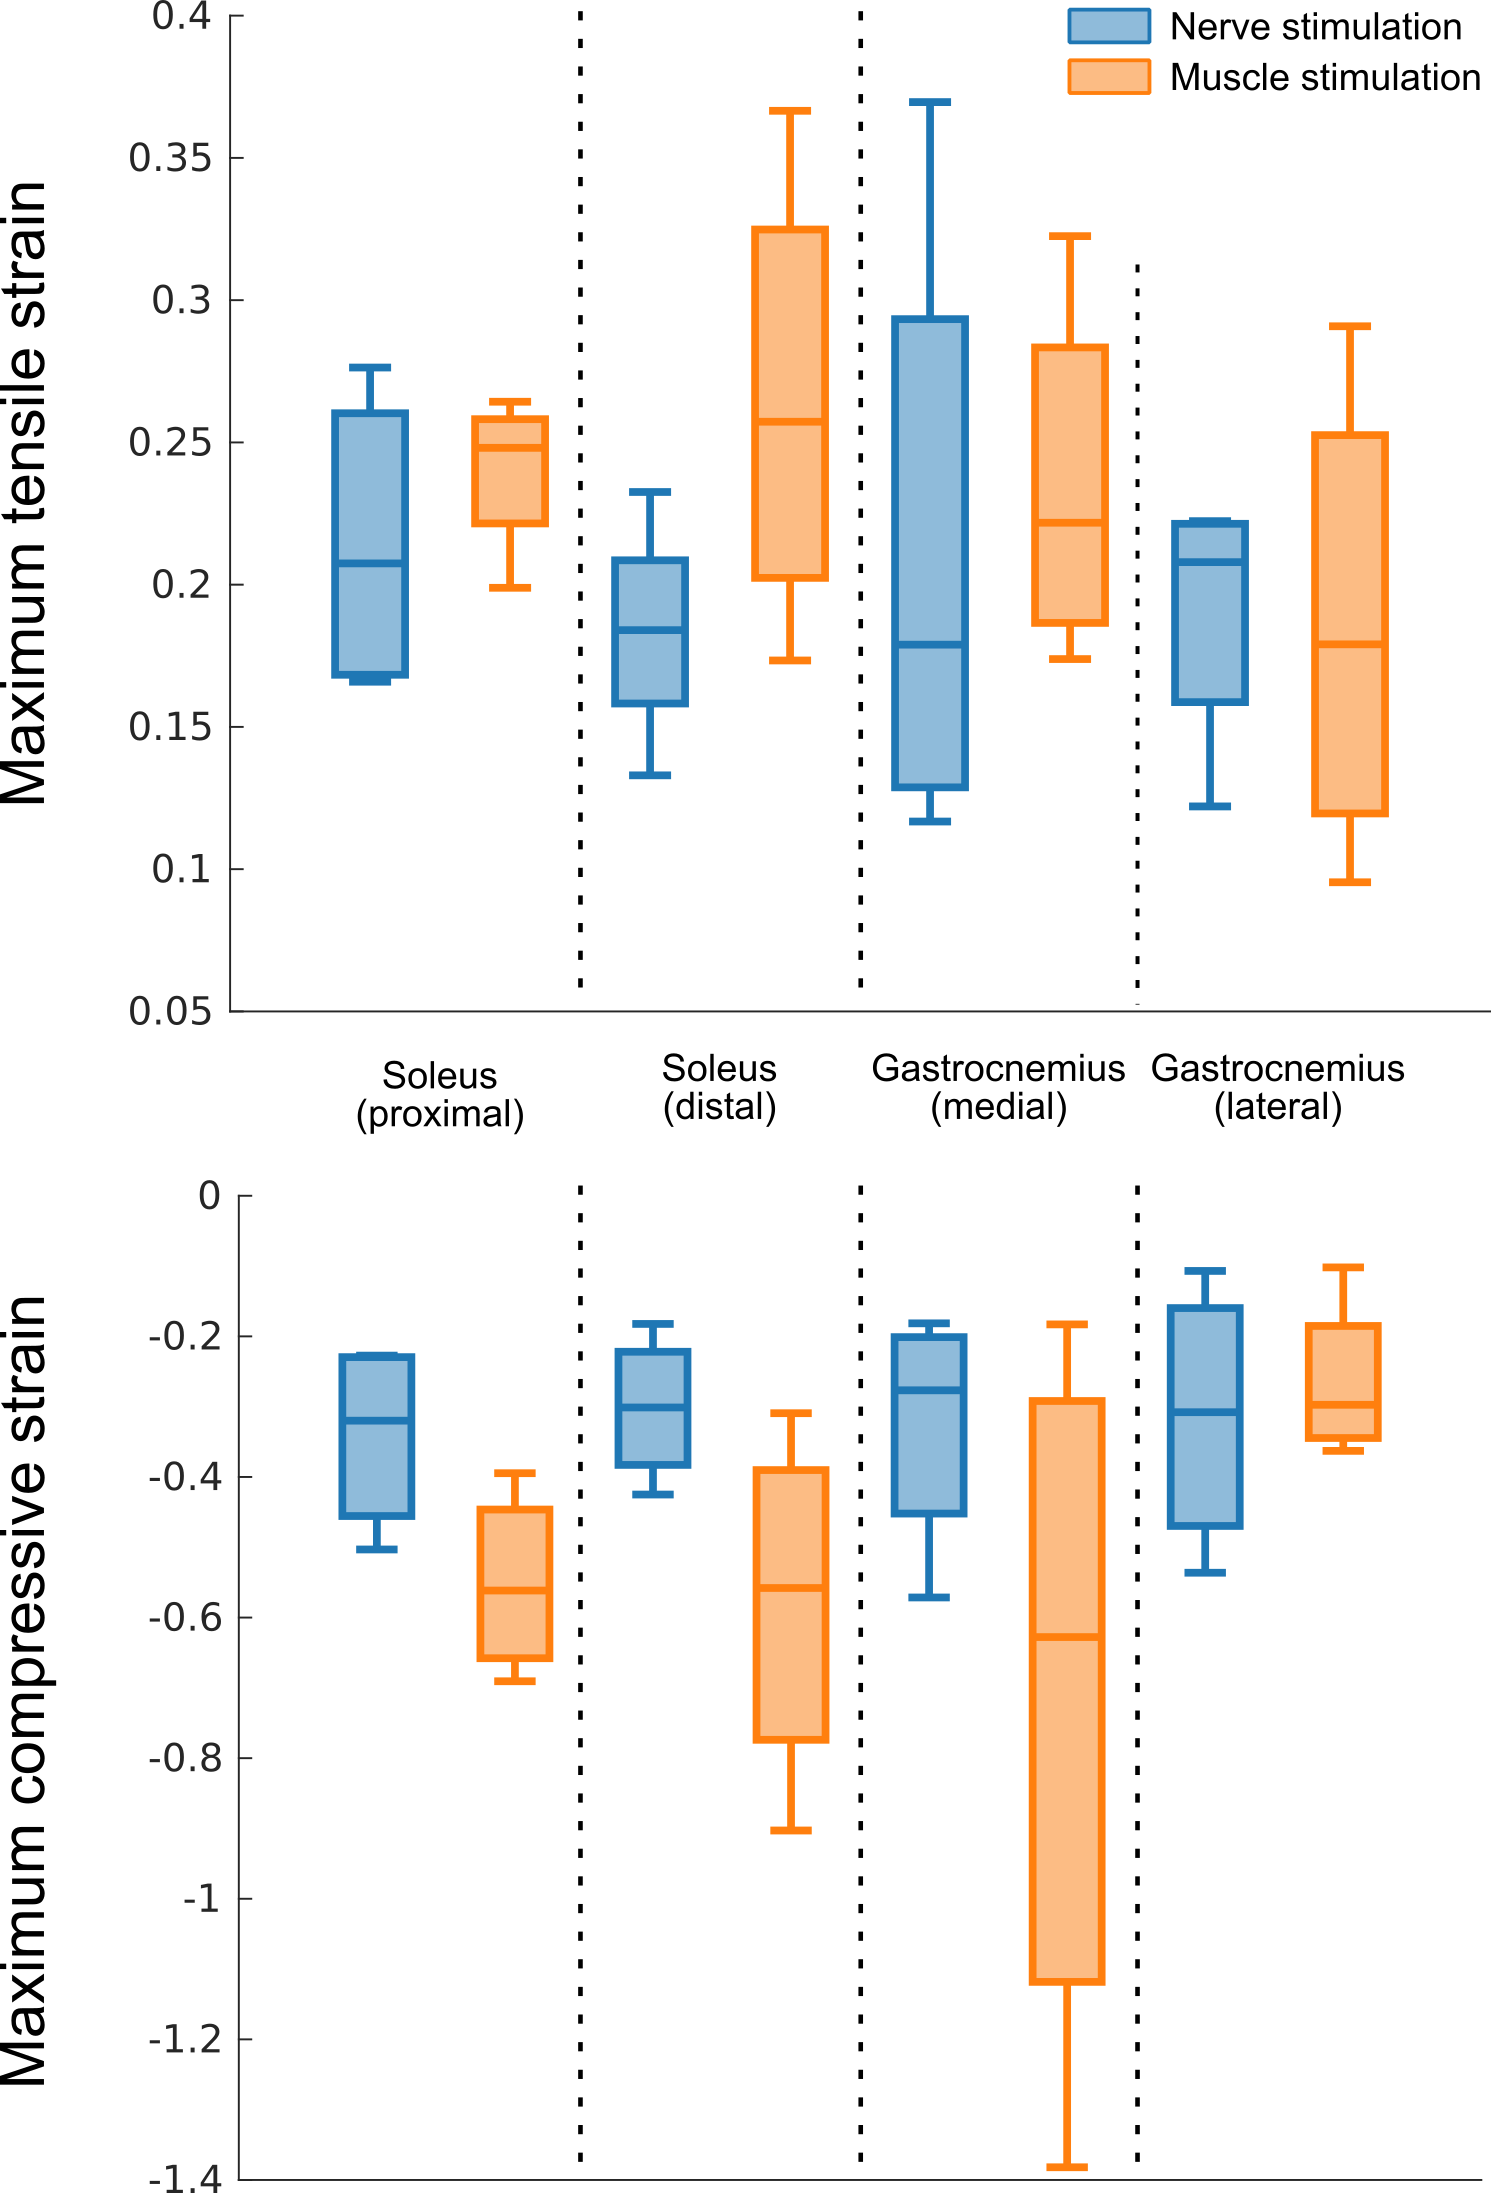
The velocity datasets were subsequently postprocessed offline to calculate the strain at each spatial location throughout the stimulation cycle3. The two principal eigenvalues and eigenvectors of the strain tensor were then visualized as color-coded images, and tensile (positive eigenvalue) and compressive (negative eigenvalue) were calculated over four regions of interest (ROIs) placed in the proximal and distal parts of the soleus muscles, and on the medial and lateral heads of the gastrocnemius. Maximum tensile and compressive strain were extracted for each ROI and stimulation modality.
Results
The qualitative comparison of the contraction maps showed a more inhomogeneous activation during muscle stimulation, with regions of high strain localized close to the electrode placement (Figure 2). The strain in the four ROIs presented a similar time evolution and similar values in case of nerve stimulation, whereas muscle stimulation elicited markedly different strain in the different regions (Figure 3). Overall, nerve stimulation also provided a more gradual response to the stimulus rising in a quasi-linear fashion, whereas the strain curves of the muscle stimulation showed a change in steepness during the contraction phase. Across the volunteers, muscle stimulation generally evoked higher absolute strain values (Figure 4).Discussion
Muscle stimulation evokes a more inhomogeneous activation of the muscles of the triceps surae with respect to nerve stimulation. Probably because of this inhomogeneity, higher strain is necessary to obtain a similar output force, because “strain hotspots” form inside the stimulated muscles. Due to the small sample size, no meaningful statistics analysis was possible, however the results showed a clear and coherent trend across the subjects.Conclusion
4D flow quantification showed that NMES applied through the nerve trunk or through the muscle belly affect the contraction pattern at both spatial and temporal levels, and therefore can be a useful method to provide insights into the physiological mechanisms underlying NMES-induced contraction.Acknowledgements
This work was supported by the Swiss National Science Foundation (grant Nr. 172876).References
1. Neyroud D, Grosprêtre S, Gondin J, Kayser B, Place N. Test–retest reliability of wide-pulse high-frequency neuromuscular electrical stimulation evoked force. Muscle & Nerve 2018;57:E70–E77 doi: 10.1002/mus.25747.
2. Maffiuletti NA. Physiological and methodological considerations for the use of neuromuscular electrical stimulation. Eur J Appl Physiol 2010;110:223–234 doi: 10.1007/s00421-010-1502-y.
3. Bergquist AJ, Clair JM, Collins DF. Motor unit recruitment when neuromuscular electrical stimulation is applied over a nerve trunk compared with a muscle belly: triceps surae. J. Appl. Physiol. 2011;110:627–637 doi: 10.1152/japplphysiol.01103.2010.
4. Santini F, Bieri O, Deligianni X. OpenForce MR: A Low-Cost Open-Source MR-Compatible Force Sensor. In: Proc. Intl. Soc. Mag. Reson. Med. 26 (2018). Paris (France); 2018.
5. Deligianni X, Pansini M, Garcia M, et al. Synchronous MRI of muscle motion induced by electrical stimulation. Magn Reson Med 2017;77:664–672.
6. Liang D, Liu B, Wang J, Ying L. Accelerating SENSE using compressed sensing. Magn Reson Med 2009;62:1574–1584 doi: 10.1002/mrm.22161.
7. Liu J, Rapin J, Chang T, et al. Dynamic cardiac MRI reconstruction with weighted redundant Haar wavelets (abstr). Proc Int Soc Magn Reson Med 2012;67.
Figures