1273
The relation between fat calibration in multi-echo spin-echo water T2 mapping and STEAM fat T2 relaxation measurements1Department of Radiology, University medical center utrecht, Utrecht, Netherlands, 2Institute of Cellular Medicine, Newcastle University, Newcastle, United Kingdom, 3Department of Neurology BG, University Hospital Bergmannsheil, Ruhr-University Bochum, Bochum, Germany, 4Dept of Radiology, C.J. Gorter Center for High Field MRI, Leiden University Medical Center, Leiden, Netherlands
Synopsis
The aim of this study was to quantitatively describe the relation between fat calibration in ME-SE water T2 mapping and STEAM fat T2 relaxation measurements in spectroscopy using j‑coupling simulations and investigate its effect on EPG water T2 mapping. Both ME-SE and STEAM T2 mapping methods to estimate the apparent fat T2 relaxation times are heavily influenced by J-coupling. As such the measured T2 relaxation time of fat using STEAM, appears shorter and using ME-SE appears longer, ranging between values of 30 and 140 ms.
Introduction
Estimation of water T2 relaxation time is an important tool to assess inflammation/edema (1) in muscular dystrophies. However, fat infiltration of muscle tissue is a major hallmark of the disease process. As fat has a much longer T2 relaxation time than water, this has to be taken into account (2, 3). In extended phase graph (EPG) based fitting of water T2 in muscle (2) using a multi-echo spin-echo (ME-SE) acquisition, the apparent fat T2 is estimated from a mono-exponential fit of subcutaneous fat and then fixed. However, the value observed (~140ms, (2)) is much higher than that of fat measured with STEAM spectroscopy (40 to 75ms , (4)), which is likely due to j-coupling (5, 6). Furthermore, fat contains a small (~8%, (7)) fraction of water, which could indicate that a biexponential model could be better for estimating fat T2 . The aim of this study was 1) to determine if j-coupling can explain the differences in apparent fat T2 between fat calibration in ME-SE water T2 mapping and STEAM fat T2 relaxation measurements in spectroscopy and 2) what the effect is of the residual water signal.Methods
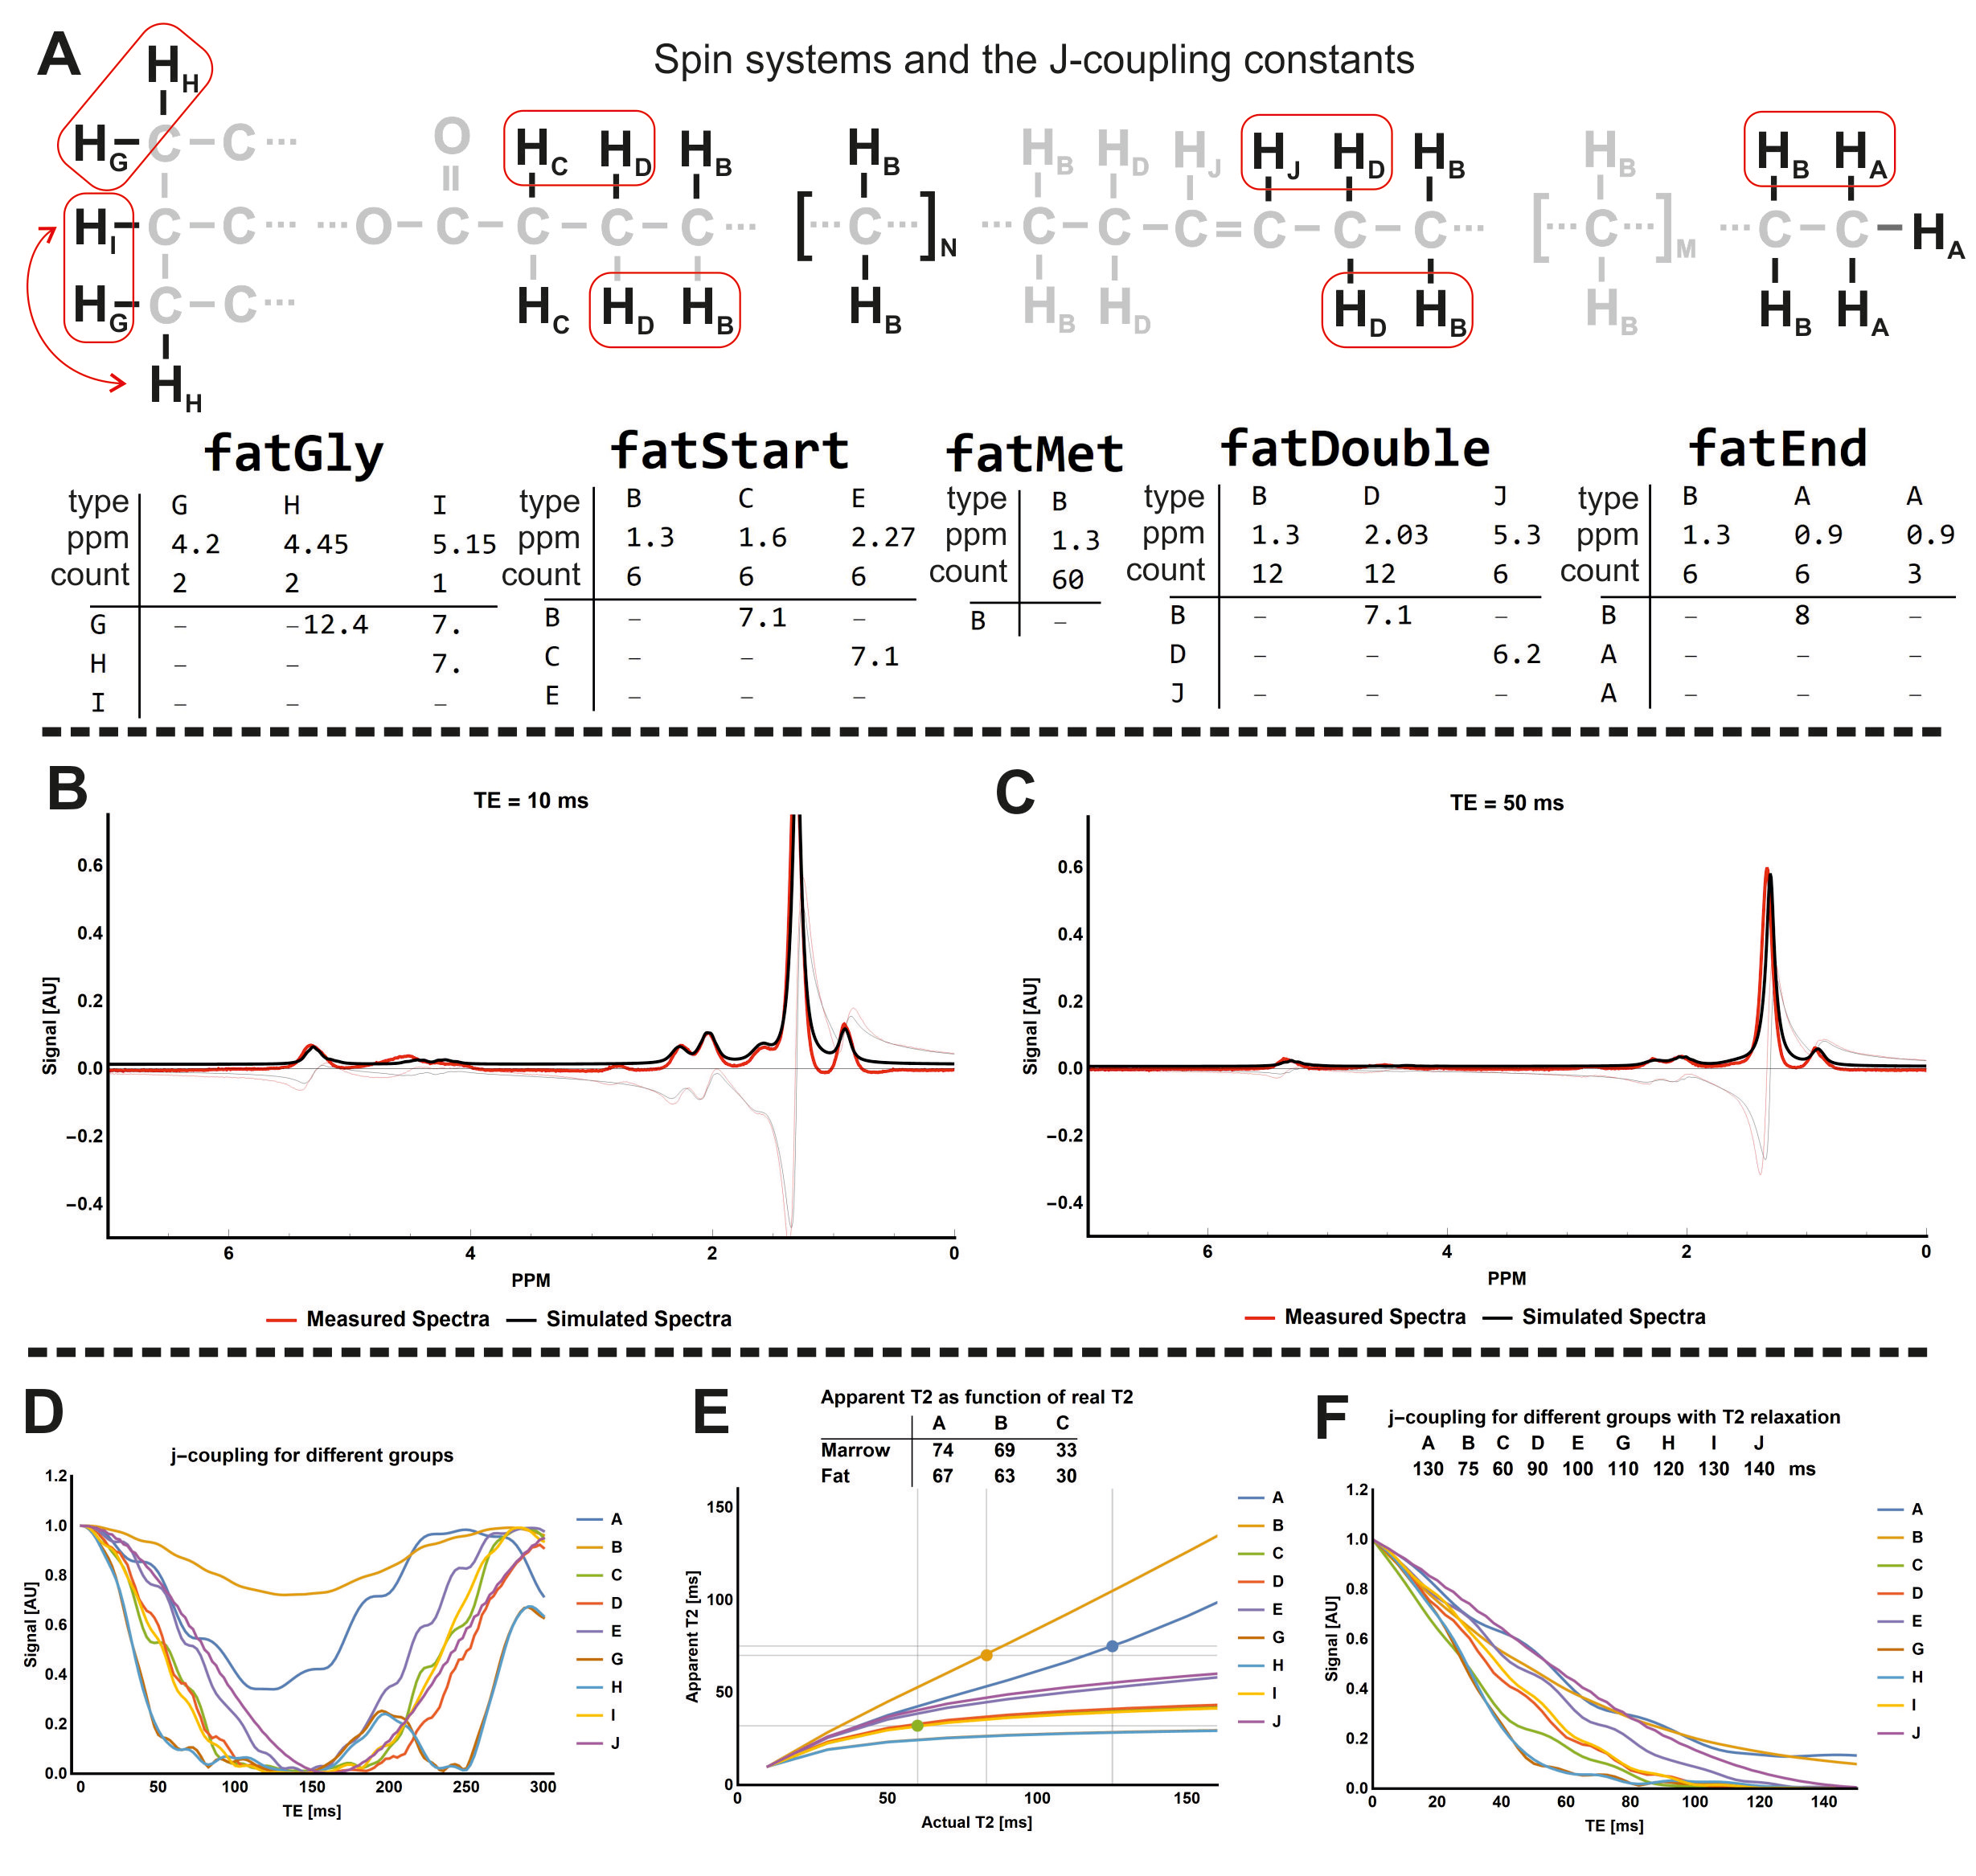
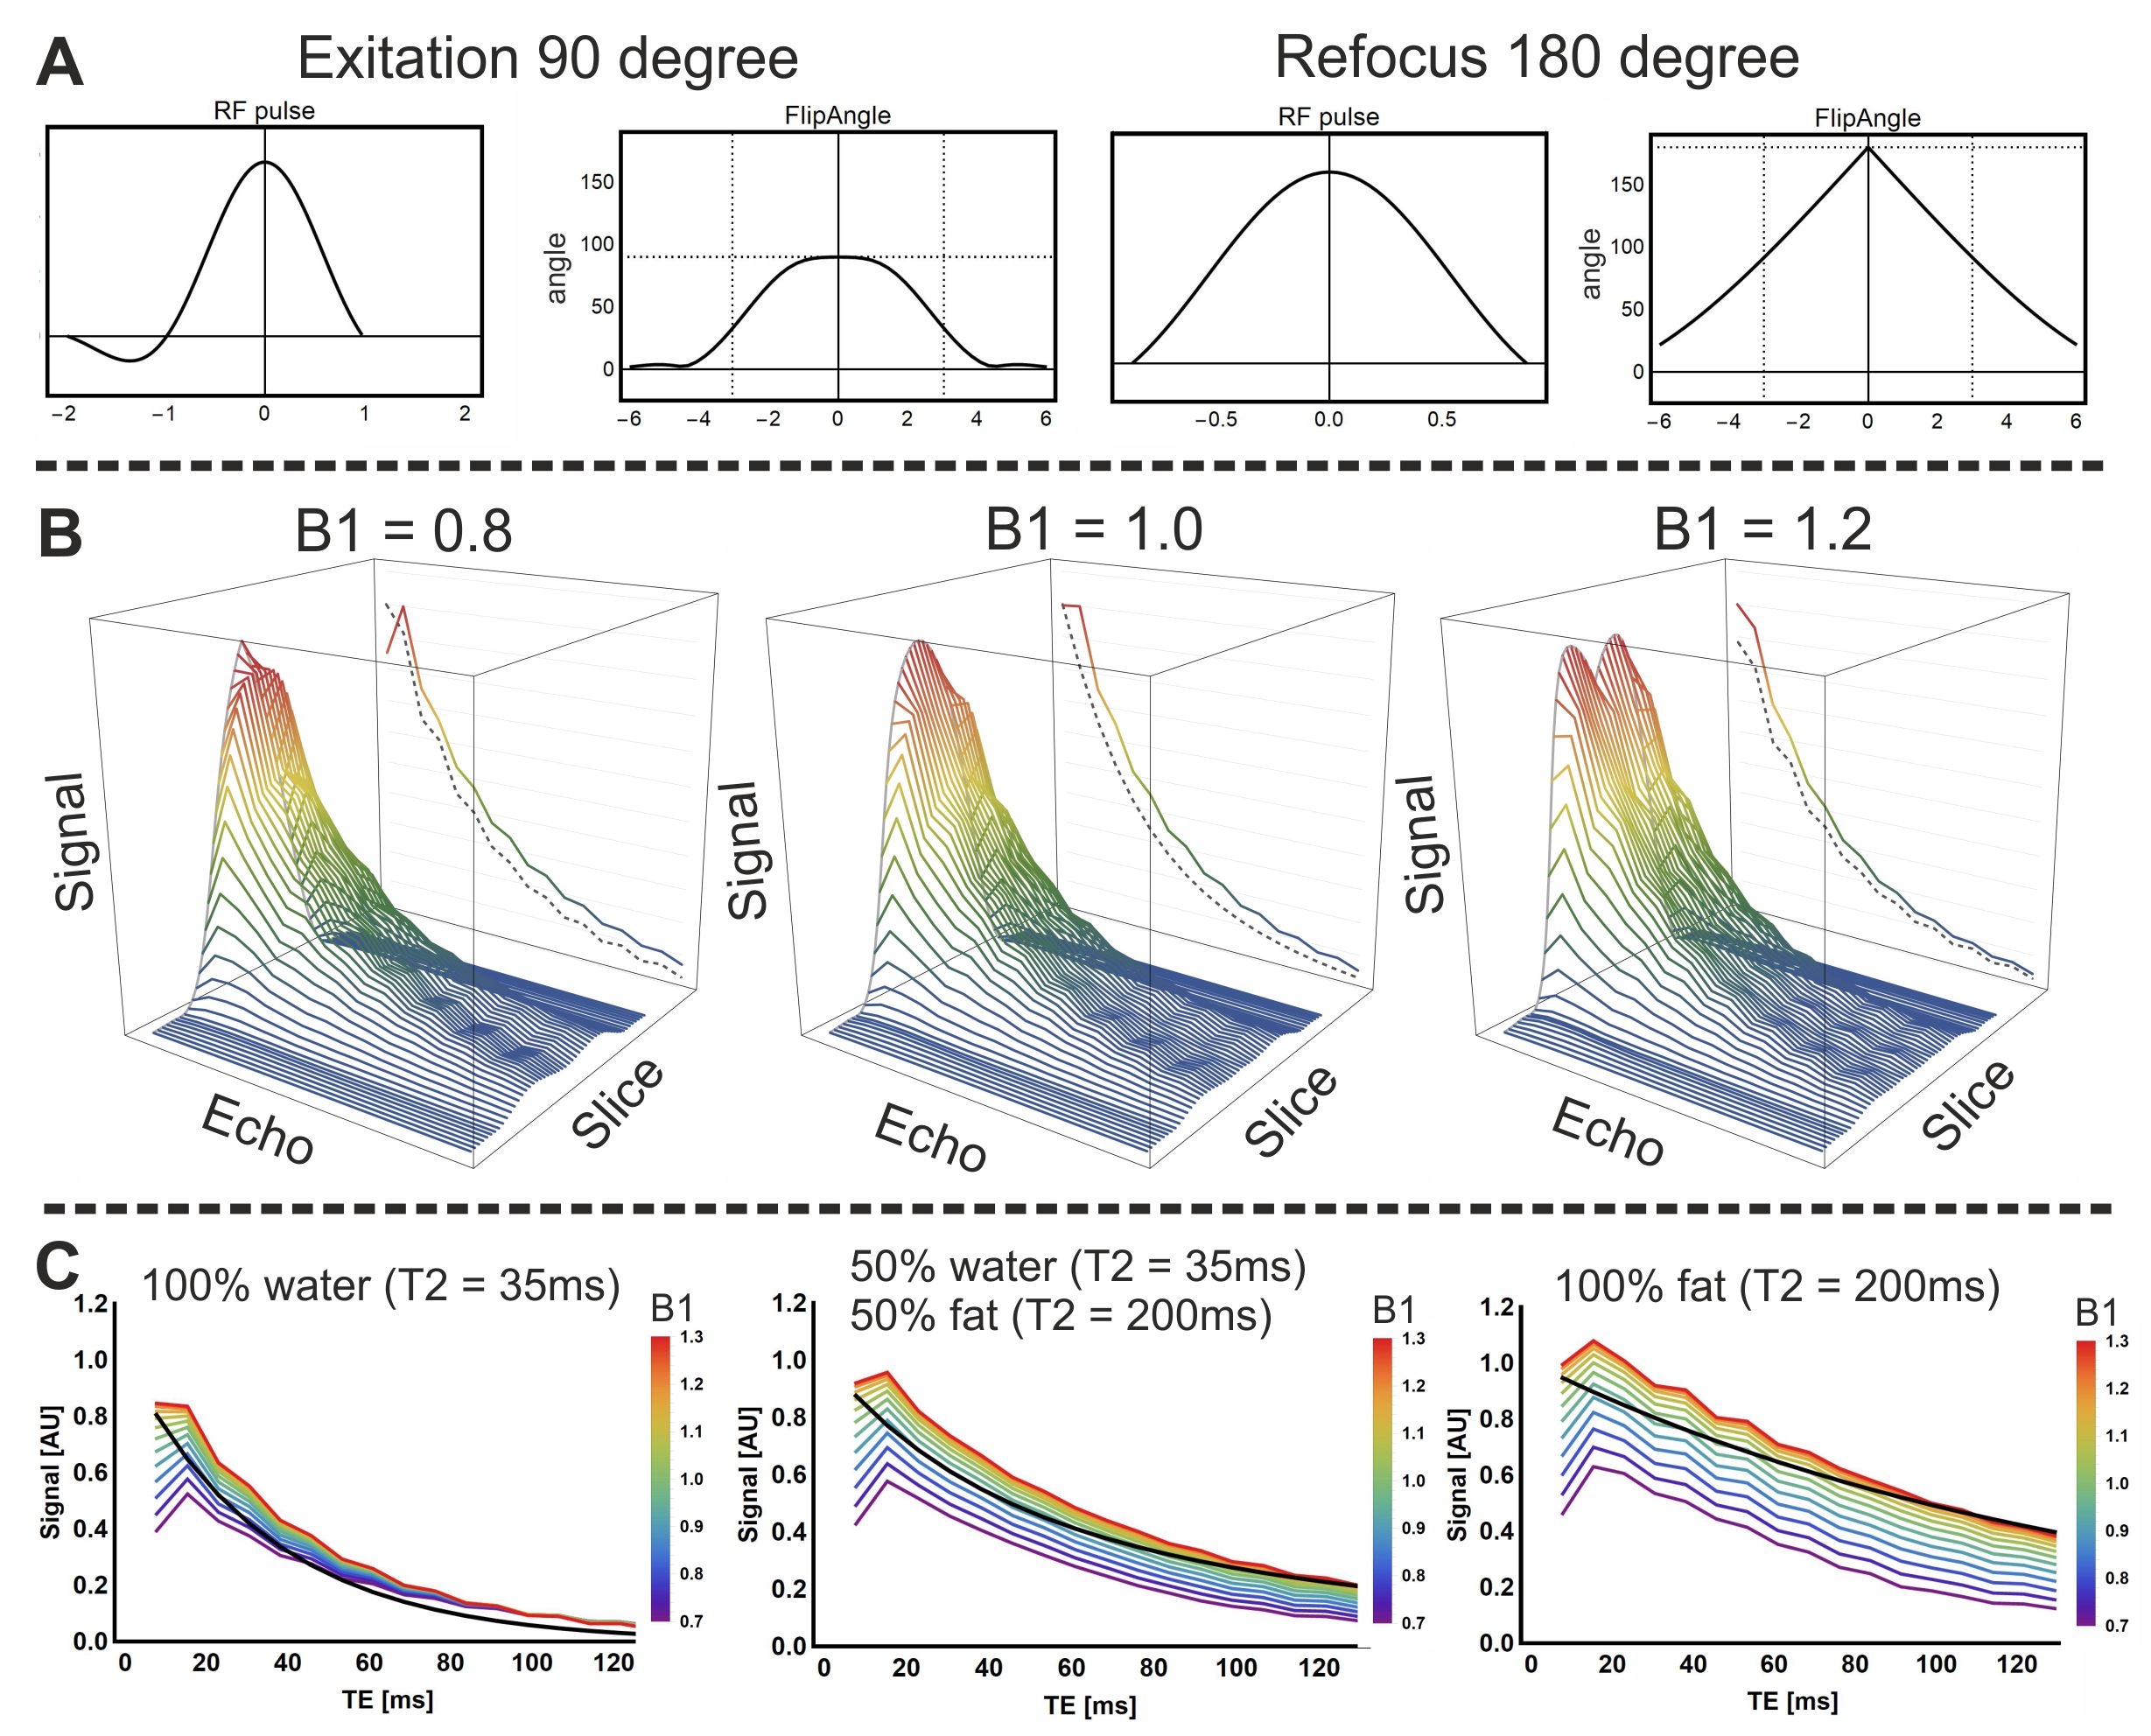
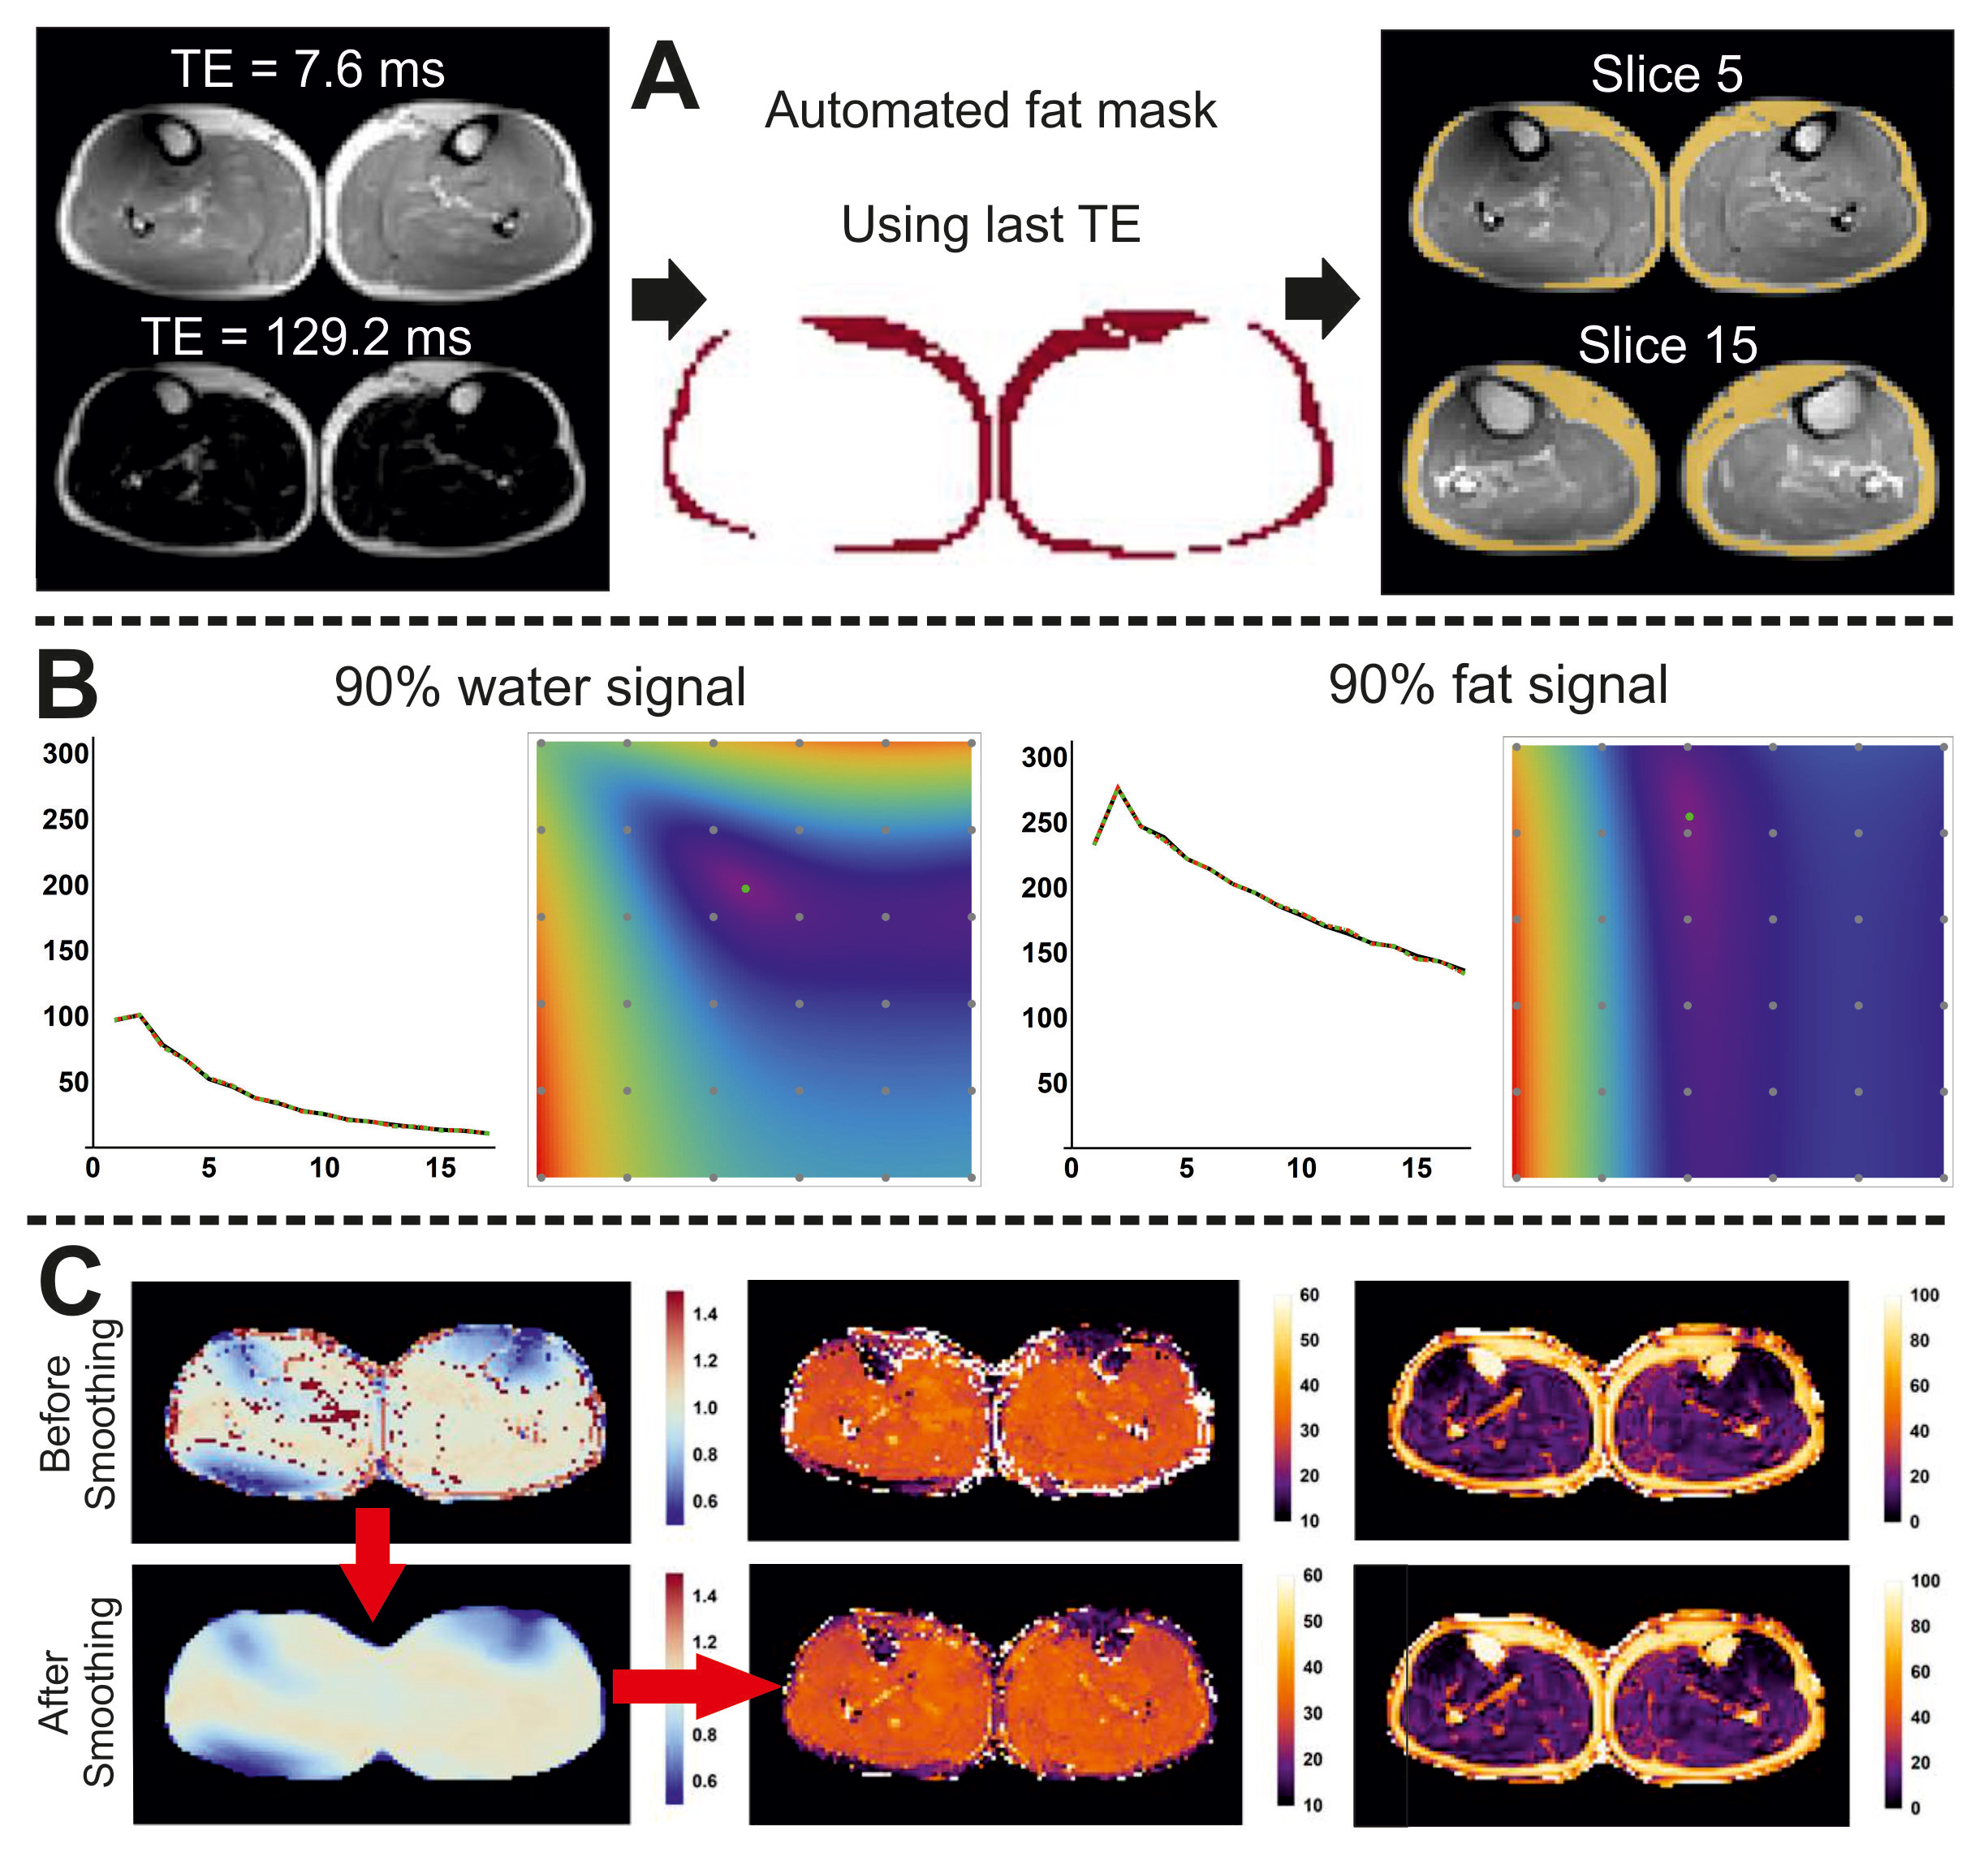
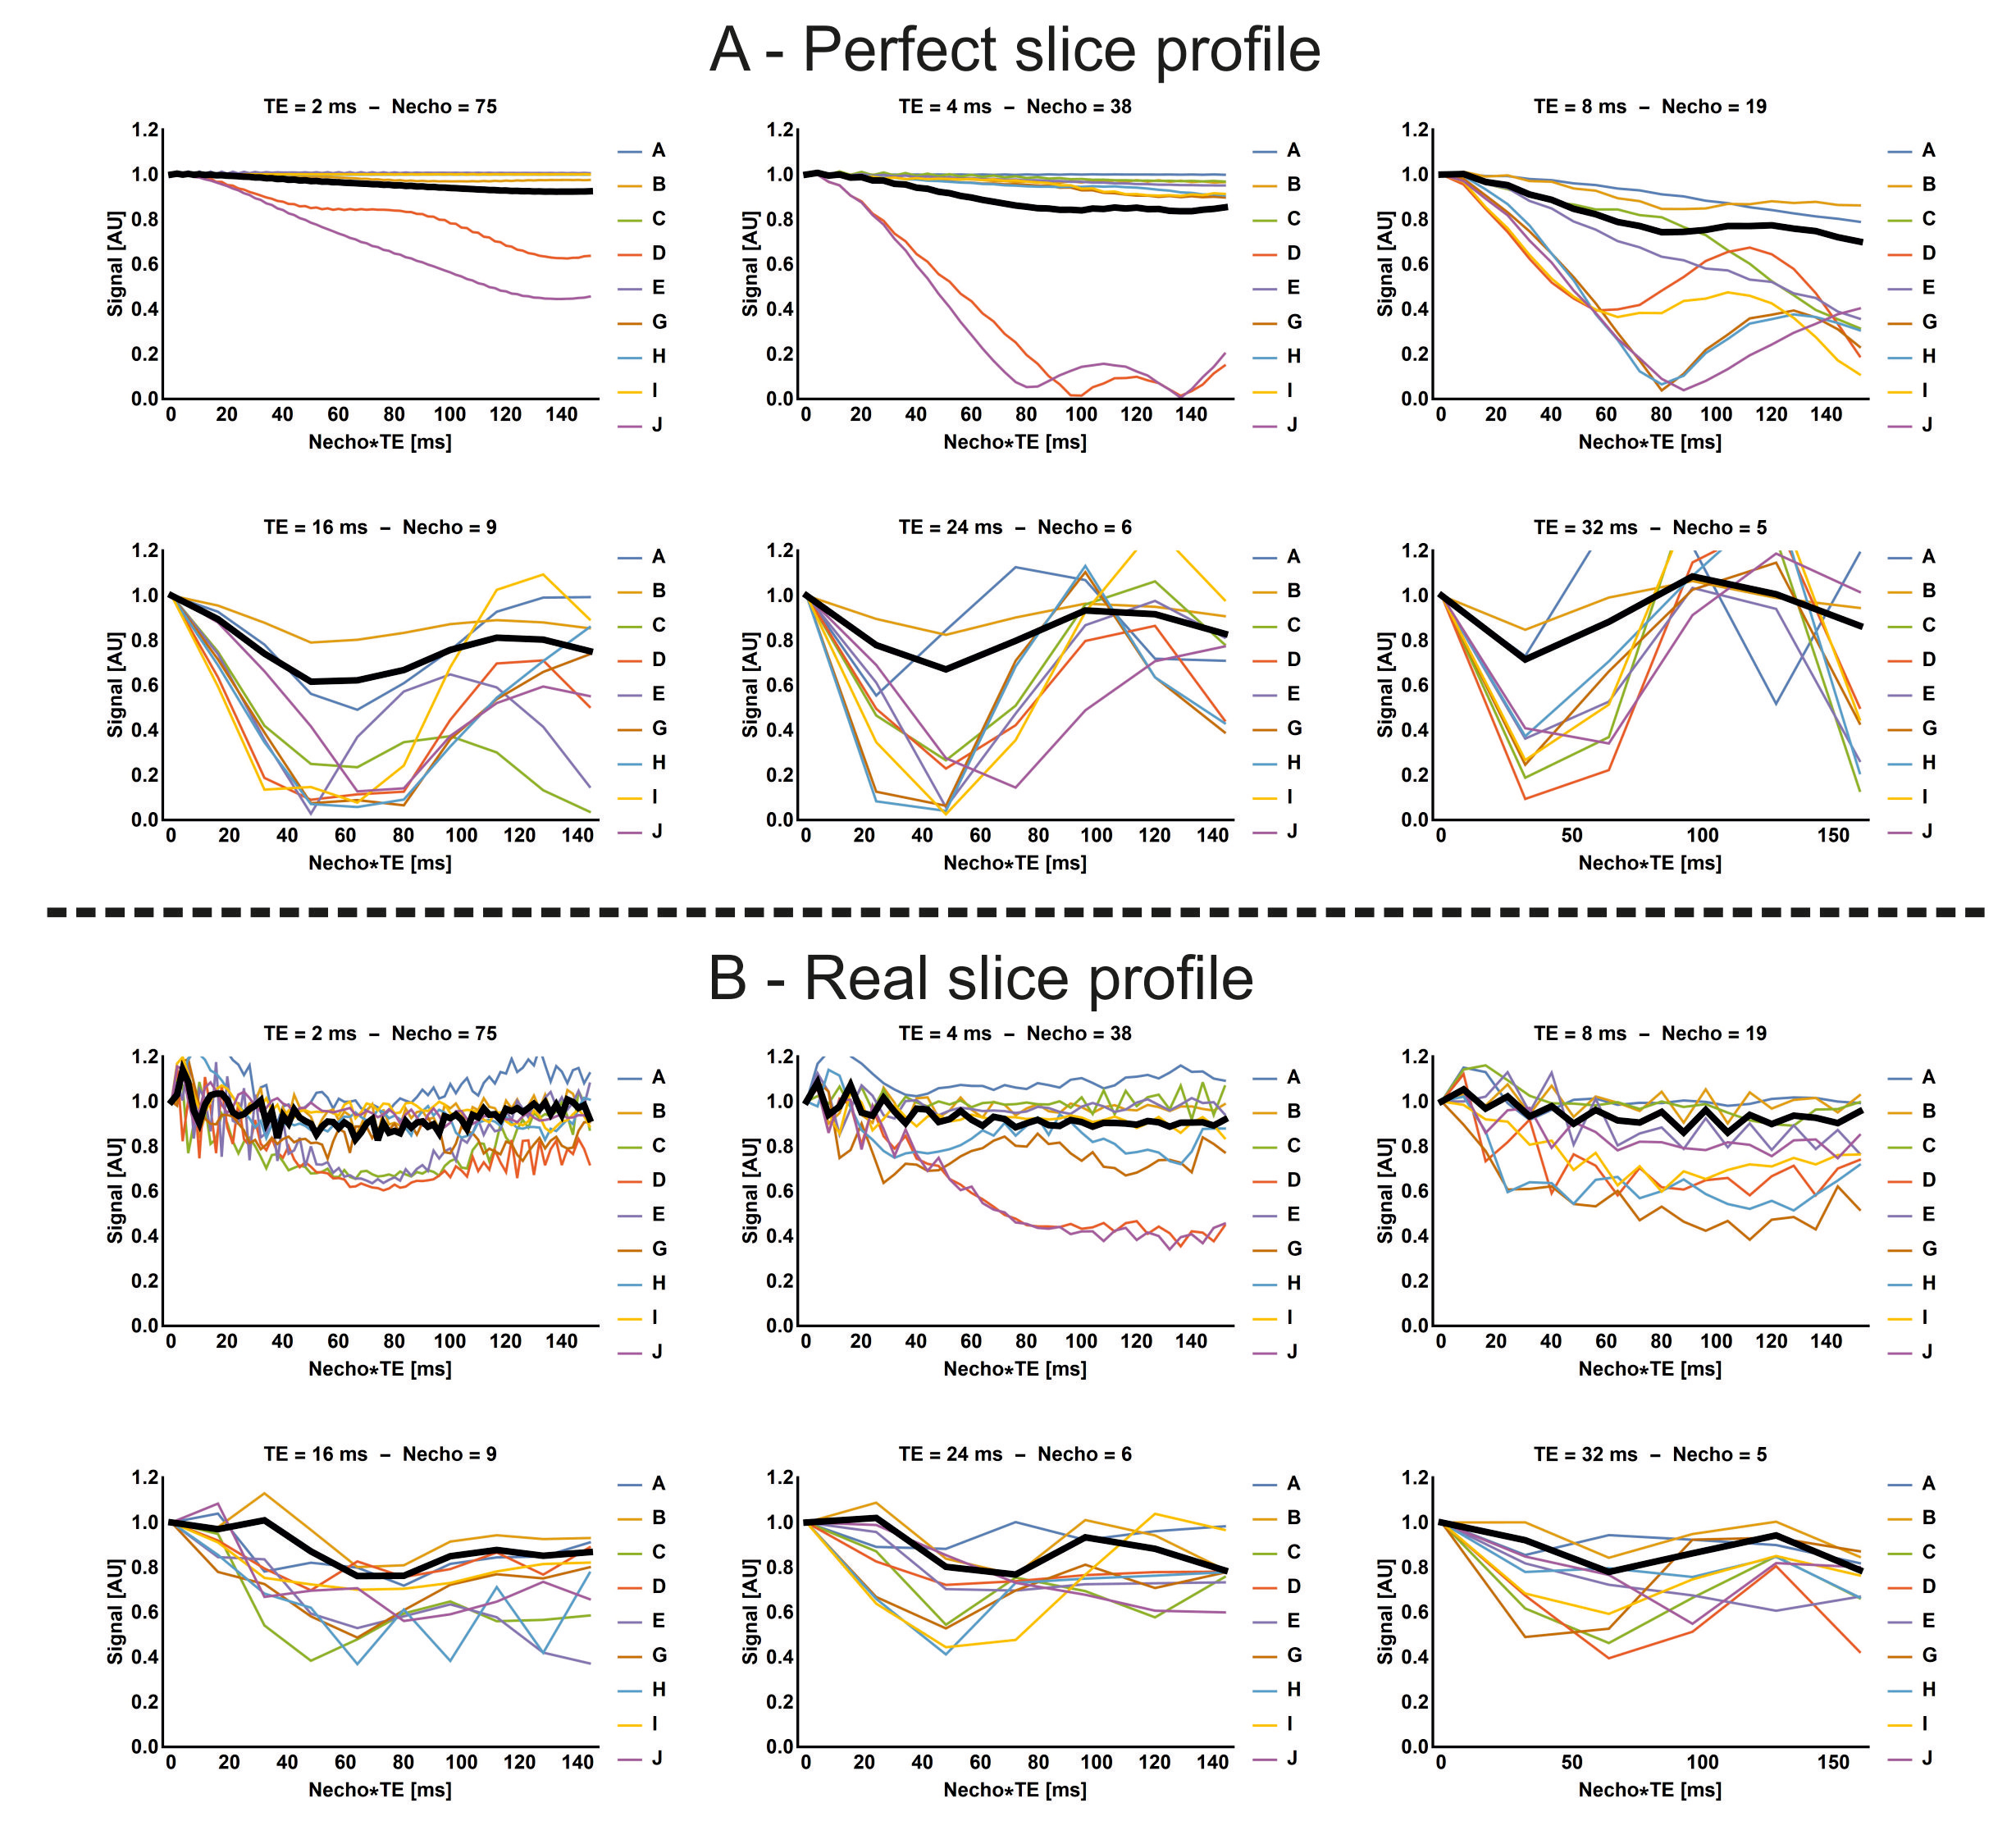
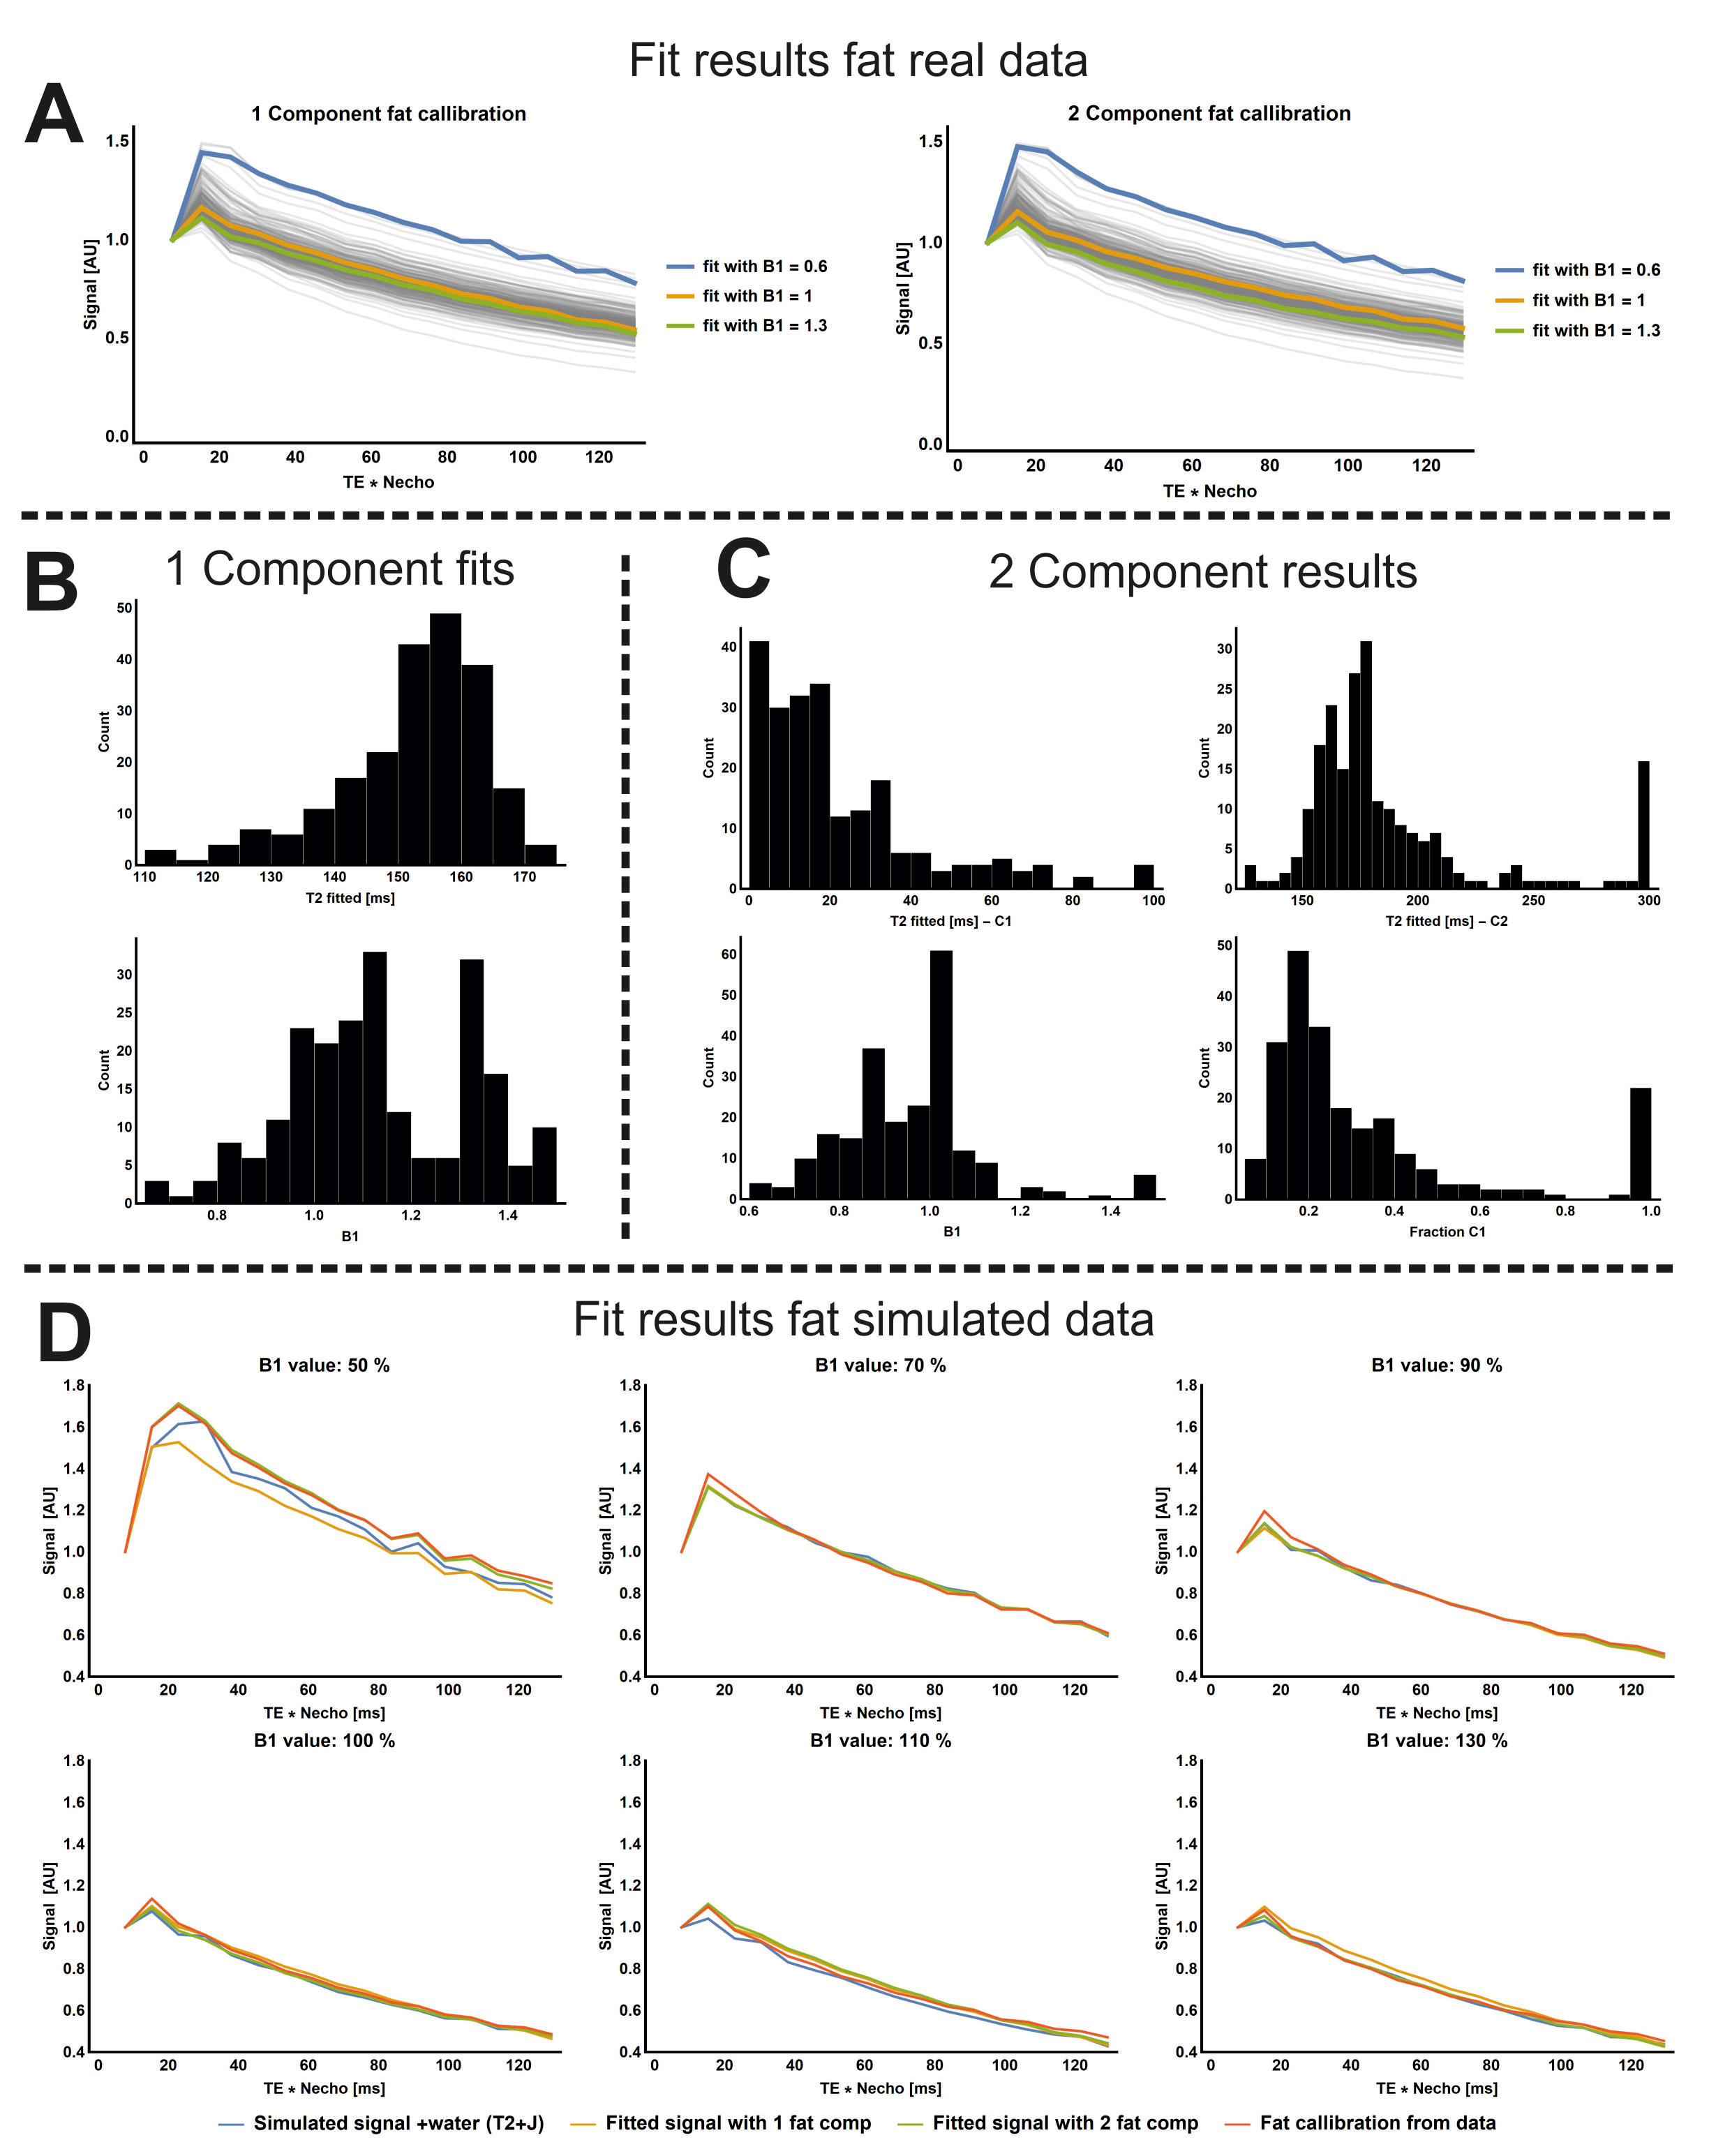
J-coupling simulations using the full Hamiltonian were performed in Mathematica using custom scripts based on FID-A (github.com/CIC-methods/FID-A). The large spin system was cut up into small parts (8) accounting for the relative weights of all protons (see Fig. 1A). The STEAM sequence was simulated including gradients (9). Assumptions for T2s for the methyl(ene) peaks were 130 and 80 ms (10) and between 60 and 140ms for the other peaks . The ME-SE sequence was simulated using EPG representation (11), including the slice profile (12) using Bloch simulations (13) (see Fig. 2B). As B1 effects are symmetric around B1=1 for the 180-degree pulse, but not for the 90-degree pulse (see Fig. 2C), both have to be considered. ME‑SE multi echo acquisitions were acquired bilaterally in three healthy subjects (2.5x2.5x5 mm3 TE=7.6ms; 17 echos) together with STEAM spectra in subcutaneous fat (TE=10-100ms, TM=16ms) to estimate the water T2 in muscles. The EPG based water T2 estimation was performed using a dictionary method (2) with the addition of automated fat selection and B1 smoothing. After the dictionary fit was performed the B1 maps ware filtered using a low pas filter after which the water T2 was estimated using this fixed smooth B1 value (see Fig. 3).Results
With the assumed fat T2 relaxation and J-coupling constants it was possible to simulate the STEAM acquisition of subcutaneous fat (see Fig 1B). For most fat peaks the J-coupling causes the apparent T2 to be restricted to 50ms at max (see Fig 1C), Simulations of J-coupling in the MESE acquisition are shown in Fig 4. At short TE the effect of J-coupling is reduced (14) and signal evolution based on J-coupling results in a fast, initial decay after which the signal ends up in a steady state . EPG fits of the apparent fat T2 relaxation in subcutaneous fat are shown in Fig 5 using both a one and two compartment model. Both give similar relaxation curves and accurately describe the measured signal. Comparisons of ME-SE simulations with T2 and J-coupling for various B1 values are in excellent agreement with the measured signals (Fig 5C). The EPG fit of water T2 relaxation in the soleus muscle of three subjects (31.0, 28.6, and 30.1ms) agreed with spectroscopy measurements of water T2 relaxation in the same region (28.1, 28.4, and 28.7ms respectively).Discussion and conclusion
As is known both ME-SE and STEAM T2 mapping methods to estimate the apparent fat T2 relaxation times are heavily influenced by J-coupling. As such the measured T2 relaxation time of fat using STEAM, appears shorter and using ME-SE appears longer, ranging between values of 30 and 140 ms which agrees with most literature (4). Most importantly the relation between apparent T2 fat measurements with and without J-coupling can be explained, e.g. the methyl(ene) groups have an apparent T2 of ~70ms while the real T2s are 80 and 130ms (4, 10). Incorporation of the effect of J‑coupling into the EPG fitting method might allow to more accurately describe the apparent T2 of fat and could potentially improve the robustness of measuring water T2. For now, accurate water T2 mapping in muscle can be achieved by including the apparent fat T2 estimated from subcutaneous fat using a one compartment EPG model. With this calibrated fat T2 and EPG fitting water T2 resembles that measured with STEAM spectroscopy.Acknowledgements
No acknowledgement found.References
1. Hollingsworth KG: Quantitative MRI in muscular dystrophy: An indispensable trial endpoint? Neurology 2014; 83:956–7.
2. Marty B, Baudin PY, Reyngoudt H, et al.: Simultaneous muscle water T2and fat fraction mapping using transverse relaxometry with stimulated echo compensation. NMR Biomed 2016; 29:431–443.
3. Wokke BH, van den Bergen JC, Versluis MJ, et al.: Quantitative MRI and strength measurements in the assessment of muscle quality in Duchenne muscular dystrophy. Neuromuscul Disord 2014; 24:409–416.
4. Ren J, Dimitrov I, Sherry AD, Malloy CR: Composition of adipose tissue and marrow fat in humans by 1H NMR at 7 Tesla. J Lipid Res 2008; 49:2055–62.
5. Hardy PA, Henkelman RM, Bishop JE, Poon ECS, Plewes DB: Why fat is bright in rare and fast spin-echo imaging. J Magn Reson Imaging 1992; 2:533–540.
6. Stokes AM, Feng Y, Mitropoulos T, Warren WS: Enhanced refocusing of fat signals using optimized multipulse echo sequences. Magn Reson Med 2013; 69:1044–1055.
7. Thomas LW: The chemical composition of adipose tissue of man and mice. Q J Exp Physiol Cogn Med Sci 1962; 47:179–188.
8. Castillo AM, Patiny L, Wist J: Fast and accurate algorithm for the simulation of NMR spectra of large spin systems. J Magn Reson 2011; 209:123–130.
9. Thompson RB, Allen PS: Response of metabolites with coupled spins to the STEAM sequence. Magn Reson Med 2001; 45:955–965.
10. Yahya A, Fallone BG: T2 determination of the J-coupled methyl protons of lipids: In vivo ilustration with tibial bone marrow at 3 T. J Magn Reson Imaging 2010; 31:1514–1521.
11. Weigel M: Extended phase graphs: Dephasing, RF pulses, and echoes - pure and simple. J Magn Reson Imaging 2015; 41:266–295.
12. Lebel RM, Wilman AH: Transverse relaxometry with stimulated echo compensation. Magn Reson Med 2010; 64:1005–1014.
13. McPhee KC, Wilman AH: Transverse relaxation and flip angle mapping: Evaluation of simultaneous and independent methods using multiple spin echoes. Magn Reson Med 2017; 77:2057–2065.
14. Stables LA, Kennan RP, Anderson AW, Gore JC: Density Matrix Simulations of the Effects of J Coupling in Spin Echo and Fast Spin Echo Imaging. J Magn Reson 1999; 140:305–314.
Figures