1272
Simulation based study of the effect of sub-voxel spatial distribution of permeability of muscle fibres as a function of diffusion time and b-value using a finite element model1National Physical Laboratory, Teddington, United Kingdom, 2UCL GOS Institute of Child Health, London, United Kingdom
Synopsis
We investigate the effect of the sub-voxel patterning of permeability in muscle tissue on the diffusion signal via a finite element simulation of diffusion MRI on a model of muscle tissue. We observe that permeability with a disordered pattern leads to statistically significant differences in diffusion signal at high b and longer diffusion times.
Introduction
Diffusion MRI measurements are known to contain information about the micro-environment experienced by diffusing spins. There has been considerable interest in using diffusion as a probe of microstructure in the brain, particularly in white matter,1 and in muscle.2 Muscle tissue differs markedly from white matter – fibres are larger, and have a hierarchical structure 3 which means their diffusion properties are different. In particular, diffusion in muscle tissue is known to exhibit a strong time dependence.4
Duchenne muscular dystrophy (DMD) is a genetic muscle wasting condition affecting approximately 1 in 3600 boys.5 DMD pathology causes progressive muscle loss and is invariably fatal.6 DMD tissue is often imaged for fat-fraction, but replacement of muscle with fat is the end stage of the pathology, and this has driven interest in new methods which are sensitive to earlier stage microstructural changes. Diffusion MRI is one such approach.
Recent simulation-based investigation of DMD pathology revealed that changes in permeability have a large effect on the diffusion signal.7 DMD is known to cause increased permeability of muscle fibres. Changes in permeability are not uniform across space, however. Permeable fibres are spatially randomly distributed and histological evidence for permeability changes reminiscent of a percolation cluster has been reported.8
The effect of spatial distribution of permeability on the diffusion signal has not been extensively studied. Previous simulation-based investigations typically considered permeability as a uniform change across tissue. This work calculates the diffusion signal as a function of diffusion time and b-value in models of permeable muscle tissue in two scenarios: one where permeability is changed uniformly across the tissue, and another in which barriers are permeable or impermeable randomly across the tissue. In both cases the total expected flux across all barriers is the same. We find that permeability pattern does affect diffusion signal, although in a b-value regime which is currently only accessible on preclinical hardware.
Methods
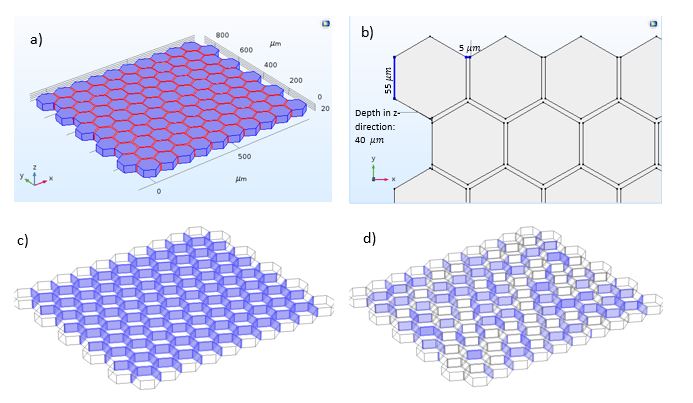
We generate synthetic pulsed gradient spin-echo (PGSE) diffusion-weighted signal curves over a wide range of scan parameters using a Finite Element Method (FEM) to numerically solve the Bloch-Torrey equations for spins in muscle tissue excited via a synthetic PGSE sequence, and integrate over the sample volume to compute the diffusion-weighted signal.9 A hexagonal lattice with a fixed unit cell size was used as a tissue model. Hexagonal cells are separated by a narrow interstitial space with a lower diffusivity. Exchange between the cells and interstitial space was via boundaries with a controlled permeability (fig. 1).
FEM allows efficient handling of different permeability configurations and different diffusivities in the tissue vs. interstitial space. The disordered permeability pattern was created by randomly selecting a fixed fraction of boundaries as permeable (fig. 1d). The probability that a particular boundary is permeable is the percolation probability, pperc. The permeability value of a boundary is hperm. We generate N=16 disordered configurations and average signals from each to reduce disorder in sampling. The uniform case assumes all boundaries are permeable. Total fluxes are matched by setting permeability in the ordered case to hperm*pperc.
FEM simulations were performed using COMSOL Multiphysics™ 5.3a (COMSOL Group, Stockholm, Sweden). Synthetic diffusion-weighted signals were obtained from simulations of both uniform and non-uniform patterns for the gradient strengths of 0.02–0.10 T/m, diffusion times from 50–250 ms, and muscle diffusivity in {1E-9, 1.7E-9 and 2.3E-9} m2/s. Gradient duration was 20 ms, gradients were perpendicular to fibres. Interstitial diffusivity was 2.3E-9 m2/s. Dimensionless reduced permeability was 3.125E-5 and percolation probability was 30%.
Results
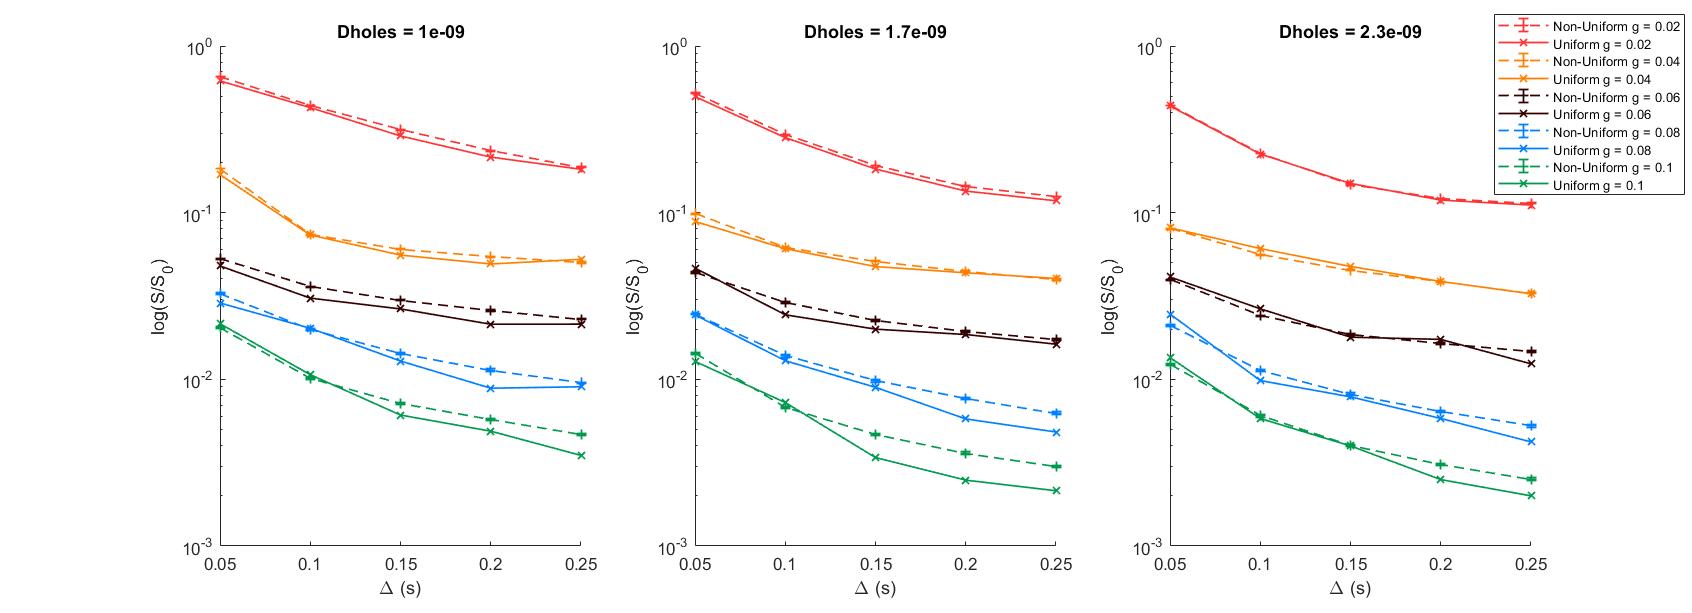
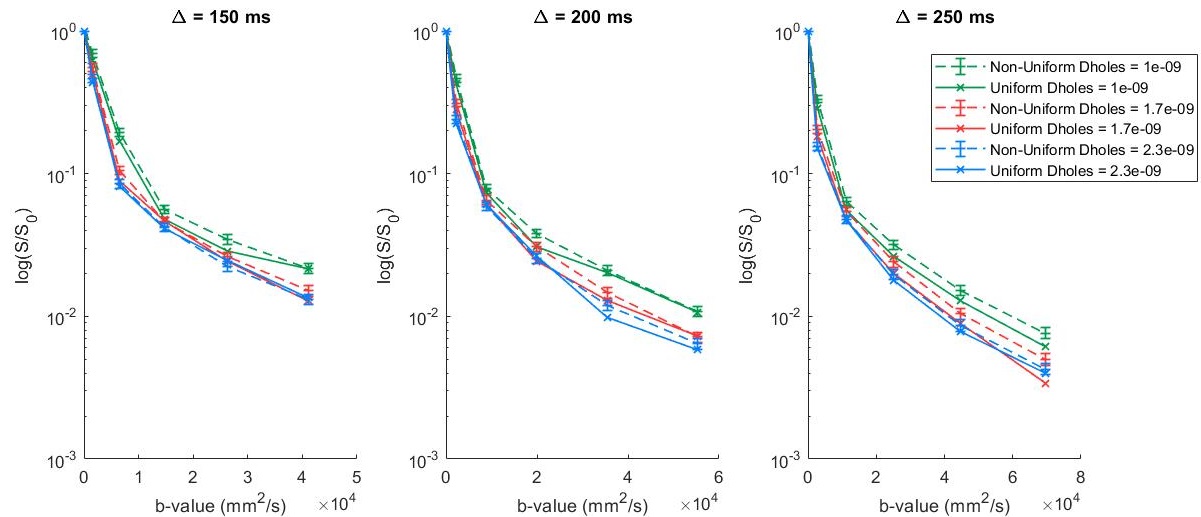
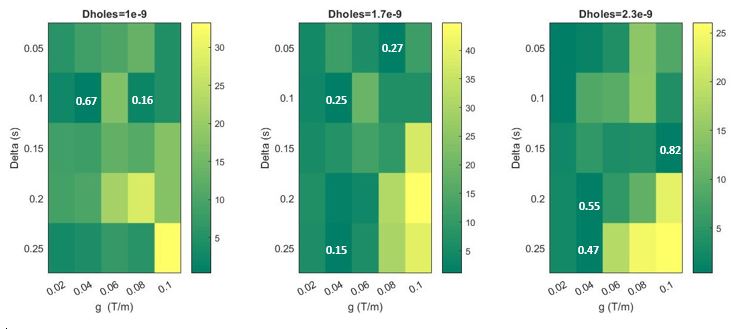
Differences between the signal curves for the uniform and the mean of the non-uniform boundaries patterns became significant at diffusion times of 150 ms and above, and gradient strengths greater than 0.06 T/m (fig. 2), (b-value above 2000 mm2/s -- fig. 3). Differences between curves were most pronounced for diffusivity 1.7E-9 m2/s with differences of more than 40%. A two-tailed Z-test 10 between curves showed most p-values were < 10-5 over this parameter range (fig. 4).Discussion & Conclusion
Sub-voxel distribution of permeability does lead to observable differences in the diffusion signal, supporting the idea that a speckling permeability pattern leads to disorder in the restriction of spins and hence a different decay curve.8 The percentage differences in signals suggest that for clinically accessible b-value and diffusion time ranges, the magnitude of the effect may be too small to observe, but may become apparent on preclinical or ultra-high field human systems.Acknowledgements
This work was funded by the department of Business, Engineering and Industrial Strategy through the Data Science theme National Measurement Strategy programme (DS core Modelling and Analytics – Applications, 121496) and through the Industrial Challenge Strategy Fund project MEDIMIT (120957). MGH is partly supported by a research grant from Great Ormond Street Hospital Biomedical Research Centre.References
[1] Tsien C, Cao Y, Chenevert T. Clinical applications for diffusion magnetic resonance imaging in radiotherapy. Semin Radiat Oncol. 2014;24(3):218-26.
[2] Oudeman J, Mazzoli V, Marra MA, et al. A novel diffusion-tensor MRI approach for skeletal muscle fascicle length measurements. Physiol Rep. 2016;4(24):e13012.
[3] Saladin KS. Anatomy and Physiology, 3rd Ed. New York: Watnik, 2010. p 405–406.
[4] Porcari P, Hall MG, Clark CA, Greally E, Straub V, Blamire AM, The effects of ageing on mouse muscle microstructure: a comparative study of time‐dependent diffusion MRI and histological assessment, NMR in Biomed 2018:13(3):e3881
[5] Bushby K, Finkel R, Birnkrant DJ, Case LE, Clemens PR, Cripe L, Kaul A, Kinnett K, McDonald C, Pandya S, Poysky J, Shapiro F, Tomezsko J, Constantin C. Diagnosis and management of Duchenne muscular dystrophy. Part 1: diagnosis, and pharmacological and psychosocial management. Lancet Neurol 2010;9:77–93.
[6] Emery AEH & Muntoni F, Duchenne Muscular Dystrophy ISBN-10: 9780198515319, ISBN-13: 978-0198515319, OUP Oxford; 3 edition (4 Sept. 2003)
[7] Hall M, Clark C. Diffusion in Hierarchical Systems: A Simulation Study in Models of Healthy and Diseased Muscle Tissue. Magn Reson Med. 2017 Sep; 78(3): 1187-1198.
[8] Straub V, Rafael JA, Chamberlain JS, Campbell KP. Animal models for muscular dystrophy show different patterns of sarcolemmal disruption. J Cell Biol. 1997;139(2):375-85.
[9] Moroney B, Stait-Gardner T, et al. Numerical analysis of NMR diffusion measurements in the short gradient pulse limit. J Magnetic Resonance. 2013; 234:165-175.
[10] Sprinthall, R. C. (2011). Basic Statistical Analysis (9th ed.). Pearson Education. ISBN 978-0-205-05217-2.
Figures