1271
Visualization of Aquaporin 4 using Time-dependent Diffusion MRI in Mouse Skeletal MuscleJunichi Hata1,2,3, Takayuki Obata4, Yasuhiko Tachibana4, Yawara Haga1, Mai Mizumura1, Daisuke Nakashima2, Yasushi Sera2, Masaya Nakamura2, and Hideyuki Okano1,2
1Center for Brain Science, RIKEN, Wako, Japan, 2Keio University, Tokyo, Japan, 3Central Institute for Experimental Animals, Kanagawa, Japan, 4National Institutes for Quantum and Radiological Science and Technology, Chiba, Japan
Synopsis
We focused on aquaporin 4 in skeletal muscle and attempted to visualize its function using time-dependent diffusion magnetic resonance imaging (MRI). In addition, the validity of the muscle cell type characteristics was evaluated by immunostaining. The diffusion time was adjusted with the PG-STE method using a 9.4-T MRI scanner. Diffusivity associated with a difference in the diffusion time was found to differ depending on the skeletal muscle type. Thus, it was possible to visualize the water molecule exchange rate of skeletal muscle cell membranes.
Introduction
Aquaporin (AQP) is a protein expressed on the cell membrane, and it plays a specific role in water molecule permeability(1). AQP4 is strongly expressed in the fibrous membranes of glycolytic fast muscle fibers (type 2a) and oxidized-thawed fast muscle fibers (type 2b), and it promotes water molecule inflow into cells(2). However, there are very few research reports on AQP4. Diffusion-weighted magnetic resonance imaging (dMRI) may be able to provide functional measurements for AQP4. Macroscopic diffusion metrics obtained with dMRI(3) are sensitive to nominally invisible micron-level sample architecture owing to the diffusion length, i.e., the rms molecular displacement L(t) = (δx2(t))1/2, providing the mesoscopic length scale. The dynamical exponent associated with the time dependence of the diffusion coefficient can distinguish mesoscopic structural complexity.Methods
The measurement objects were the lower legs of mice (C57BL/6, 12 weeks, n = 6) and phantoms with known pore diameters (6, 25, 50, and 100 µm; Hamamatsu Photonics K.K., Japan). The imaging range was the area around the greatest diameter of the lower leg. MRI was performed using a 9.4-T MRI scanner (BioSpec 94/30; Bruker BioSpin, Ettlingen, Germany) and a cryogenic four-channel surface probe (Bruker BioSpin). We used the pulsed gradient stimulated-echo pulse sequence. The imaging parameters were as follows: repetition time/echo time, 4,000/12.6 ms; Δ/δ, 101.2–1001.2/3.6 ms (six steps); output b-values, 1,000 and 2,000 s/mm2; field of view, 100 × 100 µm2; pixel resolution, 300 × 300 µm; slice thickness, 1 mm; motion probing gradient moment, six axes. To determine the anatomical locations of the skeletal muscles, fast spin-echo T2-weighted imaging was performed. Mrtrix3 open-source software (http://www.mrtrix.org/) was used for diffusion tensor analysis. For water permeability evaluation(4,5), linear function f(x) = b / (x^a) + c was applied to the acquisition mean values at each diffusion time to determine the best-fitting curves(6). For histological/immunological analysis, the lower legs of the mice were stained with several stains (BA-D5, SC-71, BF-F3, and AQP4) to observe muscle cell type, using the frozen-section method. This study was approved by the local animal experiment committee and was conducted in accordance with the Guidelines for Conducting Animal Experiments of the Riken Center for Brain Science.Results
The AQP4 expression on immunostaining differed among the muscle types. It was only expressed in fast muscles (types 2a and 2b) and was not expressed in slow muscles (type 1) (Figure 1). On MRI under several conditions, the apparent diffusion coefficient attenuated exponentially with prolongation of the diffusion time. Signal change was not observed in the axial direction, but in the radial direction, the characteristics of the attenuation were captured. In addition, the characteristics differed between the tibialis anterior muscle (TA) and soleus muscle (SOL) (Figures 2 and 4). With the capillary phantom, which is a perfectly restricted structure, the characteristics of ADC attenuation associated with cell diameter differences were obtained (Figures 3 and 4).Discussion
In animal experiments, the relation between each muscle group and AQP4 expression could be confirmed with immunostaining. Additionally, the diffusion time-dependent dMRI measurement showed a different transitional ADC change depending on the diffusion time among skeletal muscle groups. In the comparative experiment, on measuring the phantom with pore sizes equivalent to those of the skeletal muscle(3) (i.e., 15–50 µm) and no water exchange at the pore wall, we identified the functional characteristics of the closed cell system model. With regard to the transition of the diffusion coefficient owing to the difference in the diffusion time, the gastrocnemius muscle and TA had strong AQP4 expression, while the SOL had abundant type 1 fibers with no AQP4 expression, resulting in low diffusion time dependence and gradually causing a relatively low diffusion coefficient. In numerical analysis by curve fitting, the coefficients assumed to represent the water molecule transfer exchange amount showed the same tendency inside and outside the TA. The cell diameter was largely different between type 2a and 2b fibers, although they represented the same type 2 fiber(7). However, there was no difference in Figure 5, and it was suggested that the AQP4 function difference could be measured. Moreover, it was suggested that this method could dynamically assess mesoscopic information with or without skeletal muscle AQP4 function (i.e., cell membrane water permeability).Conclusion
We obtained images reflecting the difference in the function of cell membrane permeability of water molecules associated with AQP4, independent of muscle cell size. Our approach might help in the identification of novel medical findings after its development for the assessment of many skeletal muscle diseases and the evaluation of motor function.Acknowledgements
This research is partially supported by the program for Brain Mapping by Integrated Neurotechnologies for Disease Studies (Brain/MINDS) from Japan Agency for Medical Research and development, AMEDReferences
- Agre P. et al. Science. 1992 Apr 17;256(5055):385-7.
- Schiaffino S. et al. Physiol Rev. 2011 Oct;91(4):1447-531.
- Callaghan PT, 1991, Clarendon, Oxford
- Novikov DS. et al. Proc Natl Acad Sci U S A. 2014 Apr 8;111(14):5088-93.
- Takayuki O, et al. ISMRM 2016 Volume: 24 (No.2010)
- Nilsson M. et al. Magn Reson Med. 2013 Jun;69(6):1573-81.
- Junichi H, et al. ISMRM 2017 Volume: 25 (No.4998)
Figures
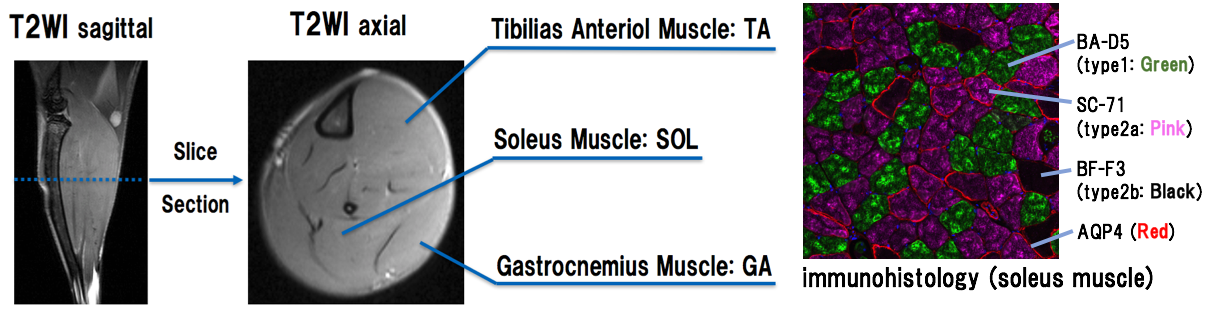
Figure 1. For MRI analysis, the ROI was set as the lower leg skeletal muscle by using morphological images
obtained with
a spin-echo T2-weighted pulse sequence. The area
surrounded by the
tibialis anterior muscle (TA), soleus muscle (SOL), and gastrocnemius
muscle (GA) is presented. The histological image represents the SOL that shows many types of muscle fibers.
On immunostaining, type 1 fibers
appear green, type 2a fibers
appear pink, type 2b fibers
appear black, and AQP4 appears red.
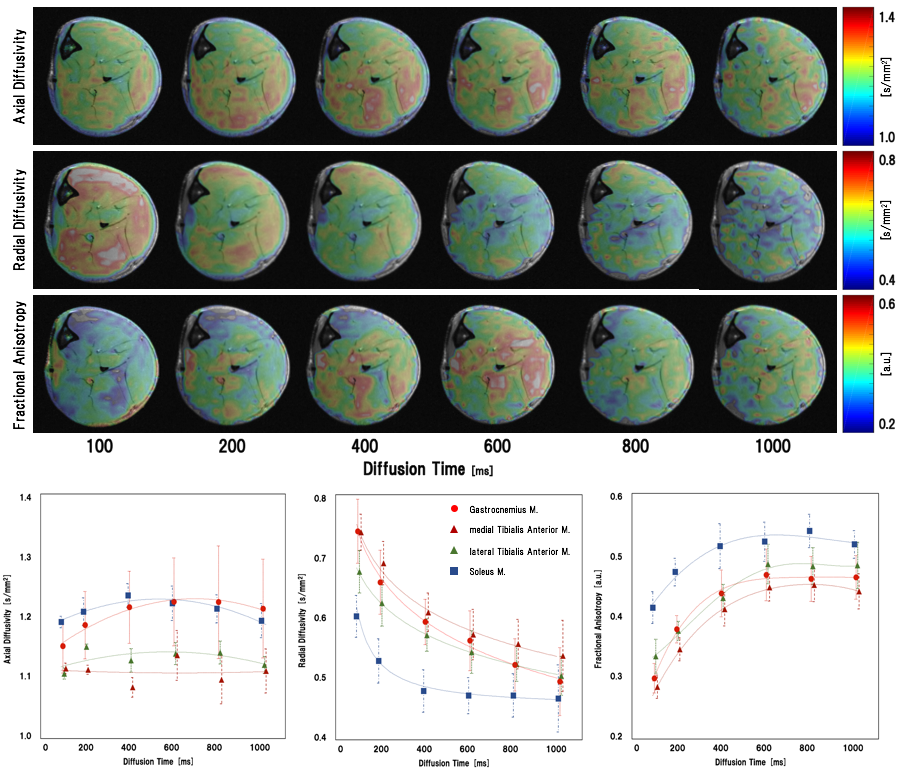
Figure 2. The top panel presents color maps for axial
diffusivity (AD), radial diffusivity (RD), and fractional
anisotropy (FA). The bottom panel shows the transition of the signal at each ROI (gastrocnemius muscle, medial tibialis anterior muscle [TA], internal TA, and soleus muscle) obtained from each upper panel image (AD, RD, and FA). The diffusion time varies from 100 to 1000 ms.
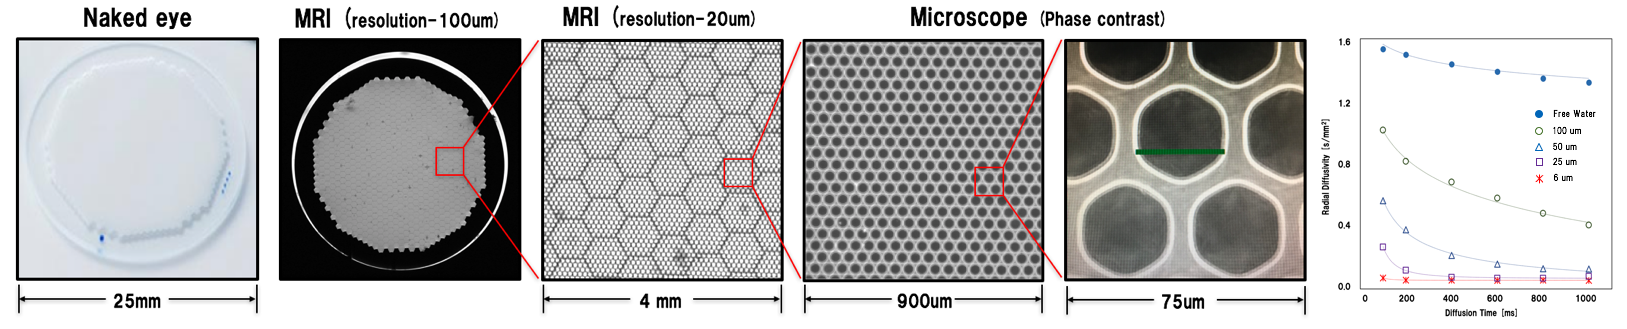
Figure 3. The
perfectly restricted pore phantom is presented. Diffusivity
is assessed with a change in the diffusion time. The first image is of the phantom. The second and third images are structural MRI images. The fourth and fifth images are phase-contrast microscopy images. The last image presents the transition of diffusivity owing to diffusion time dependence.
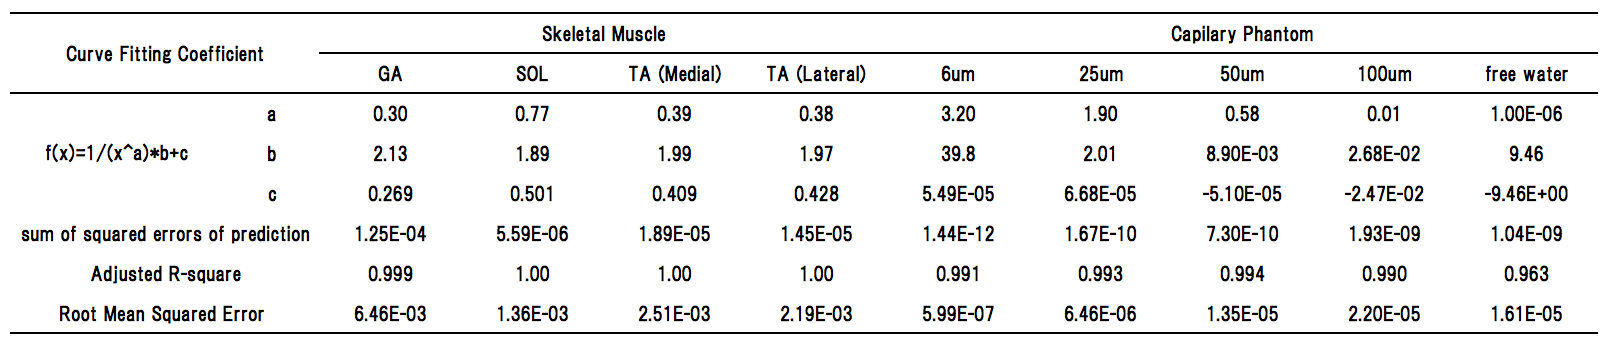
Figure 4. Data
for curve fitting performed on the transition of diffusivity owing to diffusion time dependence. The curve fitting was
performed using f (x) = b / (x^a) + c. The coefficients a, b, and c after fitting
are summarized in the table. In addition, the sum of squared errors of
prediction, adjusted R-square,
and root mean squared error are presented.
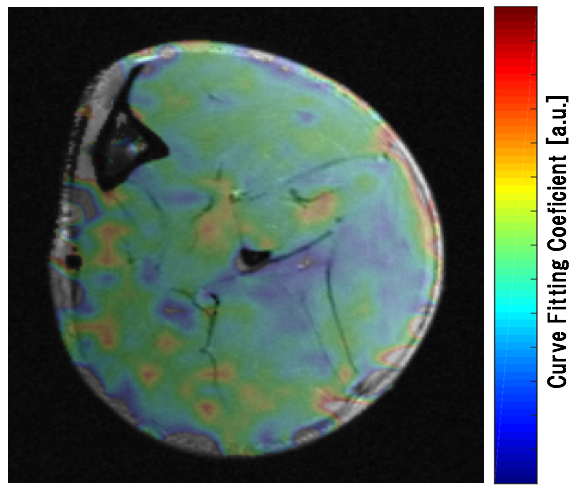
Figure 5. The percentage of water molecule exchange involving the cell membrane is shown. This largely reflects the functional difference associated with the presence or absence of skeletal muscle AQP4. A
part of the
soleus muscle in the leg, which has many slow muscles,
is highlighted and visualized.