1270
Correlation between skeletal muscle fat content and insulin resistance in patients with type 2 diabetes mellitus1Medical Imaging, Shengjing Hospital affiliated to China Medical University, Shenyang, Liaoning, China, 2Medical Imaging, Philips Healthcare, Beijing, China
Synopsis
To quantitatively investigate various parts of the thigh skeletal muscle fat content in patients with type 2 diabetes to explore its correlation with insulin resistance via MRI.
Introduction
Insulin resistance (IR) is considered as the main pathogenesis of type 2 diabetes, and one of the leading risk factors for cardiovascular disease. Skeletal muscle is one of the main target tissues of insulin and, in the meanwhile, an important organ for glucose and fat uptake and utilization in human body. Ectopic deposition and abnormal metabolism of skeletal muscle fat are proven two important factors in the pathogenesis of insulin resistance1. Using MRI to measure the skeletal muscle fat at mid-thigh level is the most common and simple method to estimate the fat content of the whole body skeletal muscle2.This study is to investigate various parts of skeletal muscle fat content in patients with type 2 diabetes to explore its correlation with insulin resistance via MRI.Methods
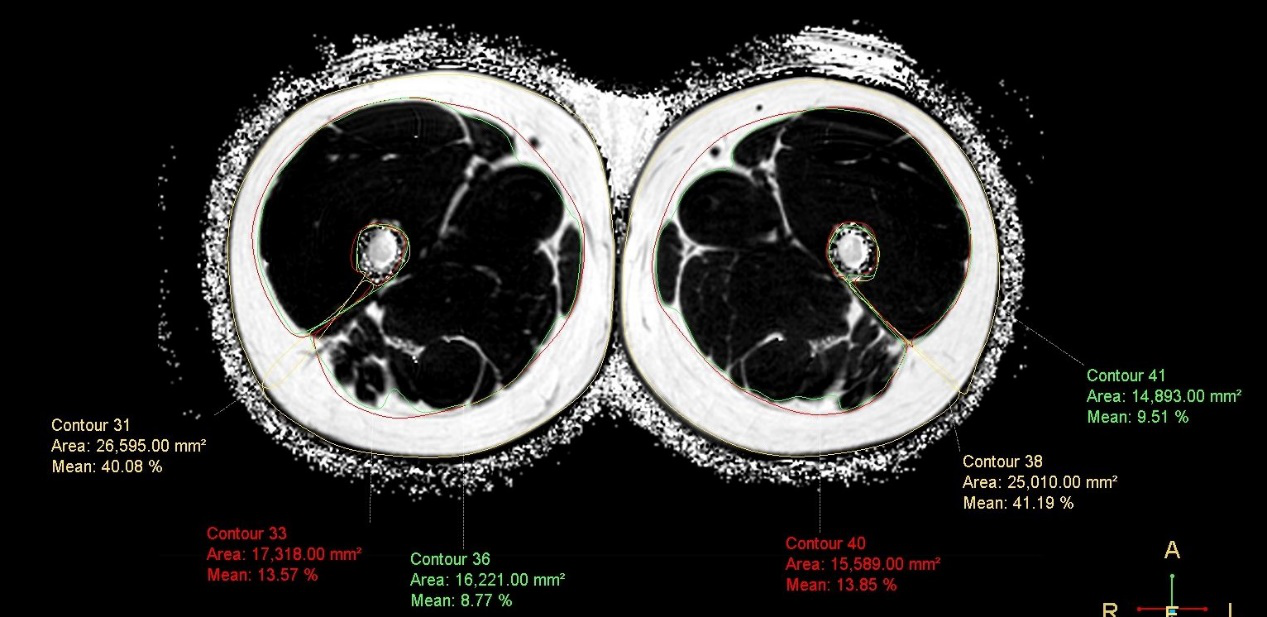
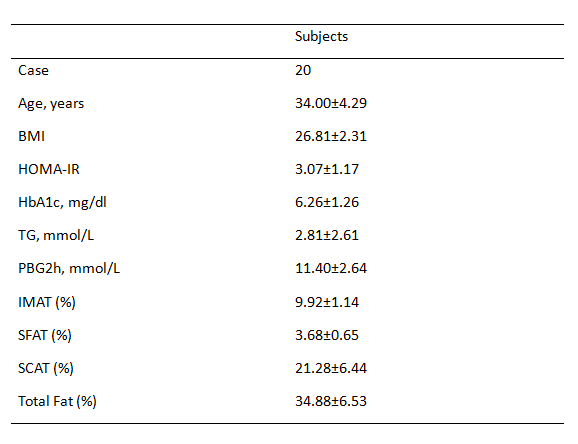
The study was conducted on 20 patients (25 to 38 years old, male) that were recently diagnosed with type 2 diabetes, and their physiological information and laboratory tests results were collected before MR imaging. MR scans were performed at 3.0 T (Philips, Best, Netherlands) targeting both legs at the middle thigh, with the following protocols: axial T1-weighted TSE, coronal STIR TSE, and mDIXON-Quant (TR/TE/ΔTE = 9.3/1.5/1.2 ms, flip angle = 3°, echo nuber = 6, matrix = 384x254, FOV = 420x280 mm2). Intermuscular fat (IMAT), adipose tissue beneath the fascia (SFAT), subcutaneous fat (SCAT), and the total fat content were all quantified using mDIXON-Quant, with all the images (Figure 1) processed on IntelliSpace Portal 8.0 (Philips, Best, Netherlands). Each subject was examined in the supine position with a phased-array body coil. The insulin resistance index (HOMA IR) was calculated following the homeostasis model assessment (HOMA): fasting blood glucose × fasting insulin / 22.5. Statistical analysis was carried out using multiple linear regression method. All continuous variables were presented as mean±standard deviation (SD).Results
Subjects’ general information and laboratory results were displayed in Figure 2. The IMAT and SFAT of the patients’ skeletal muscle fat were statistically different from HOMA-IR index (P<0.05), and were positively correlated (Figure 3). However, only IMAT was statistically different with both HbA1c and HOMA-IR index (P<0.05). The remaining fat components of skeletal muscle (total fat content, subcutaneous fat) were not statistically different with type 2 diabetes laboratory-related indicators such as HOMA-IR index and glycated hemoglobin (Figure 3).Discussion
IMAT and SFAT contents were significantly correlated to HOMA-IR index in our study, and IMAT was also associated with glycated hemoglobin. This may because the accumulation of IMAT is associated with insulin insensitivity, inflammation, and functional deficits in skeletal muscle3. Studies have shown that IMAT is strongly associated with serum leptin and can impair insulin activity as well as muscle fiber signal transmission through paracrine effects, and it is also found correlated with monocyte chemoattractant protein-1 activity4-5.Conclusions
We presented the feasibility of measureing deposition of IMAT and SFAT in skeletal muscle with mDIXON-Quant MRI, which is one of the important body composition determinants of insulin resistance in type 2 diabetes. To our study, SCAT is not related to insulin resistance. The technique holds the potential to show better accuracy in determining the relationship between skeletal muscle fat and other diseases, when compared to other imaging modalities such as DXA and CT.Acknowledgements
We thank Department of Endocrinology, Shengjing Hospital, China Medical University and Philips Healthcare for the support to this study.References
1. Goodpaster B, Thaete F D. Thigh adipose tissue distribution is associated with insulin resistance in obesity and in type 2 diabetes mellitus[J]. American Journal of Clinical Nutrition, 2000, 71(4):885-92.
2. Wu Y, Ding Y, Tanaka Y, et al. Risk Factors Contributing to Type 2 Diabetes and Recent Advances in the Treatment and Prevention[J]. International Journal of Medical Sciences, 2014, 11(11):1185-1200.
3. Zoico E, Rossi A, Francesco V D, et al. Adipose Tissue Infiltration in Skeletal Muscle of Healthy Elderly Men: Relationships With Body Composition, Insulin Resistance, and Inflammation at the Systemic and Tissue Level[J]. Journals of Gerontology, 2010, 65(3):295-299.
4. Hamrick M W, Mcgee-Lawrence M E, Frechette D M. Fatty Infiltration of Skeletal Muscle: Mechanisms and Comparisons with Bone Marrow Adiposity:[J]. Frontiers in Endocrinology, 2016, 7(15).
5. Laurens C, Louche K, Sengenes C, et al. Adipogenic progenitors from obese human skeletal muscle give rise to functional white adipocytes that contribute to insulin resistance.[J]. Int J Obes, 2016, 40(3):497-506.
Figures
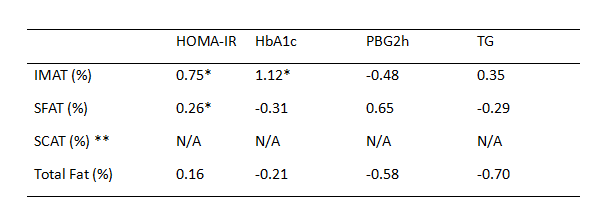
PBG, postprandial blood glucose; TG, triglyceride.N/A, not available.
*Significantly lower than volunteers(p<0.05).
**Excluded variable
Figure 3: Correlation between the various parts of the skeletal muscle fat content and laboratory indicators of type 2 diabetes.