1269
A neural network approach for estimating muscle perfusion from DCE-MRI data1Department of Radiology and Imaging Sciences, University of Utah, Salt Lake City, UT, United States, 2School of Public Health and Health Sciences, University of Massachusetts Amherst, Amherst, MA, United States, 3Division of Biostatistics, Department of Internal Medicine, University of Utah, Salt Lake City, UT, United States, 4Verily Life Sciences, Cambridge, MA, United States
Synopsis
Perfusion is an important aspect of calf muscle function that can be measured with dynamic contrast-enhanced (DCE) MRI. However, conventional methods for quantifying perfusion from DCE-MRI data require an appropriate tracer-kinetic model, which may not be available clinically. In this study, we examined the feasibility of neural networks (NNs) for quantifying calf-muscle perfusion from DCE-MRI data. We found that NNs estimate perfusion with accuracy comparable to conventional methods, without the need for a tracer-kinetic model. NNs like those developed in this study can be readily incorporated into ordinary MRI scanner software, facilitating routine quantitative perfusion analysis with DCE-MRI.
Introduction
Perfusion provides critical insight into calf-muscle function in patients with peripheral artery disease (PAD). Dynamic contrast-enhanced (DCE) MRI is an established technique for accurately measuring perfusion, and has recently been validated in exercise-stimulated calf muscle.1 Conventional methods for quantifying perfusion from DCE-MRI data require an appropriate tracer kinetic model (TKM), which may not be available in a clinical setting.2
Recent developments in the field of machine learning, particularly those that employ neural networks, have shown promise for automating MRI data analysis.3 In this study, we examined the feasibility of neural networks (NNs) for quantifying calf-muscle perfusion from DCE-MRI data. A variety of NN architectures were assessed for their accuracy in estimating muscle perfusion.
Methods
Ten healthy subjects (4 male, 5 female; 22-43 years) were included in this IRB-approved study. Each subject performed plantar flexion to stimulate perfusion immediately prior to DCE-MRI of the calf. The DCE-MRI data was first analyzed with a conventional TKM method to obtain reference perfusion values. These reference values were then used to train and test NNs designed to estimate perfusion from DCE-MRI data.
DCE-MRI of calf muscle
MR imaging was performed using a 3T scanner (TimTrio; Siemens), with a 4-channel flex coil wrapped around the calf for image acquisition. Each subject performed plantar flexion in the magnet bore by pushing a pedal weighted by 8 lbs of resistance at a rate of 1 Hz for 3 minutes.4 At the end of exercise, 0.05 mmol/kg gadoteridol (Prohance; Bracco) was injected intravenously at a rate of 5 ml/s, and then dynamic imaging continued for 4 minutes. Dynamic images were acquired from an axial slice through the thickest part of the right calf, using a 2D saturation-recovery turboFLASH sequence5: delay time 300ms, TR 527ms, TE 1.42ms, flip angle 15°, slice thickness 10mm, matrix 128×128, FOV 160×160mm, temporal resolution 1 s/frame. To quantify tracer concentration from the dynamic images, proton density was measured from the same slice using the same pulse sequence, but with a TR of 4000ms.
MRI data was processed using MATLAB. Each dynamic image was converted to a map of tracer concentration.5 The arterial input function (AIF) was manually sampled from the peroneal artery visible in the FOV. Voxel-wise perfusion was then calculated by fitting the contrast-enhancement curve of each voxel with a TKM that expresses tracer-concentration as a convolution of the AIF and the muscle’s impulse retention function.6-8
Neural networks for perfusion estimation
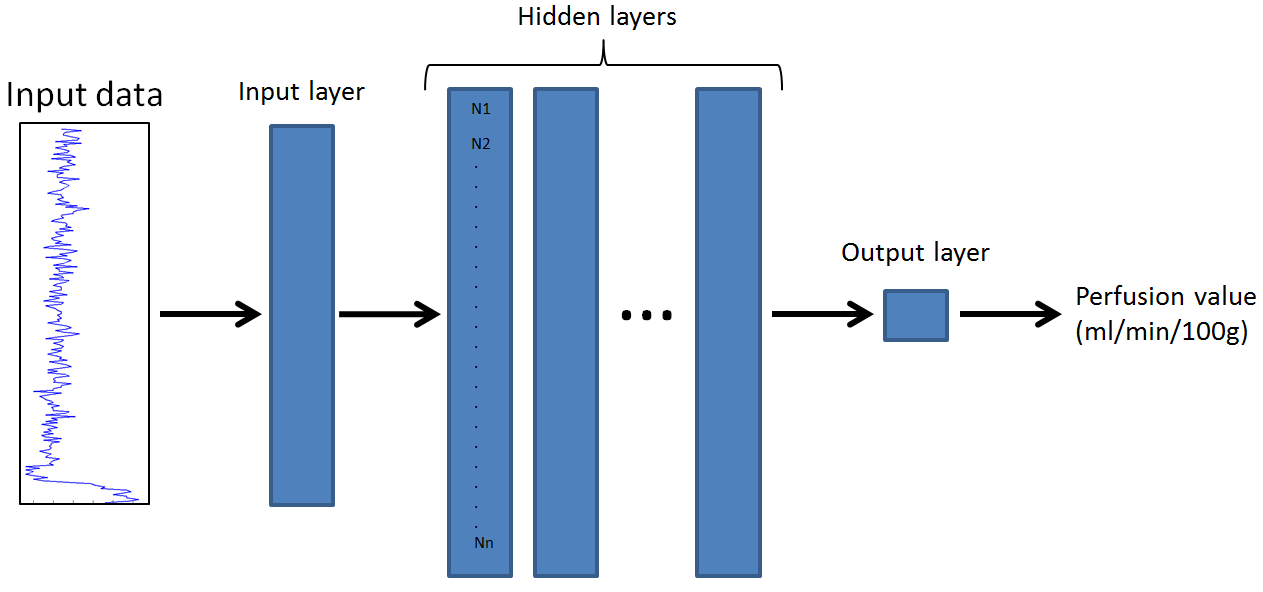
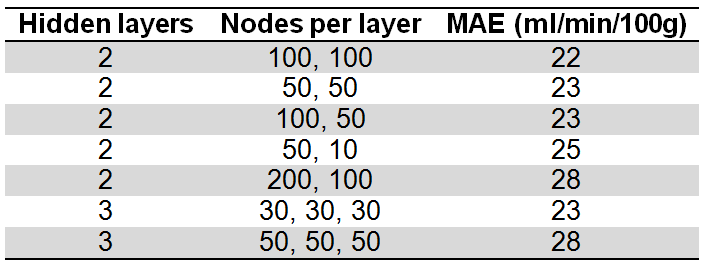
Training and testing of NNs was performed using TensorFlow. The NNs were designed to receive an input-vector and output a perfusion value (Figure 1). The input-vector was the contrast-enhancement curve of one voxel, concatenated with the AIF. We varied key parameters of NN architecture, including the number of hidden layers and nodes per layer (Table 1). Of the 70,606 voxels in the 10 DCE-MRI datasets acquired for this study, 55,020 (6 datasets) were randomly selected for training the NNs, with the remaining 15,586 (4 datasets) reserved for testing the trained NNs. During training, the mean absolute error (MAE) between perfusion estimates from the NN and the conventional TKM was minimized. In testing, MAE was used to evaluate the performance of the trained networks. For the optimal NN with lowest MAE, we computed the mean difference and correlation between NN and TKM perfusion values in the testing dataset. As a preliminary study using the optimal NN, we also evaluated the accuracy of perfusion estimates derived from only the muscle contrast-enhancement curves (without concatenated AIF).
Results
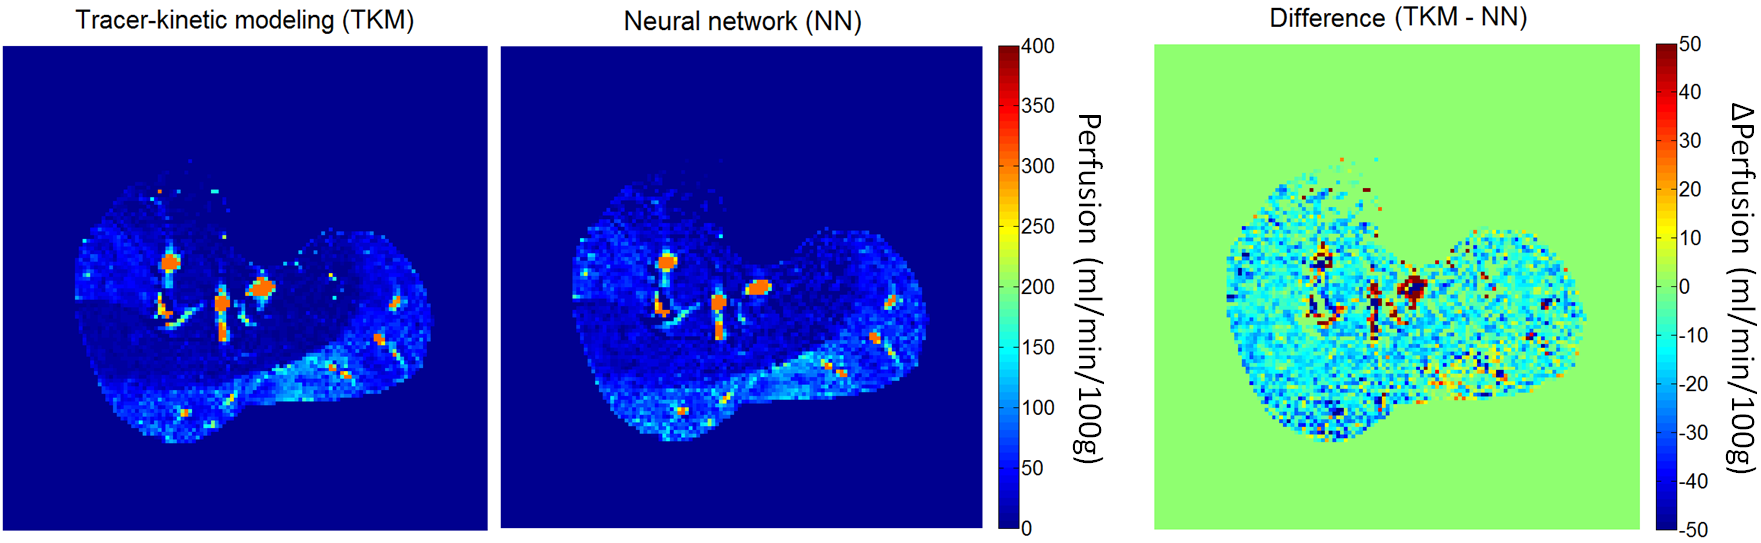
Table 1 compares the performance of the different NN architectures. For our application, the lowest MAE was achieved using a NN with 2 hidden layers of 100 nodes each. For this architecture, the mean difference between the NN perfusion and the reference TKM value was 0% ± 48%, and the Pearson correlation was 0.89 (P<0.01). Figure 2 compares representative NN and TKM perfusion maps. With only muscle contrast-enhancement curves as inputs (no AIF), the NN’s MAE increased to 25 ml/min/100g and the mean difference increased to 14% ± 55%.Discussion
This study demonstrated the feasibility of NNs for estimating calf-muscle perfusion from DCE-MRI data, as an alternative to conventional TKM methods. Perfusion estimates obtained using NNs were comparable to those from an established TKM. We showed that considering the AIF in the estimation led to more accurate perfusion values, but results obtained without the AIF were acceptable. NNs like those developed in this study can be readily incorporated into clinical MRI scanners to enable routine quantitative perfusion analysis with DCE-MRI, potentially improving the detection and management of diseases such as PAD.Acknowledgements
This work was supported in part by the National Heart, Lung, and Blood Institute of the National Institutes of HealthReferences
1. Zhang JL, Layec G, Hanrahan C, et al. Exercise-induced calf muscle hyperemia: quantitative mapping with low-dose dynamic contrast enhanced magnetic resonance imaging (DCE MRI). AJP-Heart and Circulatory Physiology 2018.
2. Tofts PS. Modeling tracer kinetics in dynamic Gd-DTPA MR imaging. J Magn Reson Imaging 1997;7(1):91-101.
3. Liu J, Pan Y, Li M, et al. Applications of Deep Learning to MRI Images: A Survey. Big Data Mining and Analytics 2018;1(1).
4. Layec G, Haseler LJ, Richardson RS. The effect of higher ATP cost of contraction on the metabolic response to graded exercise in patients with chronic obstructive pulmonary disease. J Appl Physiol (1985) 2012;112(6):1041-1048. 5. Vivier PH, Storey P, Rusinek H, et al. Kidney function: glomerular filtration rate measurement with MR renography in patients with cirrhosis. Radiology 2011;259(2):462-470.
6. St Lawrence KS, Lee TY. An adiabatic approximation to the tissue homogeneity model for water exchange in the brain: II. Experimental validation. J Cereb Blood Flow Metab 1998;18(12):1378-1385.
7. Zhang JL, Rusinek H, Bokacheva L, et al. Functional assessment of the kidney from magnetic resonance and computed tomography renography: impulse retention approach to a multicompartment model. Magn Reson Med 2008;59(2):278-288.
8. Dennis Cheong LH, Markus Tan CK, Koh TS, Tchoyoson Lim CC, Bisdas S. Functional Imaging: Dynamic Contrast-Enhanced CT using a Distributed-Parameter Physiologic Model for Accessing Stroke and Intracranial Tumor. Proceedings of the Annual International Conference of the IEEE Engineering in Medicine and Biology Society IEEE Engineering in Medicine and Biology Society Annual Conference 2005;1:294-297.
Figures