1268
Evaluation of inter- and intramuscular differences using multi-slice T2* measurements after an in-magnet stepping exercise.1Radiology, Leiden University Medical Center, Leiden, Netherlands, 2Rehabilitation, Leiden University Medical Center, Leiden, Netherlands
Synopsis
In this study we explored the feasibility of using an MR-compatible ergometer mimicking stair climbing to study differences in T2* after exercise between and within different thigh muscles. Four healthy subjects performed a 10-minute stepping exercise inside a 3T. Participants exercised at either a high rate of perceived exertion (RPE) or a low RPE. Clear differences between low and high RPE and different muscles, but not within muscles, were found. This shows that it is possible to use stair-climbing using an MR-compatible ergometer to study differences between and within muscles in response to exercise.
Introduction
Duchenne muscular dystrophy (DMD) is characterized by progressive fatty infiltration in muscles. This starts in specific muscles, spreads to others as the disease progresses, and differs along the proximal-distal axis.1,2 Because they lack dystrophin, a key structural link between the contractile apparatus and the cellular membrane, DMD muscles are thought to be particularly susceptible to damage. Therefore, differences in muscle degeneration could potentially be explained by variations in the inter- and intramuscular response to exercise. One common MR index of muscle use and recovery is T2 and/or T2* changes during and after exercise. Most T2*-MRI studies use simple calf exercises, as the experimental setup is easy and movement artefacts are limited. However, this exercise involves a low number of muscles and barely involves the cardiovascular system and is thus far from realistic.3,4 Moreover, differences within muscles are often not assessed, apart from a recent study where oxidative capacity was found to be different along the Tibialis Anterior (TA) muscle.5 Here, we explored the feasibility of using an MR-compatible ergometer mimicking stair climbing to study differences in T2* after exercise, between and within thigh muscles.Methods
Four healthy subjects (23 to 41 y/o, 3F) performed a 10-minute supine stepping exercise inside a 3T Ingenia (Philips, Best, the Netherlands) using the Cardiostep ergometer (Ergospect GmbH, Innsbruck, Austria). To measure T2* changes at low and high workloads, participants exercised at different levels of the rate of perceived exertion (RPE)6 previously determined outside the scanner. The load was applied via air pressure, with 60 steps/min, and expected RPEs were either ≤12 (low RPE) or ≥13 (high RPE). A multi-echo gradient-echo sequence (TR/TE/ΔTE 322/2.4/15.0ms; 4 echoes; five slices; gap 20mm; FOV 220x220mm2; voxel size 2x2x10mm3, SPIR fat suppression, acquisition time 23s) was used to acquire data pre- and post-exercise (35 dynamics) using a small extremity 8-element receive array placed around the thigh. Images after exercise were co-registered to the first dynamic and voxelwise T2*-maps were calculated by mono-exponential fitting using a least squares method. ROI’s were drawn for the Rectus Femoris (RF), Vastus Medialis (VM), Vastus Lateralis (VL), Semitendinosus (ST) and Biceps Femoris (BF) muscles. For each muscle and each slice, ∆T2*-values, defined as the difference with pre-exercise were determined.Results
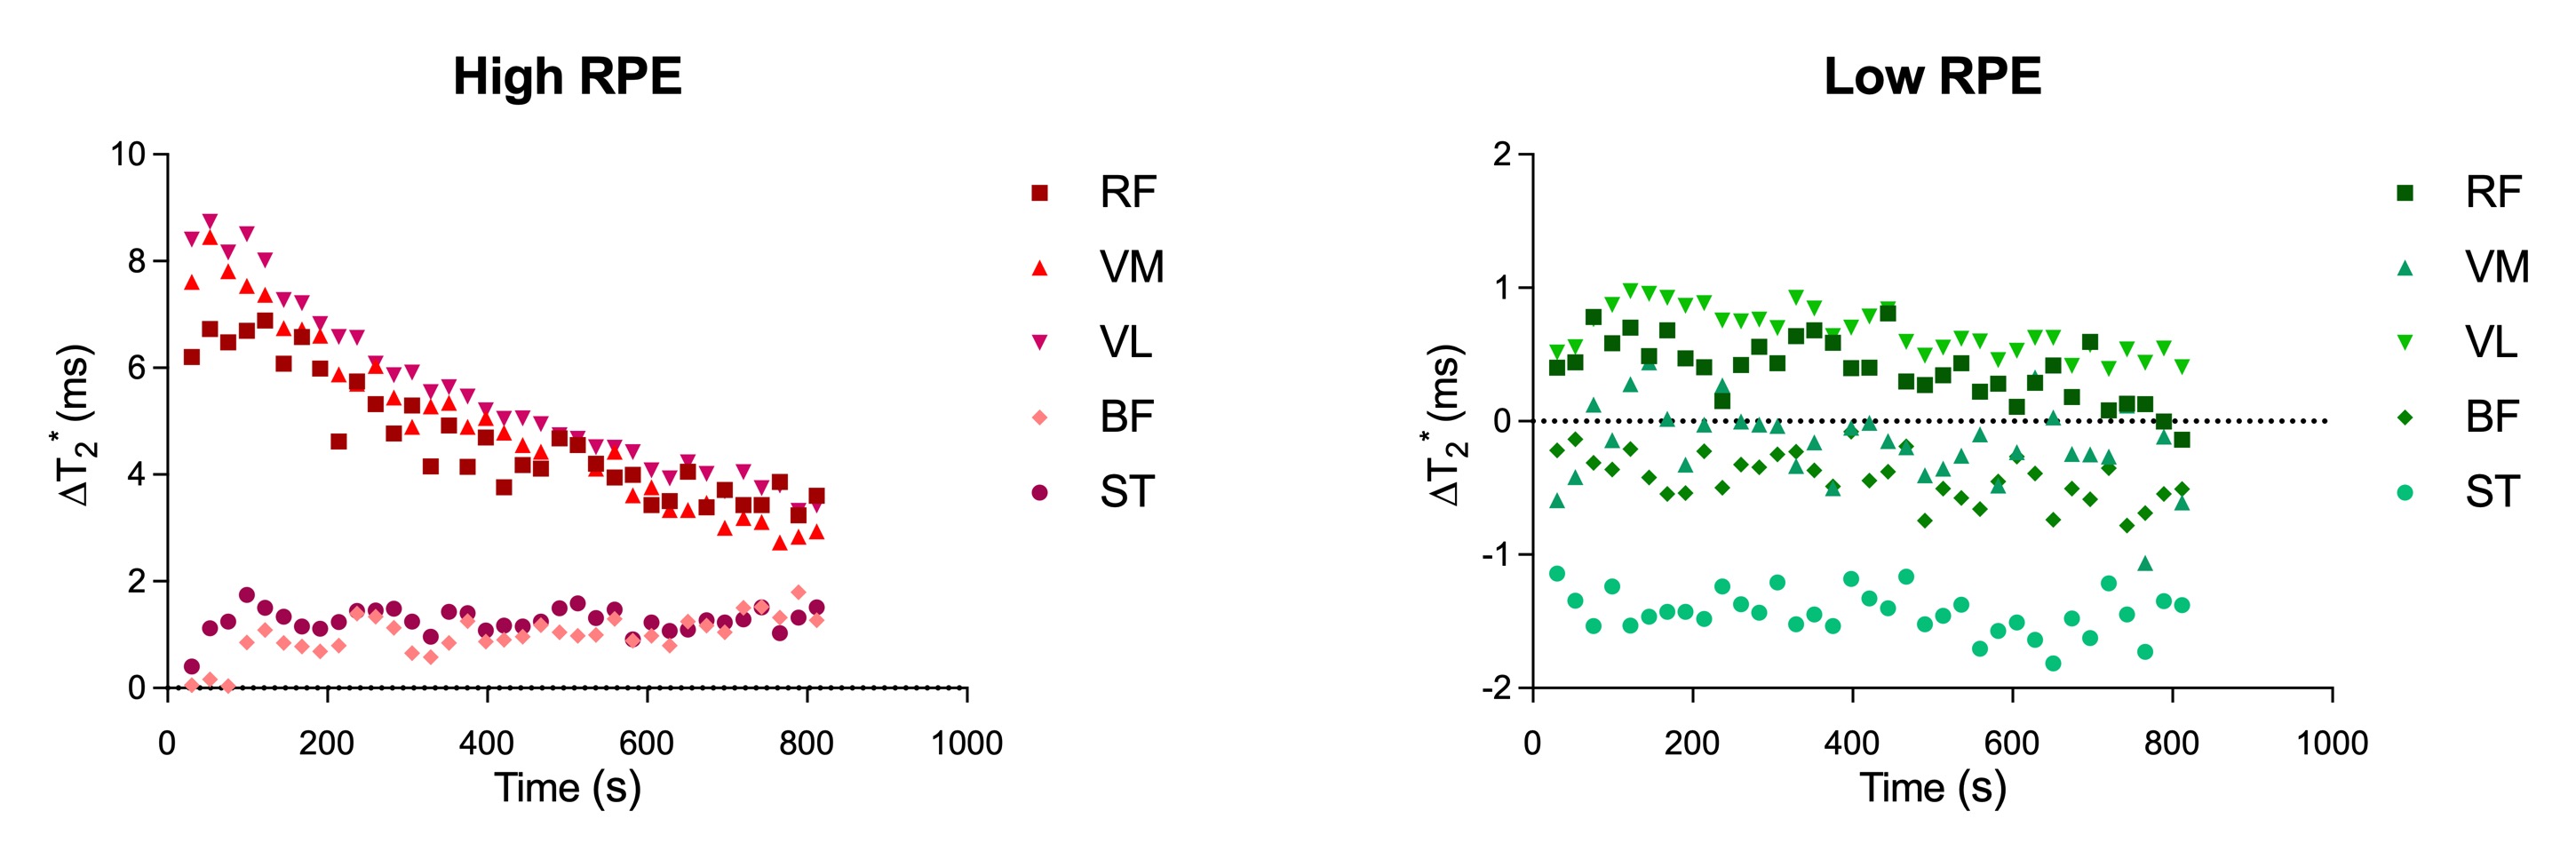
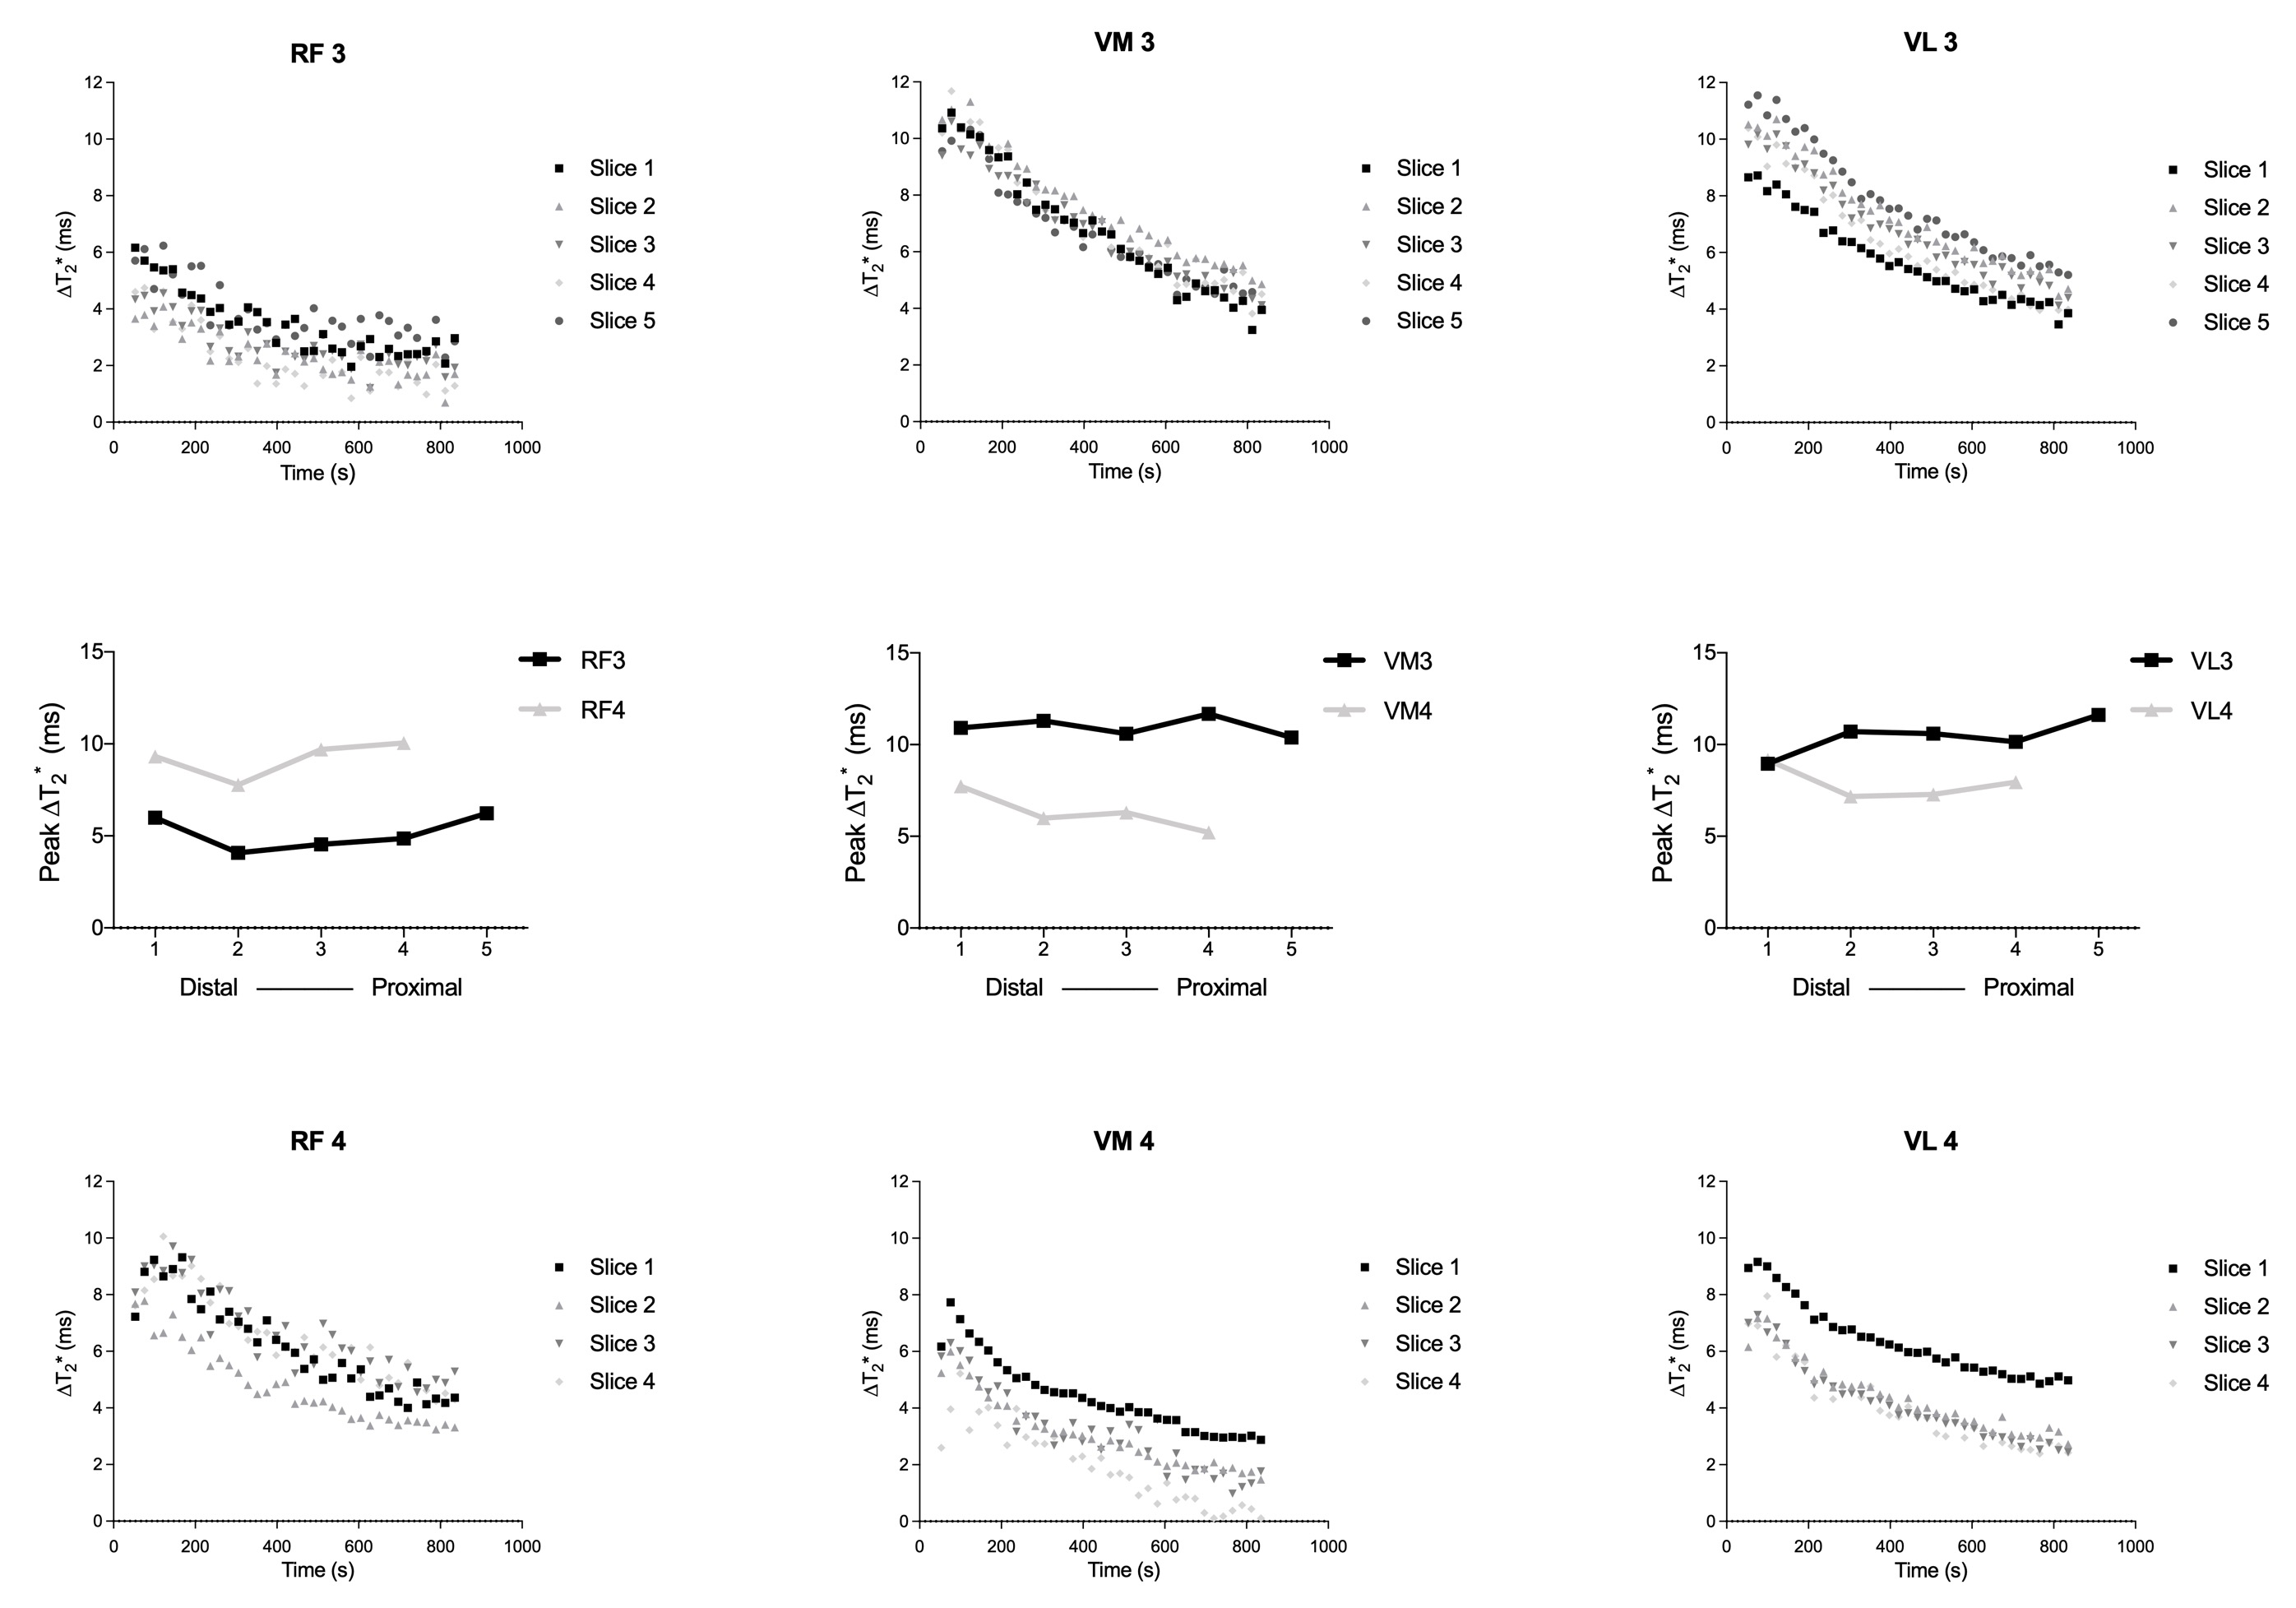
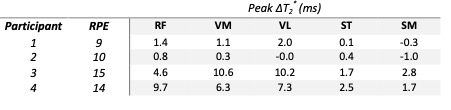
All four participants completed the protocol. Only participant 4 changed position during exercise resulting in only four slices being available for analysis. The high RPE participants showed an increase in T2* for the VM, VL and RF after exercise (∆T2* of 8.5±3.0, 8.7±2.1, 7.1±3.7ms, respectively) (table 1), which slowly returned towards resting values (Figure 1). The ST and BF showed only a small increase in these participants. For the low RPE participants only minor increases for the quadriceps muscles were observed. Within muscles, no differences were found in peak ∆T2* along the proximal-distal axes of the muscles (figure 2).Discussion & Conclusion
Our results show that in-magnet stair-climbing exercise using an MR-compatible ergometer can be used to study muscle response to exercise. Clear post-exercise differences were observed for the high RPE participants only, and are in agreement with previous literature.3,4,7,8 The largest increase in T2* occurred in the VL, VM and RF, with only minor increases in the ST and BF, and are in line with the function of the muscles during this type of exercise. A recent study using single limb exercise reported differences in peak ∆T2*-weighted signal for the TA,5 along with differences of up to 100% in recovery slope. This slope was measured during the first 30s after exercise. We chose to study several upper leg muscles in a more natural movement, and therefore could not use an EPI readout due to fat artefacts. We also measured T2* rather than using a weighted signal intensity. This together resulted in longer scan times per image and thus meant that we could not assess a potential rapid initial increase in T2* during recovery. However, peak ∆T2* also did not differ along the muscles in our work. The most pronounced changes in the TA muscle were found in the most proximal slices of this uni-pennate muscle.5 In the thigh, muscle architecture is more complex and the muscles are longer compared to the TA. Therefore, as we measured at mid-thigh, it could be that oxidative capacity is only different at the proximal end and/or is different for multi-pennate muscles. Alternatively, it is possible that the larger involvement of the cardiovascular system in our protocol prevented the proximal-distal differences. To resolve this, future studies should aim to cover larger parts of the muscle and speed up data acquisition.Acknowledgements
This work was supported by the Netherlands Organization for Scientific Research (NWO), under research program VIDI, project "Similar but not the same", number 917.164.90References
1. Chrzanowski SM, Baligand C, Willcocks RJ, et al. Multi-slice MRI reveals heterogeneity in disease distribution along the length of muscle in Duchenne muscular dystrophy. Acta Myol. 2017;36(3);151-162
2. Hooijmans MT, Niks EH, Burakiewicz J, et al. Non-uniform muscle fat replacement along the proximodistal axis in Duchenne muscular dystrophy. Neuromuscul Disord. 2017;27(5);458-464.
3. Cannon DT, Howe FA, Whipp BJ, et al. Muscle metabolism and activation heterogeneity by combined 31P chemical shift and T2 imaging, and pulmonary O2 uptake during incremental knee-extensor exercise. J Appl Physiol. 2013;115(6);839-849.
4. Jeneson JAL, Schmitz JPJ, Hilbers PAJ & Nicolay K. An MR-compatible bicycle ergometer for in-magnet whole-body human exercise testing. Magn Reson Med. 2010;63(1);257-261.
5. Boss A, Heskamp L, Breukels V, Bains LJ, van Uden MJ & Heerschap A. Oxidative capacity varies along the length of healthy human tibialis anterior. J Physiol. 2018;596(8);1467-1483.
6. Borg G. Borg’s rating of perceived exertion and pain scales. Champaign, IL: Human Kinetics, 1998.
7. Varghese J, Scandling D, Joshi R, et al. Rapid assessment of quantitative T1, T2 and T2* in lower extremity muscles in response to maximal treadmill exercise. NMR Biomed. 2015;28(8);998-1008.
8. Reid RW, Foley JM, Jayaraman RC, Prior BM & Meyer RA. Effect of aerobic capacity on the T2 increase in exercised skeletal muscle. J Appl Physiol. 2001;90(3);897-902.
Figures