1267
Deep Learning-Based Automatic Estimation of Volume and Fat Fraction in Abductor Muscles and their Associations with T1ρ and T2 in Hip Osteoarthritis Patients1Radiology and Biomedical Imaging, University of California San Francisco, San Francisco, CA, United States, 2Physical Therapy and Rehabilitation Science, University of California San Francisco, San Francisco, CA, United States
Synopsis
In Osteoarthritis, cartilage degeneration can be accompanied by muscle weakness. T1ρ and T2 relaxation times have been used to probe cartilage degeneration. This study aims to develop an automatic machine-learning based segmentation and quantification pipeline to estimate the volumes and fat fractions of the three hip abductor muscles and study their associations with T1ρ and T2 relaxation times. Our results showed fast, reliable segmentations the hip abductor muscles and voxel based correlations between T1ρ and fat fraction and T2 and volumes of the muscles.
Introduction
Osteoarthritis (OA) is a debilitating joint disease that affects over 30 million American adults, primarily affecting the weight bearing joints such as the knee and hip1. Muscle atrophy around the affected joint and muscle weakness has been identified in OA2. Hip abductor muscles are joint stabilizers in weight-bearing conditions3. There is evidence that patients with hip OA have reduced volumes of the gluteus minimus (GMin) and gluteus medius (GMed), and increased fatty infiltration in GMin4. While these reduced volumes computed by manual post processing have been observed in patients with advanced OA (KL>2), there is a need to establish the relationship with biomarkers for OA in its early stages on larger samples. T1ρ and T2 relaxation times have been used to probe changes in the cartilage matrix at early stage cartilage degeneration5. The goal of this study was two fold: (i) to develop an automatic segmentation and quantification pipeline to estimate the volume and fat fraction in tensor fascia latae (TFL), GMin and GMed that allows for larger sample analysis and (ii) to study associations with T1ρ and T2.Methods
Fifty-two subjects with radiographic or symptomatic OA were enrolled in this study (age 49.32±13.56 years, BMI 24.03±3.02 Kg/m3, 32 males). Subjects were positioned supine feet first, with a 32 channel cardiac coil wrapped around the hip of interest, into a 3T Discovery 750 MR scanner (GE Healthcare, Waukesha, WI). The MR sequences acquired included: (1) IDEAL SPGR (2) Oblique Axial T1w, and (3) 3D sagittal combined T1ρ/T2 (Table 1). A 3D V-Net was developed to perform automatic volumetric segmentation6. This architecture features a symmetrical network that first learns an encoding by down sampling with 3D convolutions and then learns to decode into a 3D segmentation mask by up sampling with "deconvolutions". The training data consisted of 44 manually segmented muscle masks, performed by two skilled technicians, with an inter-rater reliability ICC >0.94. IDEAL volumes were used as CNN inputs, which was trained with Dice coefficient loss, Adam optimizer with initial learning rate = 1e-4, and a batch size of 1. The model was implemented in Python using Tensorflow and trained for 300 epochs (9 hours) on a Nvidia Titan X GPU. The manual and automatic segmentations were both applied to the deconstructed fat and water images (derived from the IDEAL sequences with chemical-shift based water-fat separation) for each patient, the fat fraction was computed with the following equation for each voxel: $$ \begin{equation} \eta = \frac{S_{fat}}{S_{fat}+S_{water}} \end{equation} $$ where η is the fat fraction, Sfat is the signal from the fat only image, Swater is the signal from the water only image7. Performance of the automatic segmentation was evaluated using Dice coefficient overlap and average surface distances in 20 hold-out training examples, as well as by the automatic segmentations’ ability to quantify the fat fraction. Voxel Based Relaxometry (VBR) was used to quantify T1ρ and T2 relaxation times8. Median fat fraction and volume for each muscle were considered to define low and high groups. Voxel based differences were evaluated as previously described9. Age, gender and BMI were considered as adjusting factors in statistical analyses.
Results
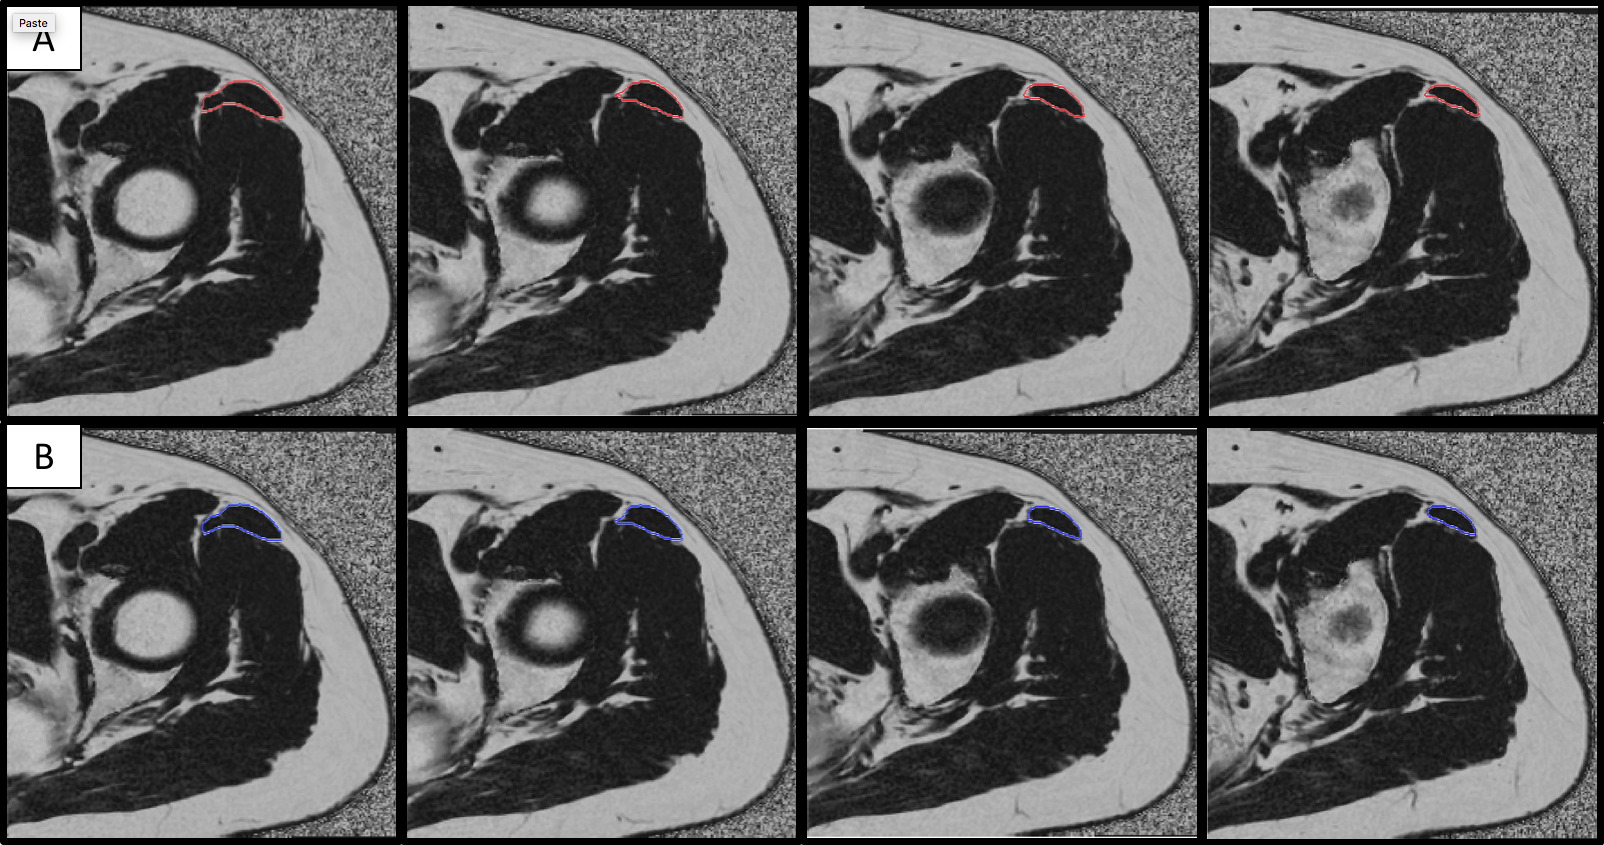
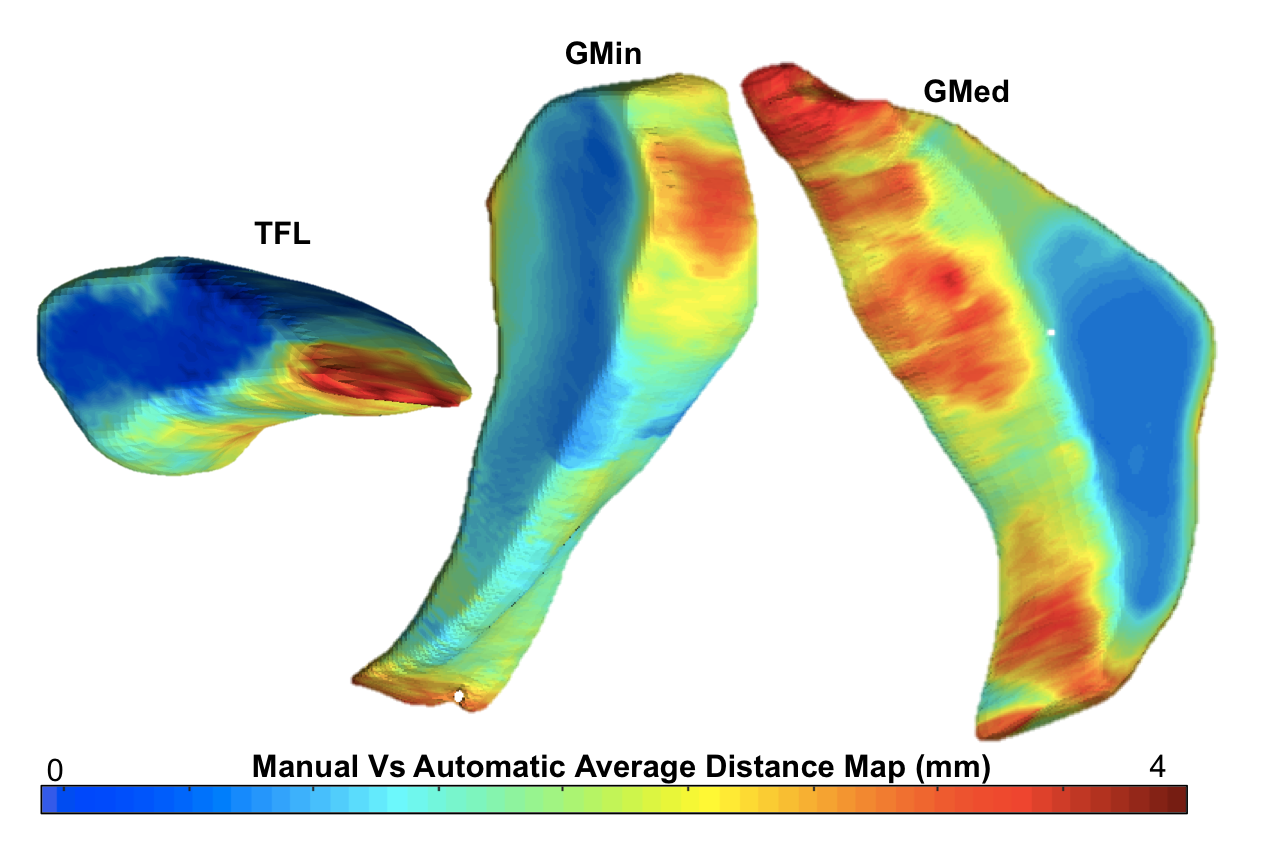
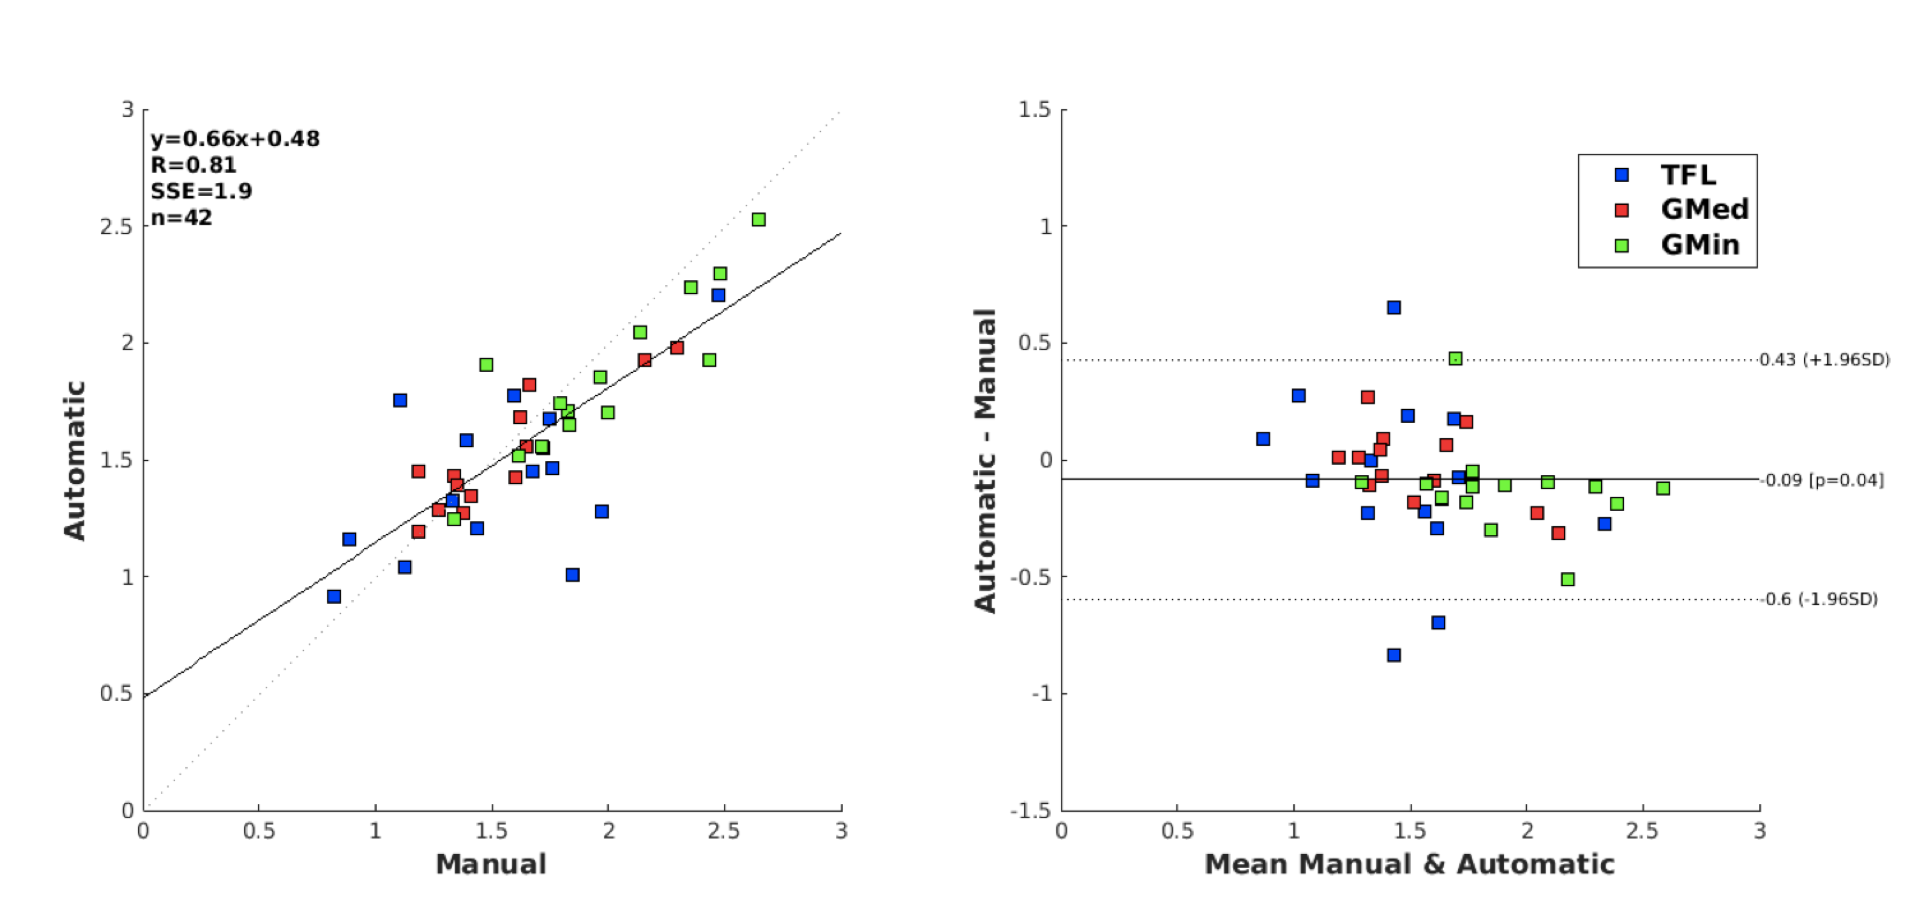
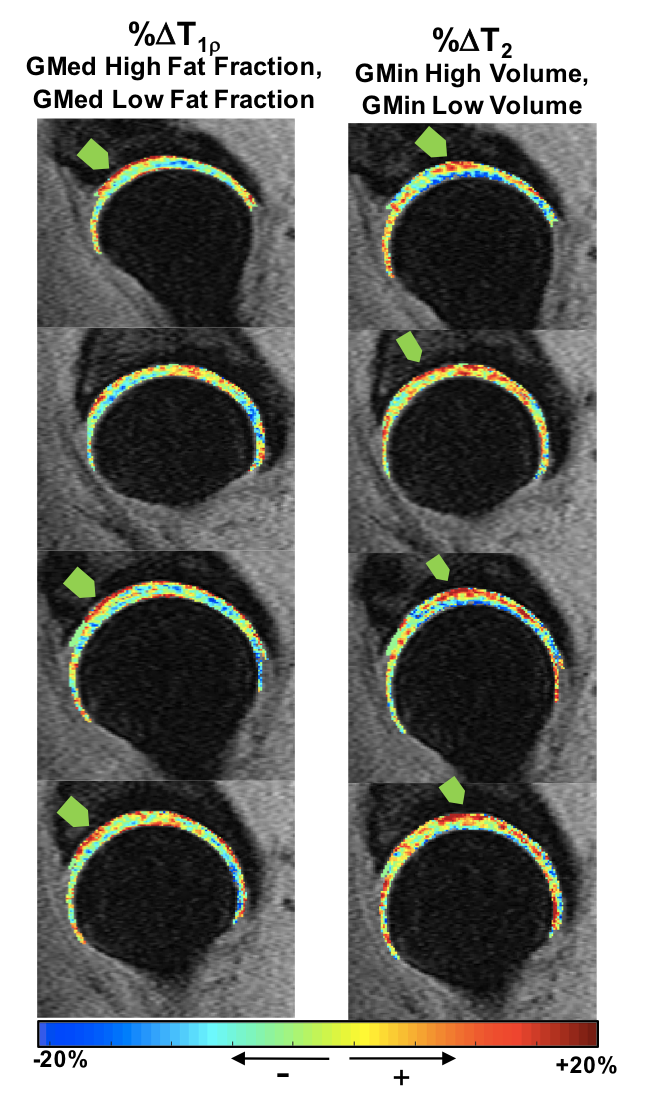
An example of the manual vs automatic segmentation can be seen in Figure 1 for each muscle. Mean dice coefficients for the test sets were 0.87, 0.87 and 0.84 and mean distances between the manual and automatic segmentations were 1.03, 1.92 and 1.97 mm for the TFL, GMed and GMin respectively. The average distance map is visualized in Figure 2. Fat fractions and volume correlation and Bland-Altman differences plots for each muscle can be visualized in Figure 3. R-values of 0.68, 0.90, 0.89 and intra-patient coefficient of variations (CV) of 20.17%, 9.14%, 12.97% were obtained for fat fractions in the 3 muscles. R-values of 0.83, 0.72 and 0.81 and intra-patient coefficient of variations (CV) of 11.61%, 8.12%, 9.19% were obtained for volumes in the 3 muscles. For associations with relaxation times, we found that 8.5% of the total voxels located in the deep anterior superior acetabulum cartilage showed significant T1ρ prolongation in subjects with higher GMed fat fraction (Figure 4-left), 7.4% of the total voxels located in the deep weight bearing acetabulum cartilage showed significant T2 prolongation in subjects with higher GMin volume (Figure 4-right).Discussion and Conclusion
This study demonstrated a feasible, reliable and fast method of automatically segmenting the hip abductor muscles and estimating their volumes and fat fractions and evaluating associations with voxel based relaxation times. Future studies will incorporate the fat fraction and the volume as a composite measure to study their effect on osteoarthritic patients.Acknowledgements
This project was supported by NIH-NIAMS grants R01AR069006 (SM/RS) and P50AR060752 (SM).References
1. Centers for Disease Control and Prevention. https://www.cdc.gov/arthritis/basics/osteoarthritis.htm
2. S̆irca Anton, and Sus̆ec-Michieli Majda. “Selective Type II Fibre Muscular Atrophy in Patients with Osteoarthritis of the Hip.” Journal of the Neurological Sciences, vol. 44, no. 2-3, 1980, pp. 149–159., doi:10.1016/0022-510x(80)90123-9.
3. Flack, Natasha Amy May Sparks, et al. “A Review of the Anatomy of the Hip Abductor Muscles, Gluteus Medius, Gluteus Minimus, and Tensor Fascia Lata.” Clinical Anatomy, vol. 25, no. 6, 2011, pp. 697–708., doi:10.1002/ca.22004.
4. Zacharias, A., et al. “Hip Abductor Muscle Volume in Hip Osteoarthritis and Matched Controls.” Osteoarthritis and Cartilage, vol. 24, no. 10, 2016, pp. 1727–1735., doi:10.1016/j.joca.2016.05.002.
5. Pedoia, Valentina, et al. “Study of the Interactions between Proximal Femur 3d Bone Shape, Cartilage Health, and Biomechanics in Patients with Hip Osteoarthritis.” Journal of Orthopaedic Research, Nov. 2017.
6. Milletari, Fausto, et al. “V-Net: Fully Convolutional Neural Networks for Volumetric Medical Image Segmentation.” 2016 Fourth International Conference on 3D Vision (3DV), 2016, doi:10.1109/3dv.2016.79.
7. Reeder, Scott B., et al. “Quantitative Assessment of Liver Fat with Magnetic Resonance Imaging and Spectroscopy.” Journal of Magnetic Resonance Imaging, vol. 34, no. 4, 2011, doi:10.1002/jmri.22775. 8. Pedoia, Valentina, et al. “Fully Automatic Analysis of the Knee Articular cartilageT1ρrelaxation Time Using Voxel-Based Relaxometry.” Journal of Magnetic Resonance Imaging, vol. 43, no. 4, July 2015, pp. 970–980., doi:10.1002/jmri.25065.
9. Russell, Colin, et al. “Baseline Cartilage Quality Is Associated with Voxel-based T1ρ and T2 following ACL Reconstruction: A Multicenter Pilot Study.” Journal of Orthopaedic Research, vol. 35, no. 3, Oct. 2016, pp. 688–698., doi:10.1002/jor.23277.
Figures