1265
The novel visualization technique of fast and slow muscle fibers using q-space imaging: Clinical study1Department of Orthopedic Surgery, Keio University School of Medicine, Tokyo, Japan, 2RIKEN Brain Science Institute, Saitama, Japan, 3Central Institute for Experimental Animals, Kanagawa, Japan, 4Department of Physiology, Keio University School of Medicine, Tokyo, Japan, 5Institute for Integrated Sports Medicine, Keio University School of Medicine, Tokyo, Japan, 6Department of Clinical Biomechanics, Keio University School of Medicine, Tokyo, Japan
Synopsis
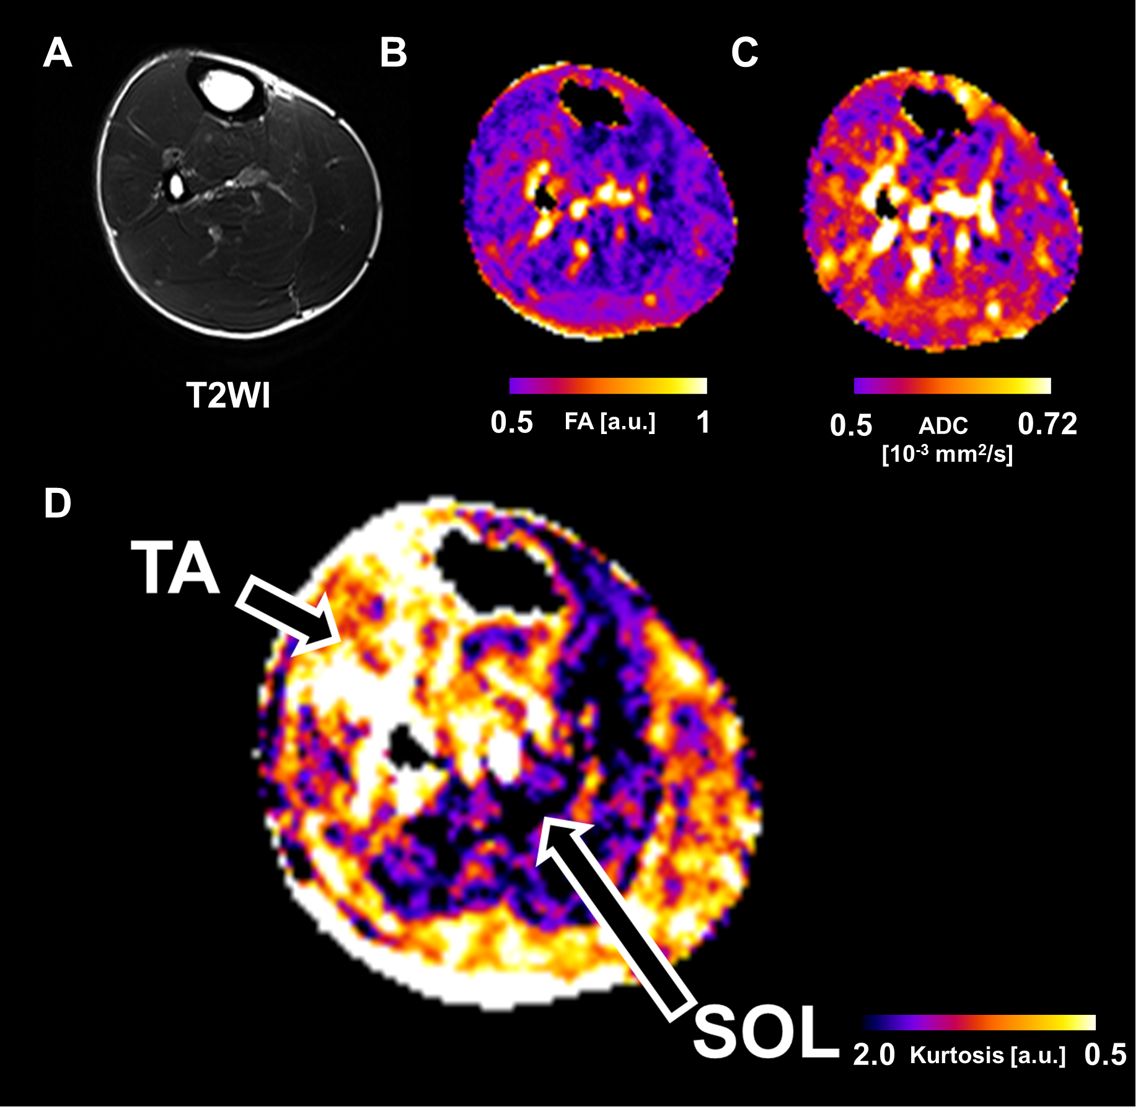
Skeletal muscles include fast and slow muscle fibers. However, a non-invasive approach for appropriately investigating the characteristics of muscles is not available. The present study aimed to determine whether q-space imaging can distinguish between fast fiber dominant tibialis anterior muscle (TA) and slow fiber dominant soleus muscle (SOL). T2WI, FA and ADC maps could not represent the difference between TA and SOL. On the other hand,
INTRODUCTION:
Skeletal muscles include fast and slow muscle fibers. However, a non-invasive approach for appropriately investigating the characteristics of muscles is not available. The types of muscle fibers are based on the myosin heavy chain (MHC) isoform compartment and include 1 slow type (MHC I) and multiple fast types (MHC IIa, MHC IIb, MHC IId, and MHC IIx) 1. The tibialis anterior muscle (TA) and soleus muscle (SOL) of the calf have been widely used in physiological and pathological studies in animals and humans 2. The TA is mainly composed of fast fibers, while the SOL is mainly composed of slow fibers 2. Monitoring of skeletal muscle characteristics can help in the evaluation of the effects of strength training and diseases on skeletal muscles. q-space imaging (qsi) is a quantitative diffusion-weighted magnetic resonance imaging (MRI) procedure that makes it possible to detect delicate changes in the microstructure of environments in which free water movement is restricted 3. The present study aimed to determine whether qsi can distinguish between fast and slow fibers in a clinical study.METHODS:
We acquired MRI in 10 volunteers using 3-Tesla MRI (MAGNETOM Skyra system, Siemens Healthcare, Erlangen, Germany). T2 weighted imaging (T2WI) and qsi were performed with a field of view of 275 mm × 400 mm, matrix of 176 × 256, and section thickness of 6 mm. There were ten b-values ranging from 0 to 4000 s/mm2, and each b-value had diffusion encoding in six directions. kurtosis map was obtained. In addition, Fractional anisotropy (FA) map and apparent diffusion coefficient (ADC) map calculated by diffusion tensor imaging (DTI) were composed using b800 images of qsi. The difference between TA and SOL was examined to use FA, ADC and kurtosis maps.
RESULTS:
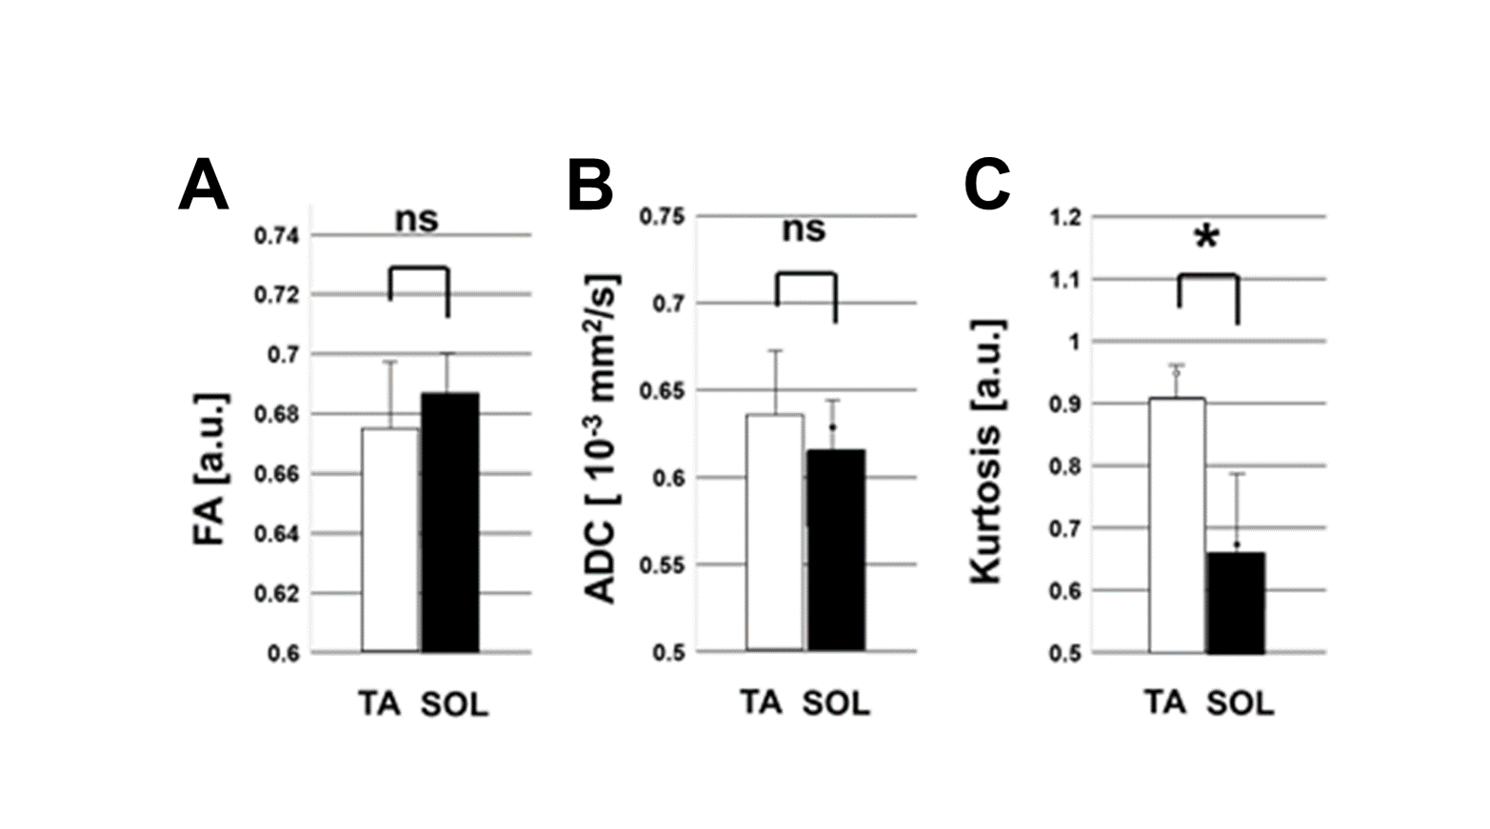
T2WI, FA and ADC maps could not represent the difference between TA and SOL (Figure 1A-C). On the other hand, Kurtosis map could visualize the characteristics of TA and SOL (Figure 1D). In quantification, kurtosis map could visualize the difference between TA and SOL (p<0.05) which could not be performed by FA and ADC (Figure 2A-C).
DISCUSSION:
In the animal study, by focusing on cell size, a significant difference was noted between the TA and SOL on qsi 5. Our findings indicate that high FWHM and low kurtosis values are characteristic of the TA, while low FWHM and high kurtosis values are characteristic of the SOL. A previous histological study reported that among MHC I, MHC IIa, MHC IIb, and MHC IId/x cells, MHCIIb cells were the largest, followed by MHC IId/x, MHC IIa, and MHC I cells 4. Additionally, MHC I cells were predominant in the SOL, while MHC II cells were predominant in the TA 4. These findings indicate that the fast fiber-dominant TA generally has a large cell diameter, while the slow fiber-dominant SOL generally has a small cell diameter. In this clinical study, we succeeded in imaging the difference between TA and SOL.SIGNIFICANCE:
qsi could clearly differentiate fast muscle fibers from slow muscle fibers using differences in cell diameters. This technique is a promising method to non-invasively estimate the fiber type ratio in skeletal muscles, and it can be further developed as an indicator of muscle characteristics.Acknowledgements
This study has received funding by Japan Agency for Medical Research and Development (Award Number: JP17lm0203004j0001)References
1: Pette, D. Res. Tech. (2000). 2: Punkt, K. Acta Histochem. (1998). 3: Callaghan, P. T. Nature (1991). 4 Delp, M. Appl. Physiol. (1996). 5: Hata, J. PLoS One (2018) under review.Figures