1263
Creatine CEST at 3T following in magnet exercise shows differences in heart failure patients with preserved ejection fraction compared to healthy and hypertensive controls1CMROI, University of Pennsylvania, Philadelphia, PA, United States, 2Division of Cardiovascular Medicine, Hospital of the University of Pennsylvania, Philadelphia, PA, United States, 3Division of Endocrinology and Diabetes, Children's Hospital of Philadelphia, Philadelphia, PA, United States
Synopsis
Exercise intolerance is a hallmark of heart failure. Here, we have shown for the first time that parameters derived from ROI-based analysis of creatine-weighted CEST signals following exercise can be used to distinguish HFpEF patients from HTN and healthy controls. Identifying these group differences is uniquely possible because CrCEST can measure muscle specific metabolism with high spatial resolution and sensitivity.
Introduction
Exercise intolerance is a hallmark of heart failure, though the specific contribution of metabolic abnormalities in skeletal muscle is not yet understood and difficult to characterize.1
Creatine-weighted CEST (CrCEST) has been shown to probe the creatine kinase reaction, providing complementary information to 31-P MRS of phosphocreatine.2 Unlike 31-P MRS, CrCEST can obtain high spatial resolution metabolic maps with acceptable temporal resolution.
Methods
Creatine-weighted CEST data was acquired before and after in magnet exercise in 14 heart failure patients with preserved ejection fraction (HFpEF), 17 subjects with hypertension (HTN), and 19 age-matched healthy controls at 3T using a 15-channel Tx/Rx knee coil with previously described protocol.3 The calf muscle was manually segmented into lateral gastrocnemius (LG), medial gastrocnemius (MG), soleus (Sol), peroneus longus (Per), tibialis anterior (TA), tibialis posterior (TP), and extensor digitorum longus (EDL) from a reference image without saturation covering the same slice.
Analysis was performed over each ROI as well as globally over the entire muscle and looked at baseline MTR asymmetry values before exercise, increase to maximal CEST signal after exercise, initial slope of the MTR asymmetry recovery curve, and time to 50% recovery. The slope was taken from the first two time points of recovery, and the time to 50% recovery was estimated after spline interpolation of the recovery curve. Each ROI was considered with restriction to only those pixels that showed an increase in CEST signal, restriction to pixels that showed increase >2%, and no restriction. One-way ANOVA was performed on each of variable over each restriction. For the global ROI, only the second restriction was considered. A multivariate ANOVA analysis was run on the subset of variables from the LG, MG, Sol, and Per as well as the global ROI excluding baseline.
Results
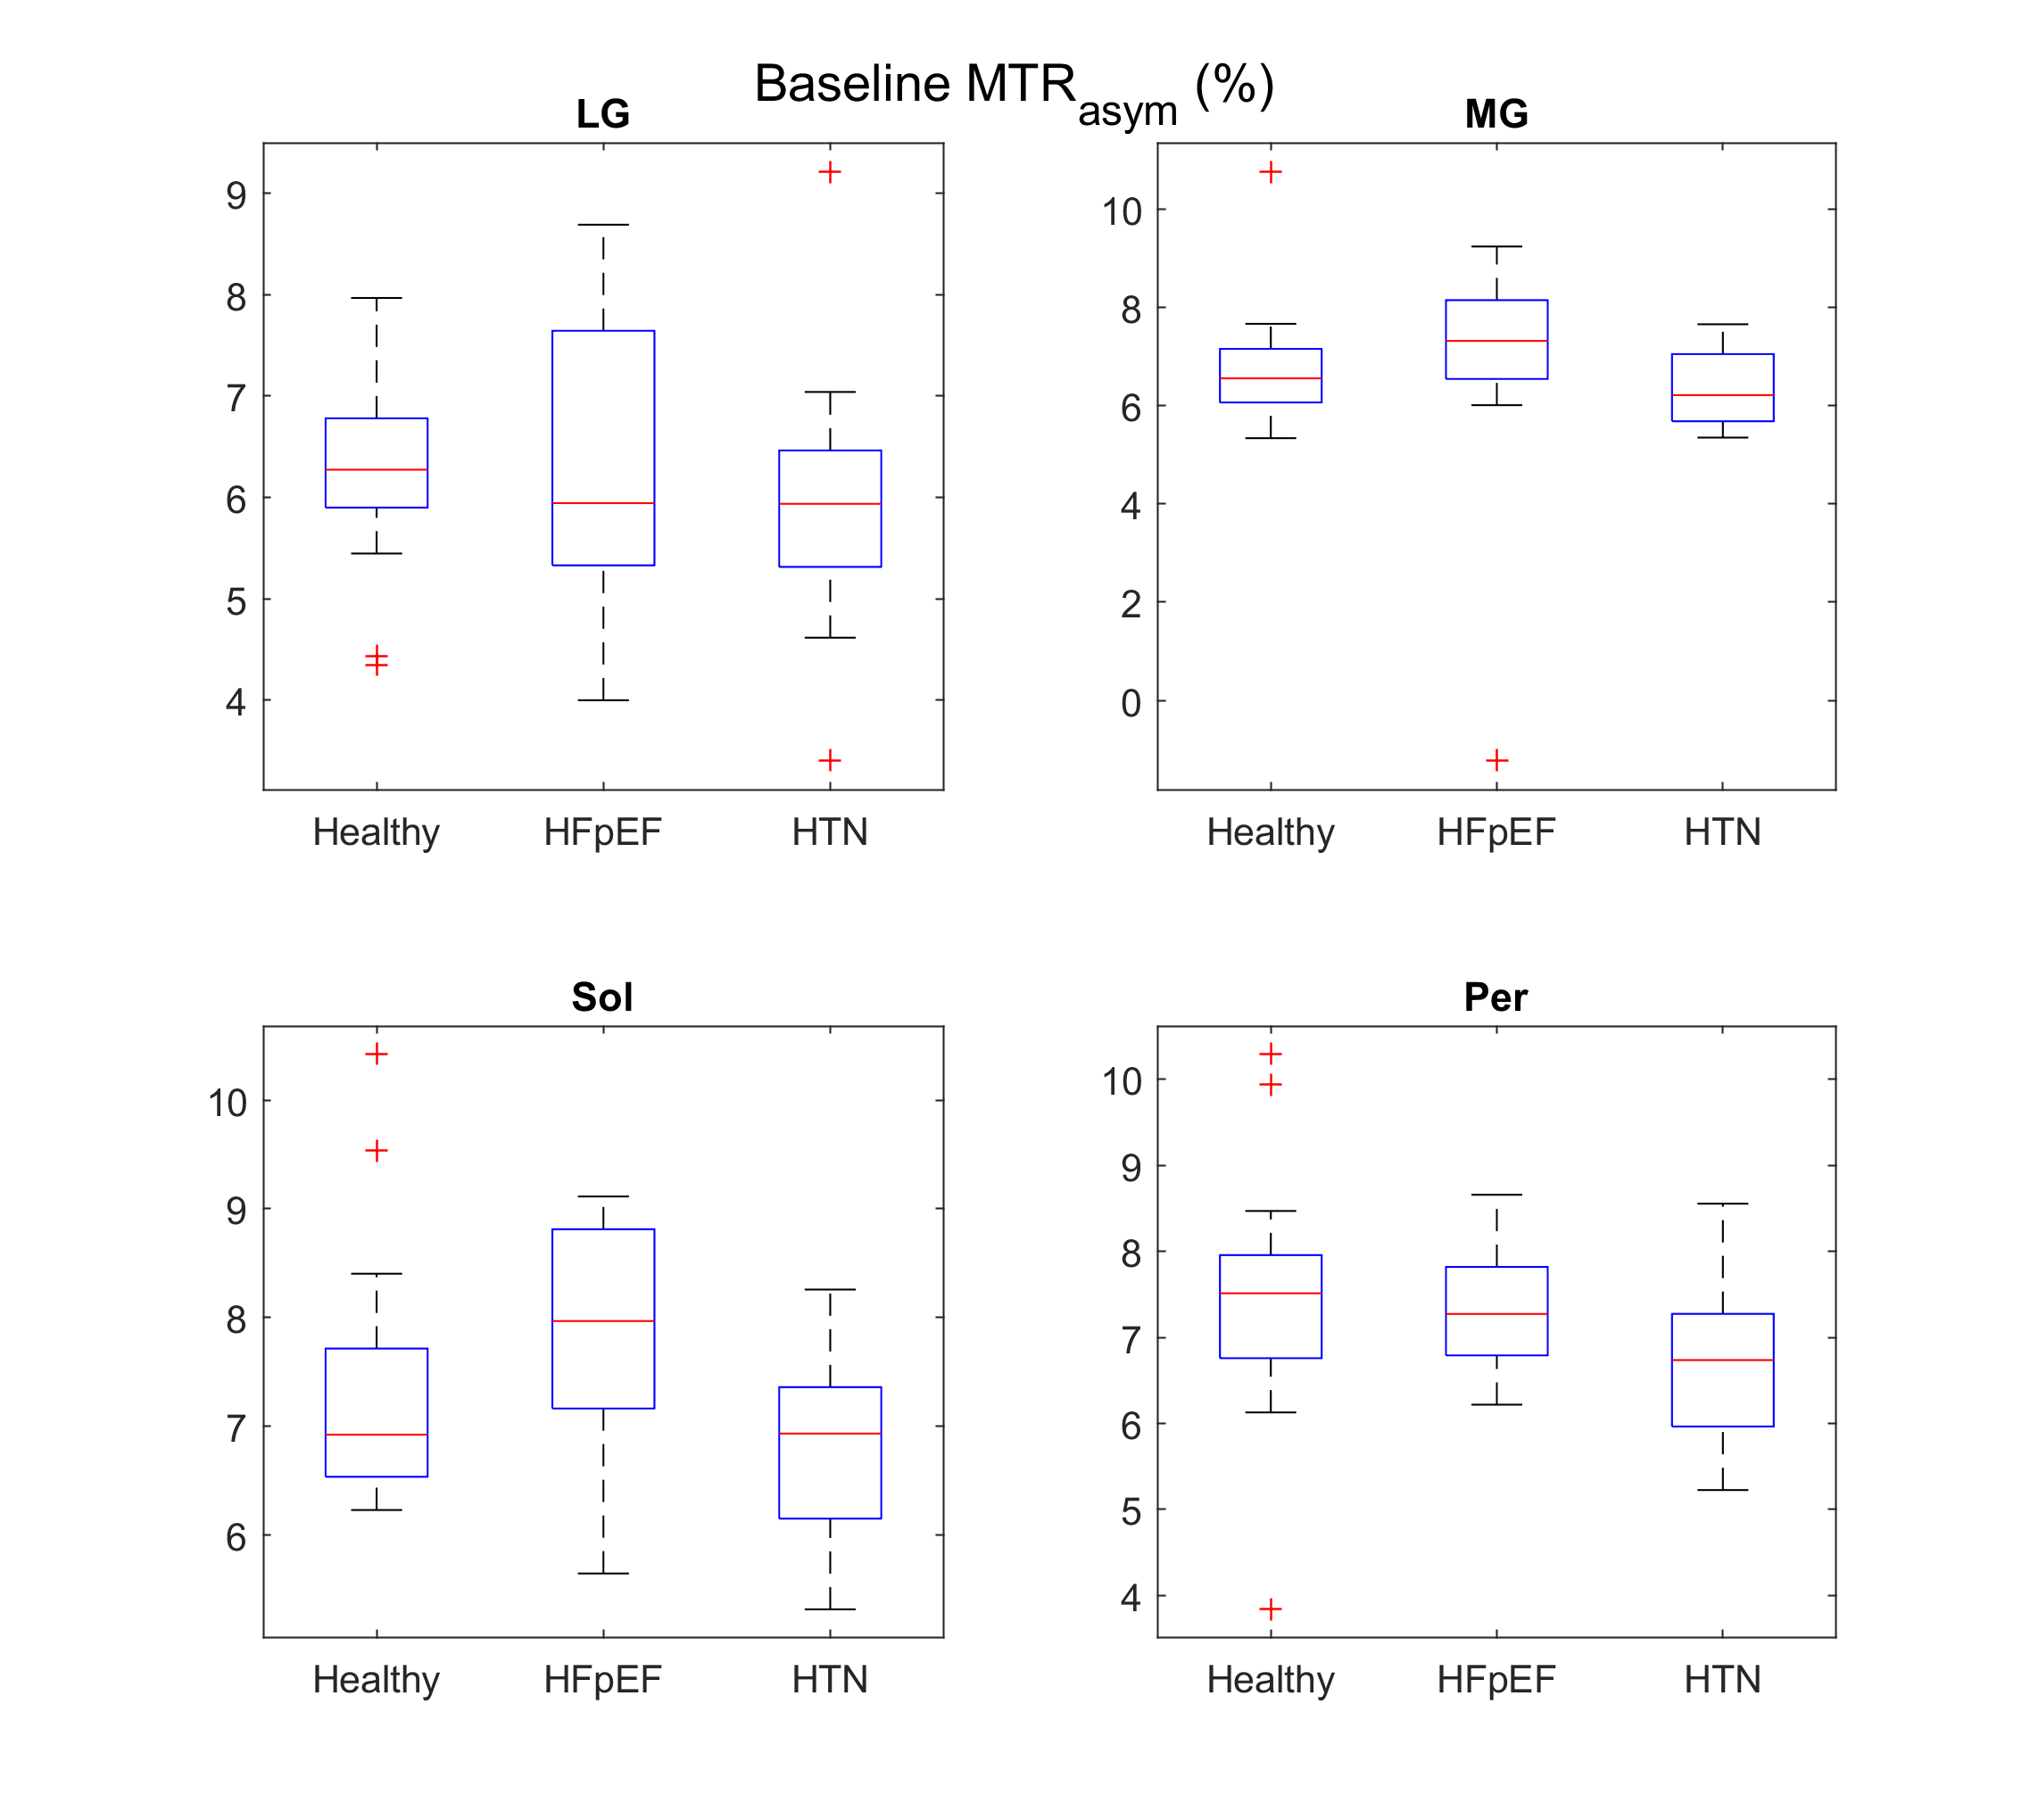
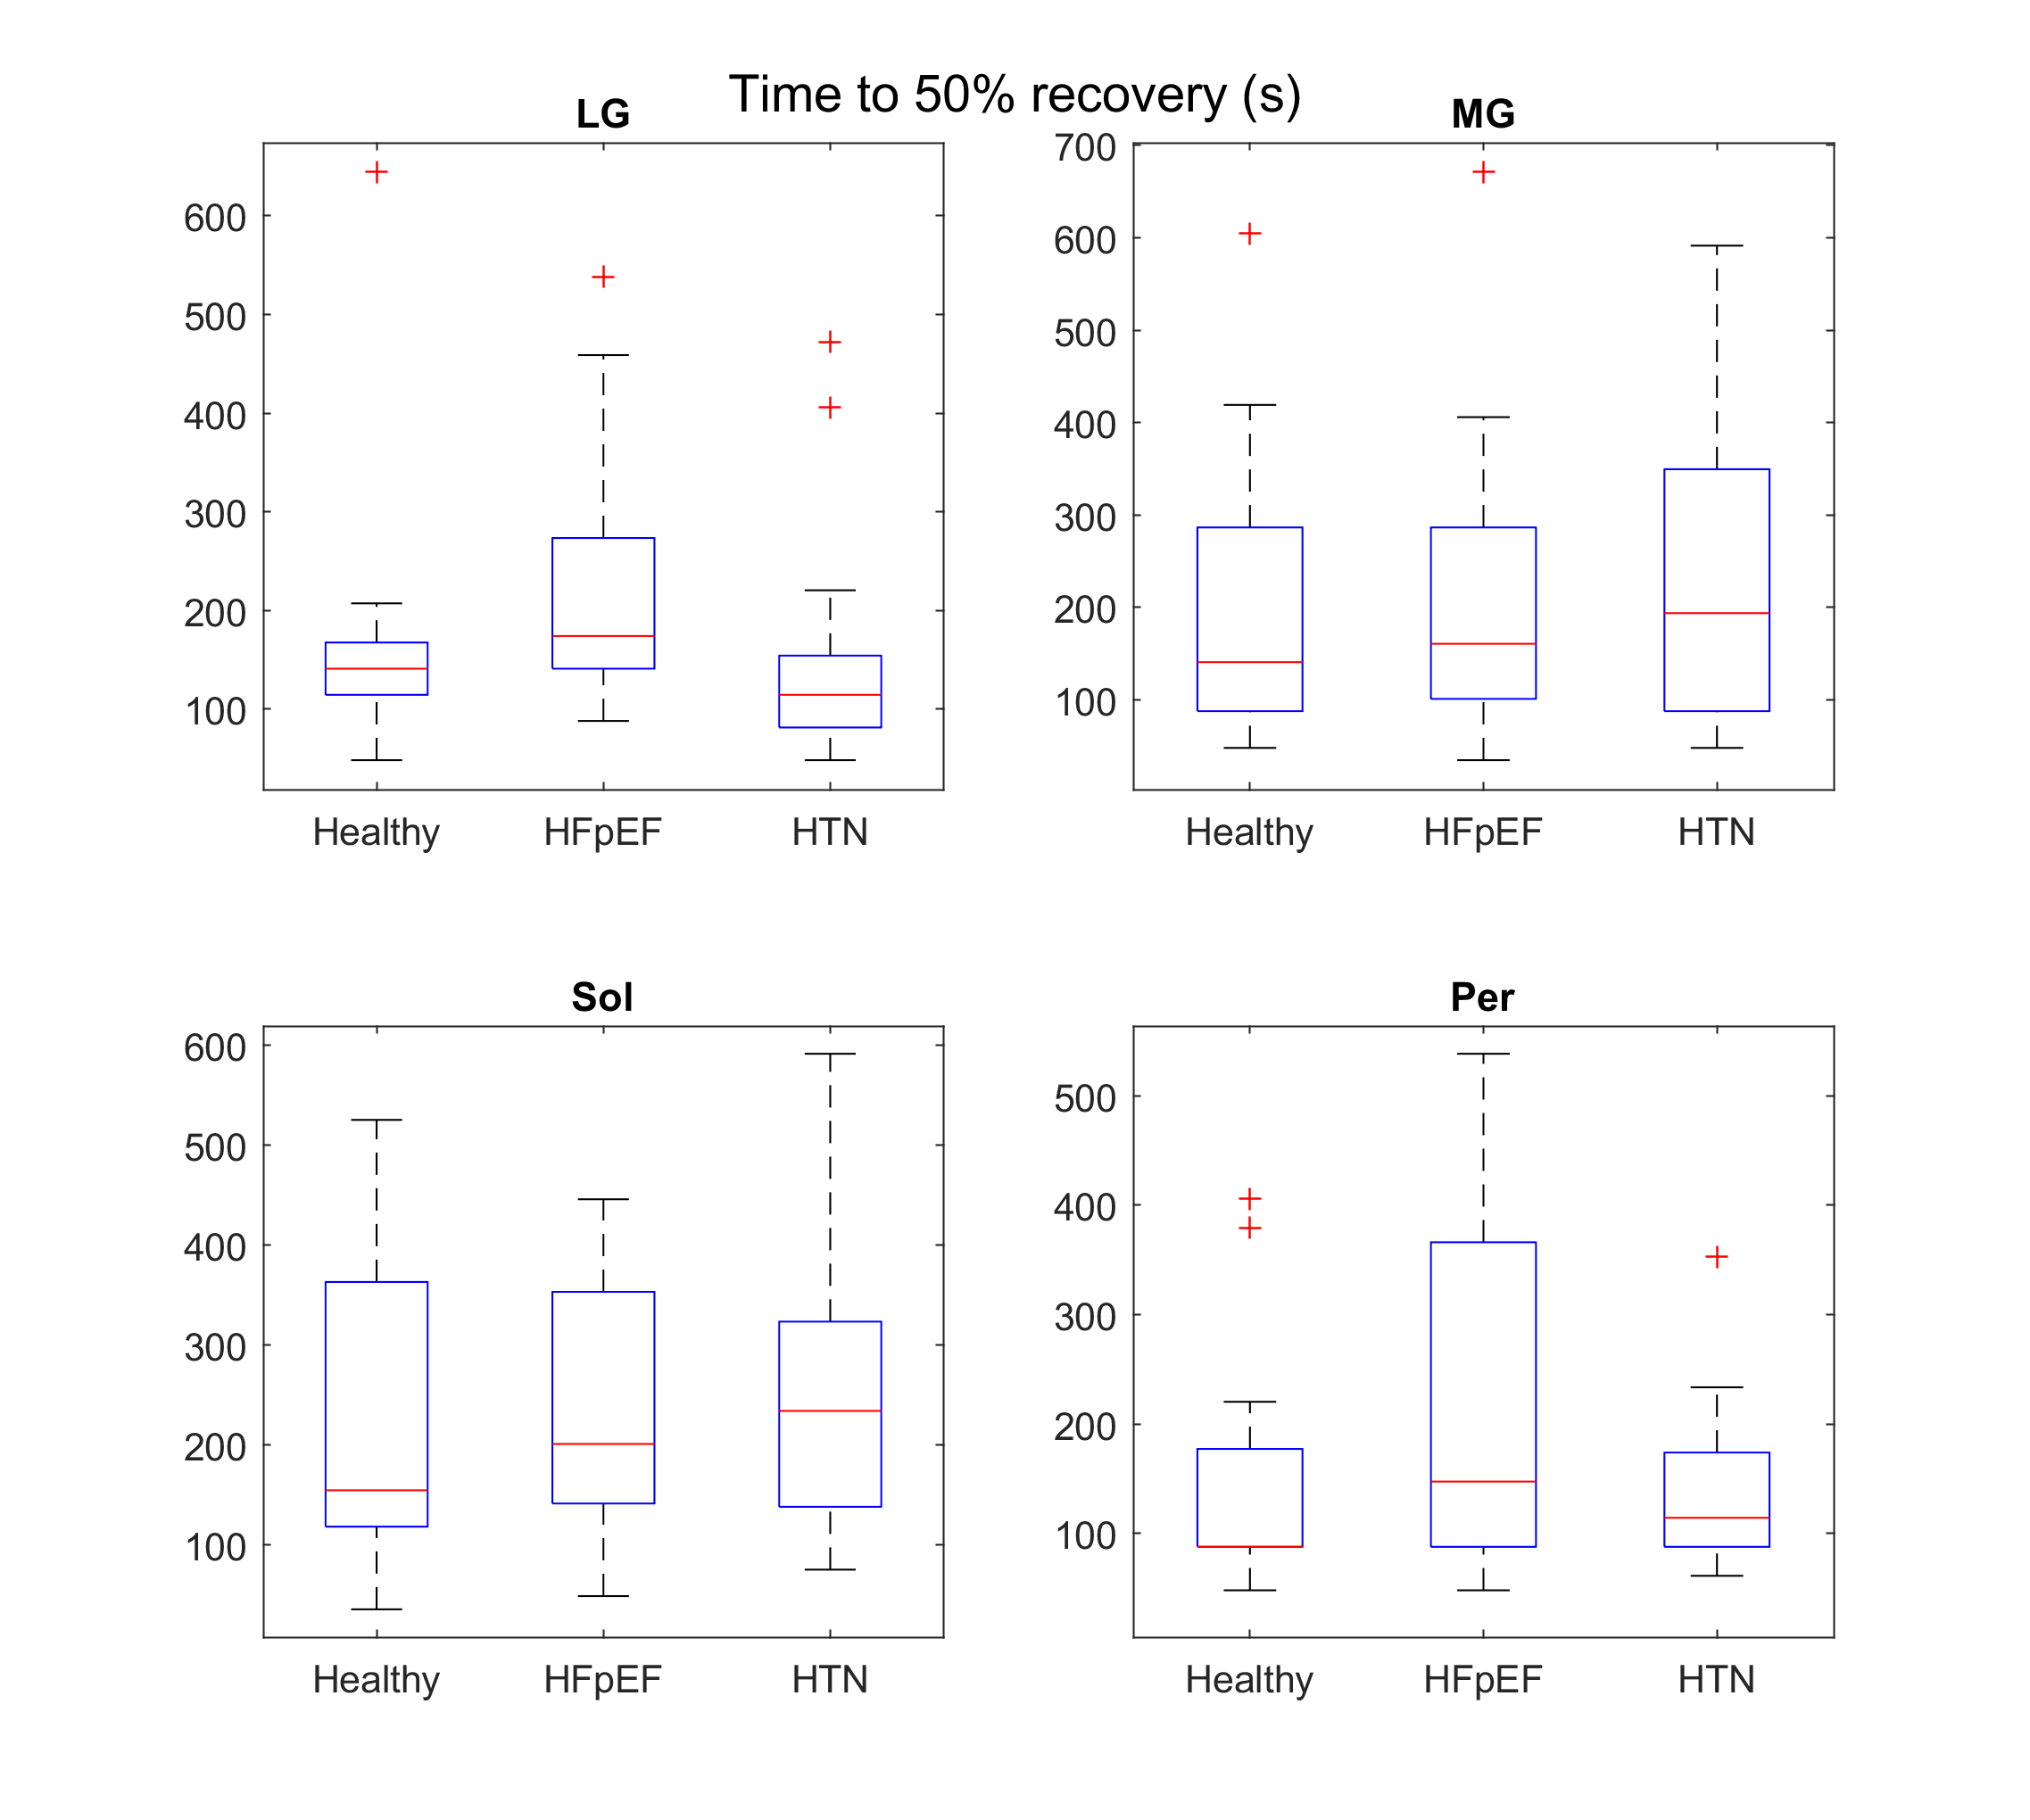
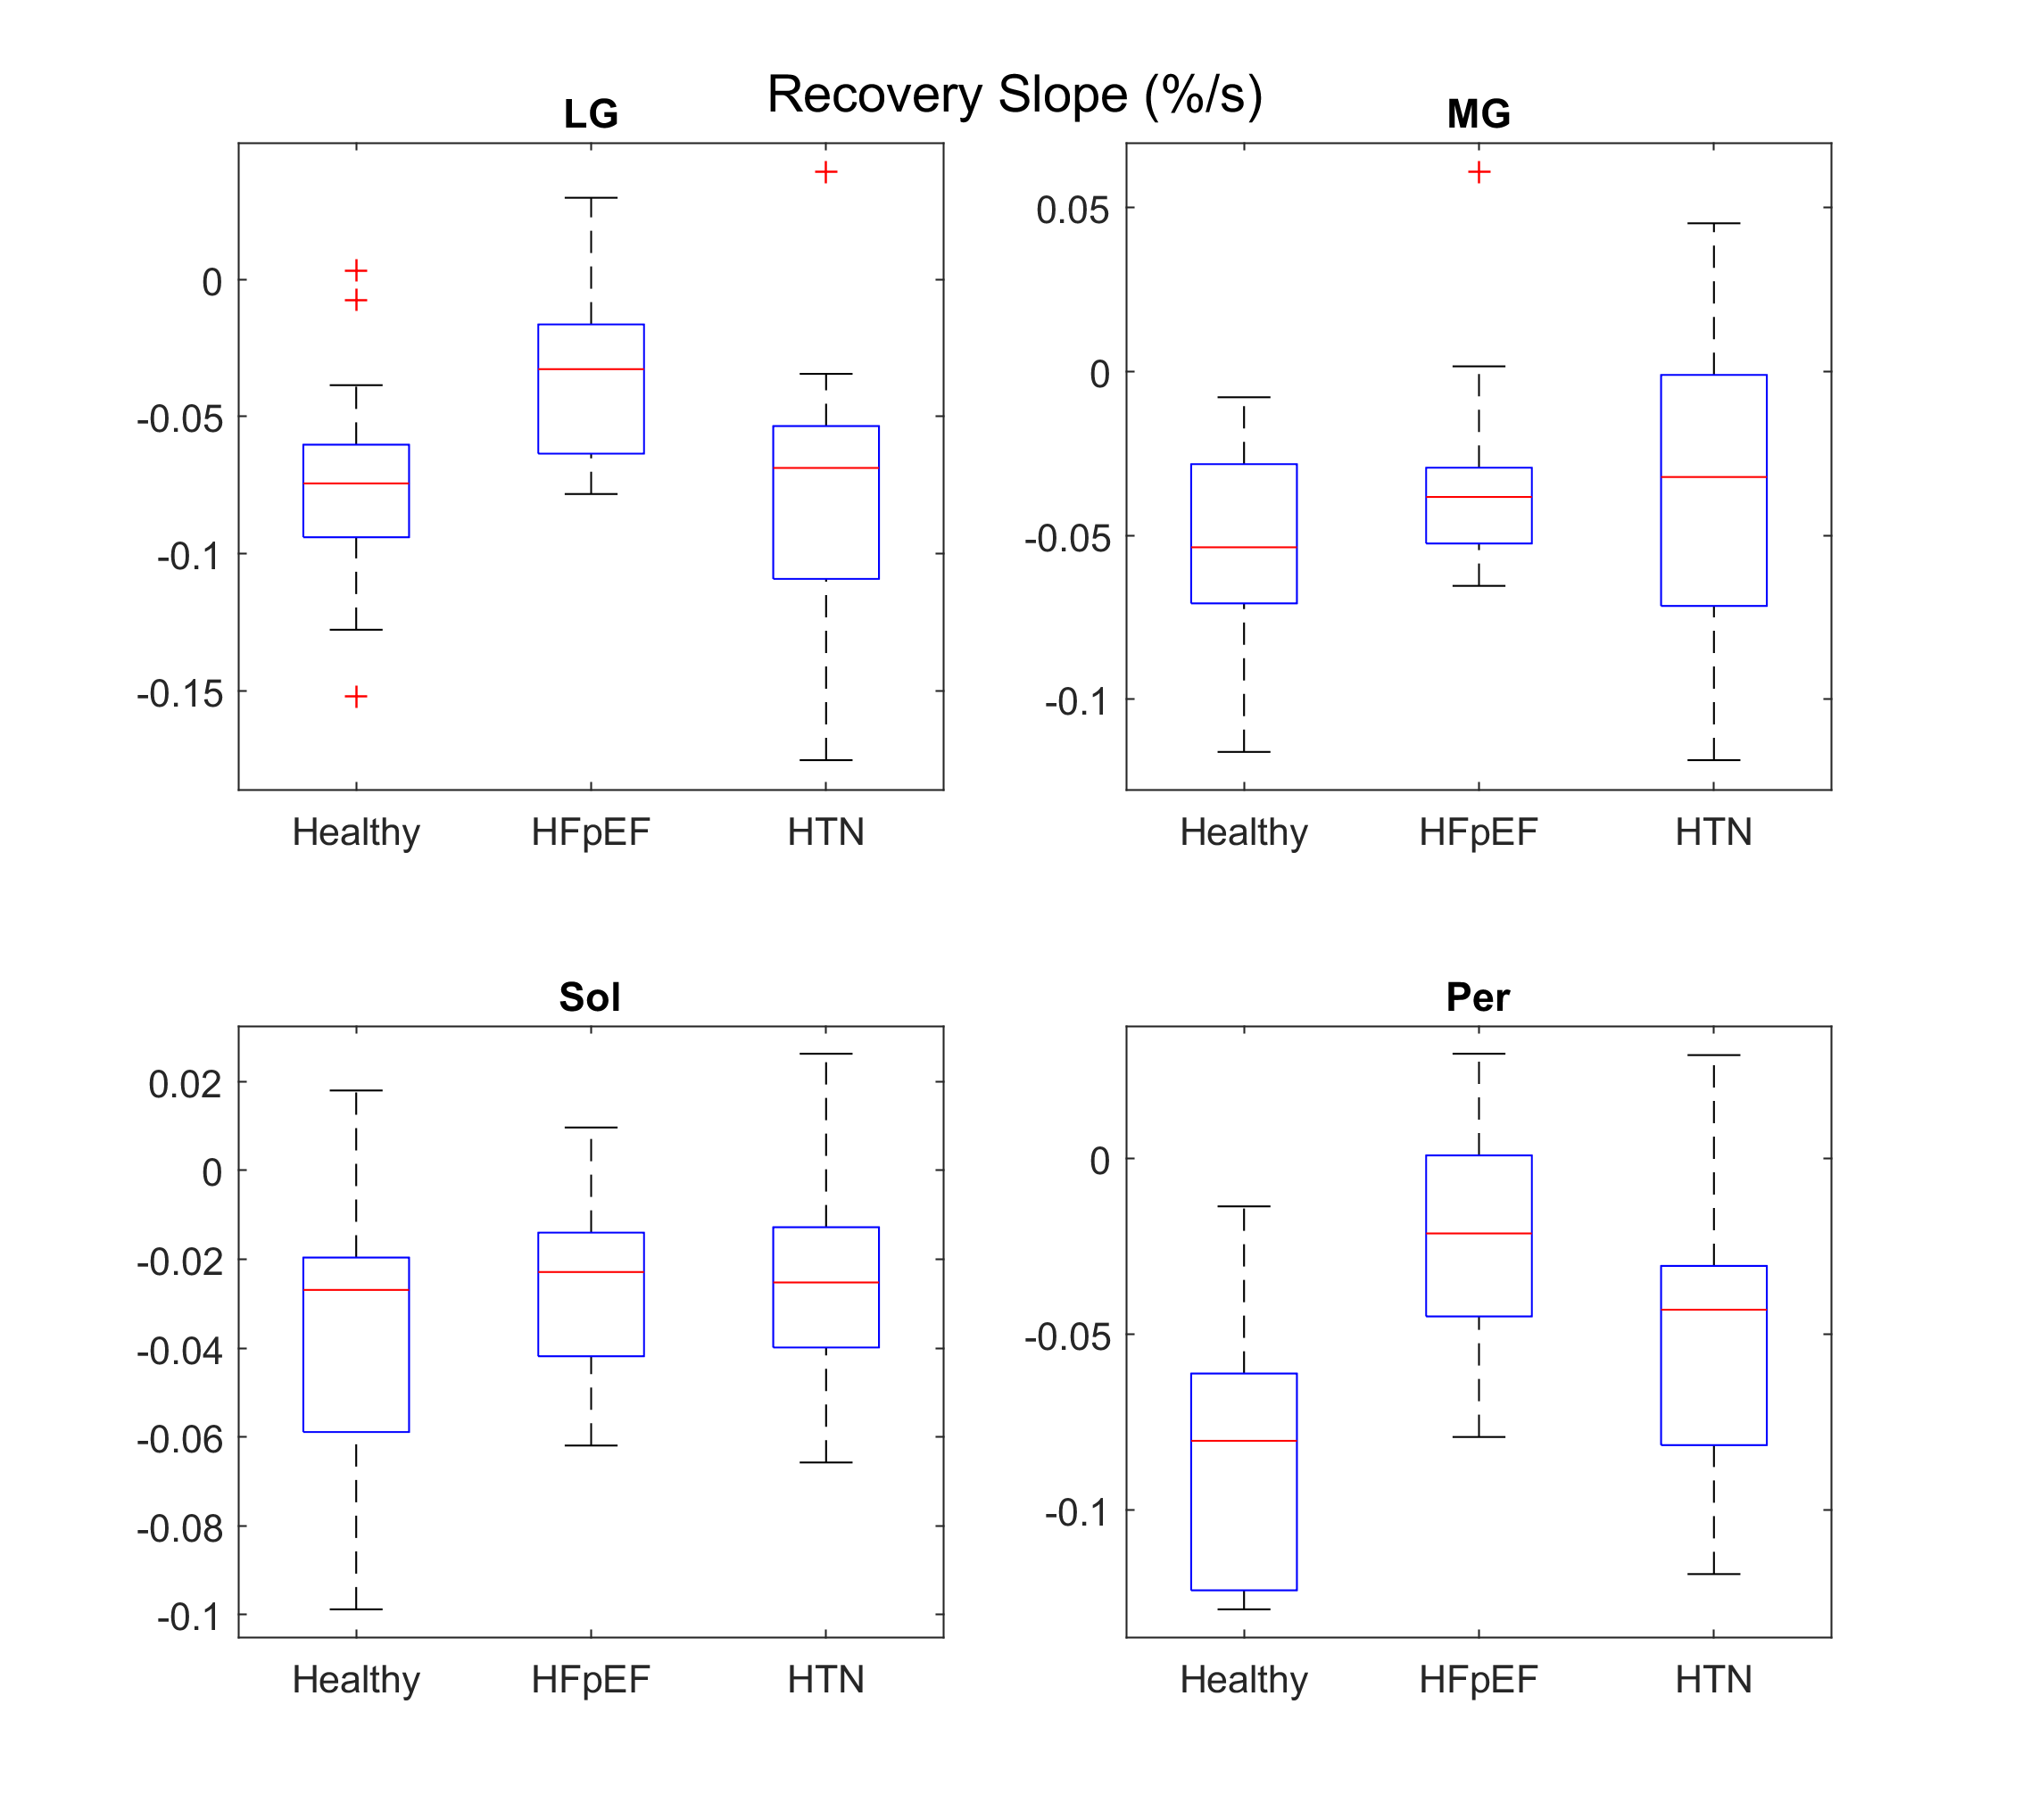
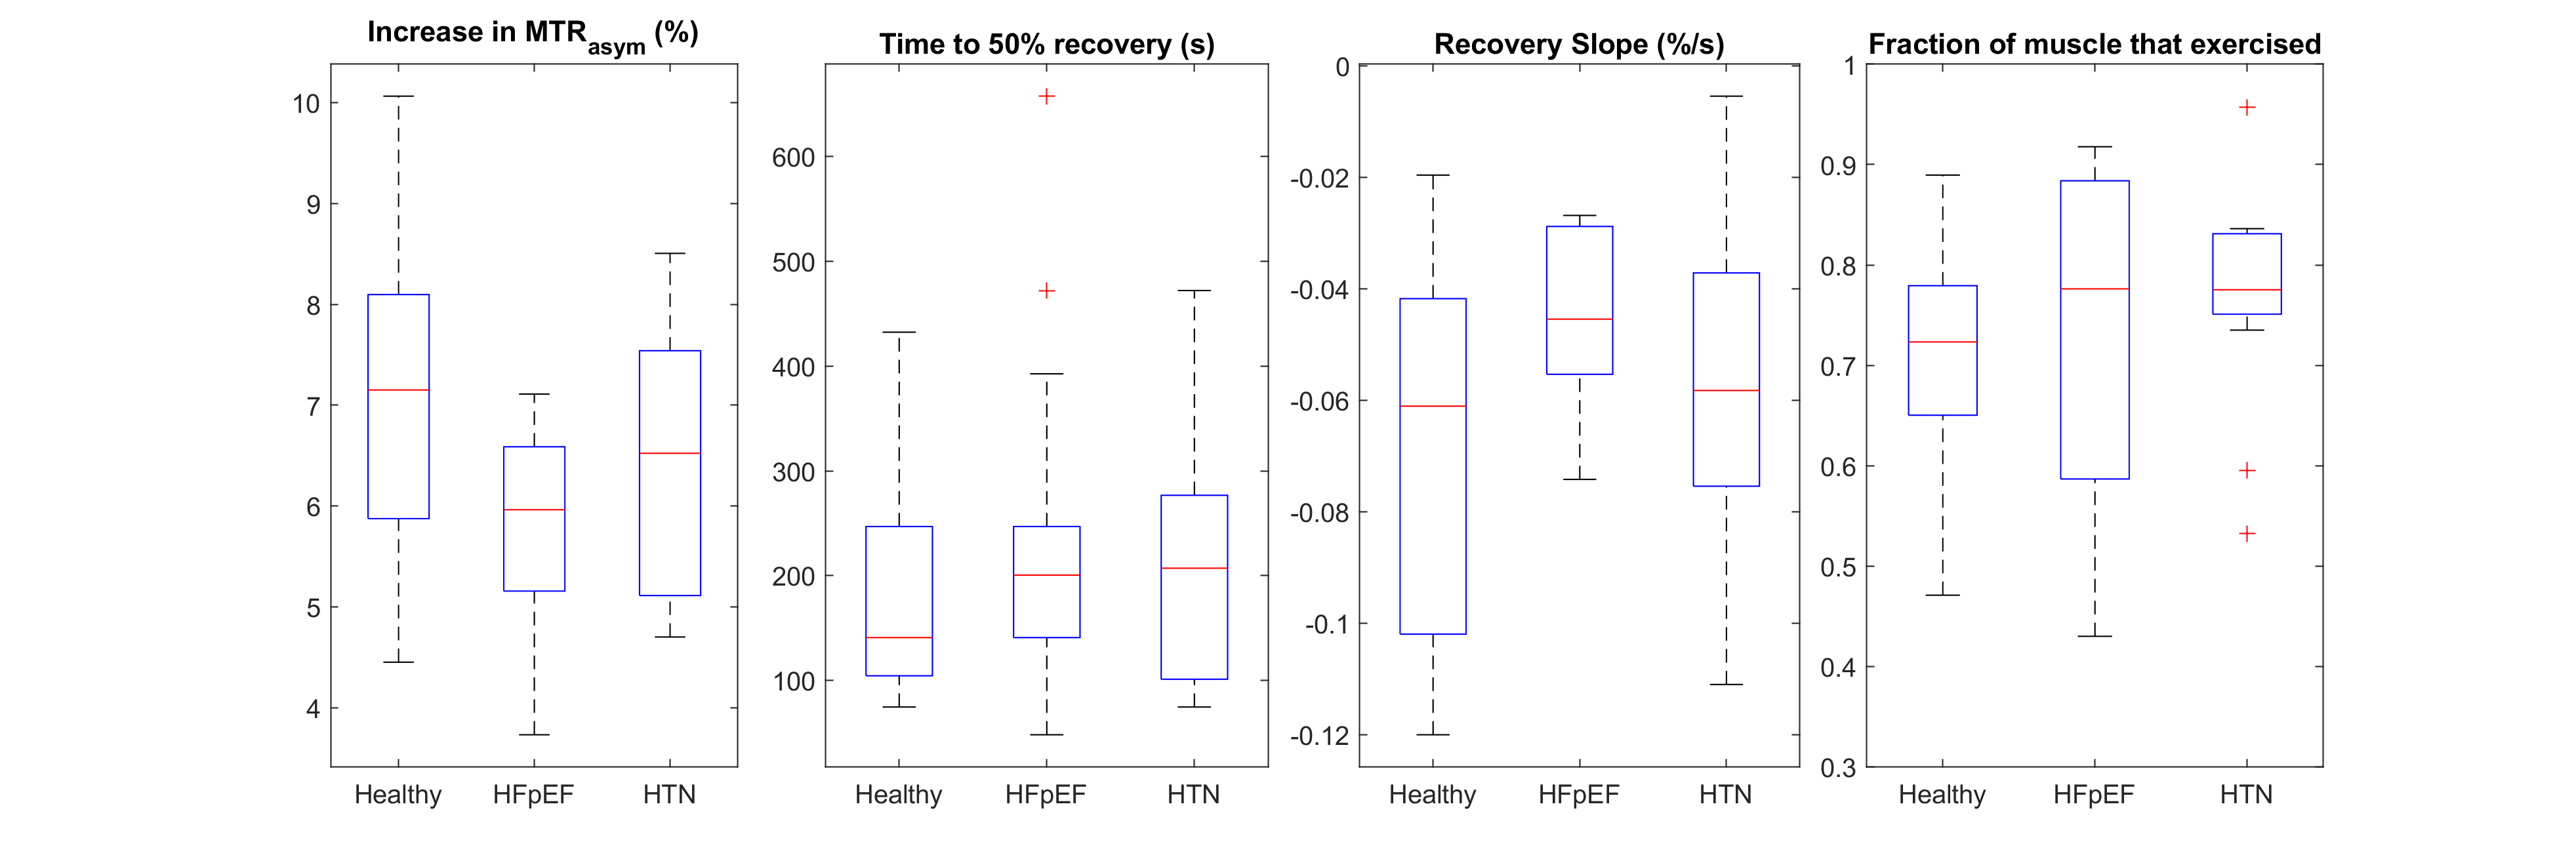
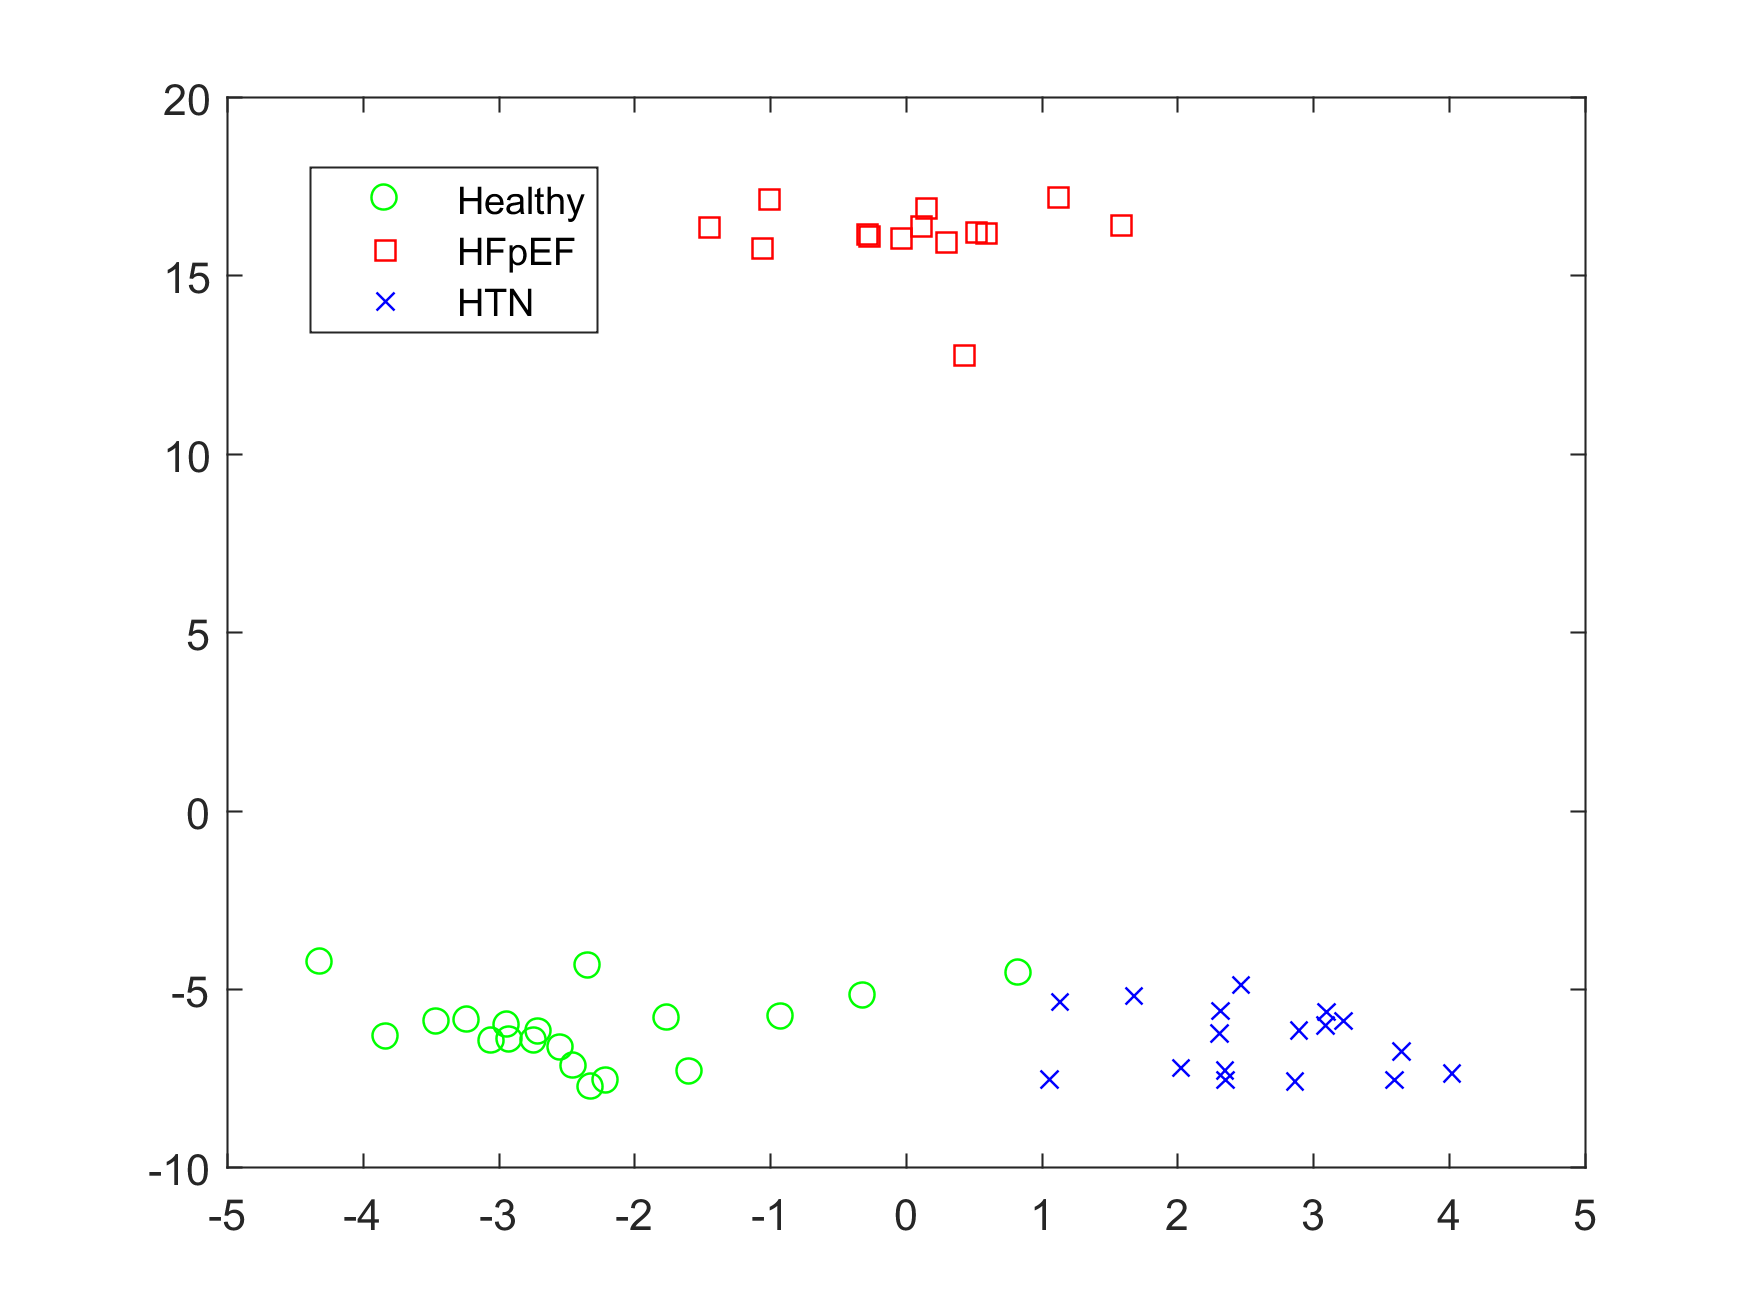
Figure 1 shows the baseline CEST signal in each of the four ROIs. While no significant differences are observed in most cases, HFpEF patients did exhibit significantly higher signal in the soleus muscle. Figure 2 shows the time for half recovery in each ROI. Though trends towards longer recovery are observed, no significant differences are recorded because of the large range of values. Figure 3 shows the initial slope of the recovery curve. Here, significant differences are found in the LG and Per, with HFpEF patients having a flatter, slowly-recovering slope. Figure 4 shows the measurements over the global ROI restricted to pixels that increased in MTR asymmetry by 2%. Figure 5 shows the subject groups over a plane defined by two orthogonal linear combinations of the variable set. The three groups are well separated.Discussion
Though we segmented the entire calf muscle, ROI analysis was performed only on four muscle groups for reliability. The EDL muscle had large standard errors because of its relatively small size in the chosen slice, the TP muscle signal was influenced by the major veins/arteries running down the center of the leg, and the TA muscle activation depended mostly on how the subject exercised.
Previous work using CrCEST in mitochondrial disease patients looked at baseline signals and recovery time constants assuming a single exponential decay recovery model.4 We have preferred a model free characterization of signal increase/recovery as the exponential model did not appear appropriate for certain recovery curves and resulted in poor fits or non physically believable values, and the chosen parameters are easily derived from the acquired data.
The slope of the recovery curve was found to be the more useful in terms of separating groups than the recovery time, having smaller variance within groups and greater differentiation between groups for the most part. This is because the slope is effectively the reciprocal recovery time normalized by the signal increase, and this normalization reduces the confounding nature of subject compliance with the exercise protocol.
ROIs were restricted to only include pixels in muscle that were activated. Since we are only interested in activated muscles (except for at baseline), this idea is justified and has the effect of reducing the influence of inactive muscle which tends to pull the signals towards baseline for each group.
A lower increase in CEST signal along with a larger fraction of exercised muscle was observed in HFpEF globally. This suggests an entirely different recruitment of muscles for exercise, though data is not yet conclusive.
Conclusion
We have shown for the first time that variables derived from CrCEST following exercise can be used to separate HFpEF from HTN and healthy controls. That result is uniquely possible because CrCEST can measure muscle specific metabolism with high spatial resolution and sensitivity.Acknowledgements
Research reported in this publication was supported by the National Heart, Lung and Blood Institute of the National Institutes of Health under awards Number R01HL121510 and K23HL130551 as well as the National Institute of Biomedical Imaging and Bioengineering under award Number P41EB015893.References
1. Kitzman, Dalane W., et al. "Exercise intolerance in patients with heart failure and preserved left ventricular systolic function: failure of the Frank-Starling mechanism." Journal of the American College of Cardiology 17.5 (1991): 1065-1072.
2. Kogan, Feliks, et al. "Method for high‐resolution imaging of creatine in vivo using chemical exchange saturation transfer." Magnetic resonance in medicine 71.1 (2014): 164-172.
3. Kogan, Feliks, et al. "In vivo chemical exchange saturation transfer imaging of creatine (CrCEST) in skeletal muscle at 3T." Journal of Magnetic Resonance Imaging 40.3 (2014): 596-602.
4. DeBrosse, Catherine, et al. "Muscle oxidative phosphorylation quantitation using creatine chemical exchange saturation transfer (CrCEST) MRI in mitochondrial disorders." JCI insight 1.18 (2016).
Figures