1262
Evaluation of Muscle Degeneration in Amyotrophic Lateral Sclerosis Patients Using MR Cytography1Neuroimaging Research, Barrow Neurological Institute, Phoenix, AZ, United States, 2Research-ALS, Barrow Neurological Institute, Phoenix, AZ, United States, 3Neurology, Barrow Neurological Institute, Phoenix, AZ, United States
Synopsis
Amyotrophic lateral sclerosis (ALS) is a fatal neurodegenerative disease that affects motor neurons resulting in progressive muscle atrophy. The heterogeneous nature of disease progression has limited the reliability and robustness of current clinical indicators used in disease monitoring. To address the need for reproducible, quantitative biomarkers, we propose the applicability of Magnetic Resonance Cytography (MRC) to characterize ALS induced changes to muscle myofiber microstructure. In this clinical study, the role of MRC as a potential biomarker was demonstrated by identifying changes to muscle cytoarchitecture in the lower extremities among ALS patients when compared with healthy muscle.
Introduction
Amyotrophic lateral sclerosis (ALS) is a neurodegenerative disease characterized by loss of upper and lower motor neurons (UMN and LMN), resulting in muscle atrophy and eventual death. Despite the knowledge of disease characterization, the mean diagnostic delay is about 12 months. Currently, clinical indicators such as ALS functional rating scale (ALSFRS), electromyography (EMG), and muscle strength tests are used as downstream indicators of disease status. However, the reliability of these measures can be confounded by inter-rater variability and low sensitivity owing to heterogeneity of ALS progression. Therefore, there is an immediate need for sensitive, non-invasive, and quantitative biomarkers that can serve as surrogates to the clinical measures to better understand the underlying disease pathophysiology and be used as indicators of treatment response. Magnetic Resonance imaging Cytography (MRC) is a noninvasive imaging technique that is sensitive to abnormal tissue cytoarchitecture1, as demonstrated by simulations and in pre-clinical and clinical brain tumor studies. In this work, we demonstrate the applicability of MRC in detecting abnormal muscle cytoarchitecture in ALS patients.Methods
Imaging Protocol & Study Design: In this IRB-approved study, 7 subjects (6 ALS patients and 1 healthy control) were scanned at 3T (Philips, Netherlands). T2* and T1 changes were measured using a dynamic dual echo DCE-MRI pulse sequence (TE1/TE2 : 1.1/20 ms; TR : 21 ms; temporal res : 5.1 s). The imaging region of interest (ROI) were left and right lower extremities. Patients with unilateral and bilateral progression in the lower extremities were recruited for the study. Three of the 6 patients had a 6 month follow up scan to record longitudinal changes. ALSFRS scores and muscle strength test measures were used as clinical indicators in this study.
Data Analysis: The time series DCE data were registered with a T1 weighted anatomical image volume using FLIRT2 to allow for ROI delineation of muscle groups: 1) Tibialis Anterior (TA), 2) Tibialis Posterior (TP), 3) Flexor Hallucis Longus (FHL), and 4) Peroneus Longus (PL). T1 mapping was performed using a variable flip angle approach. We computed the MRC parameter, the transverse relaxivity at tracer equilibrium (TRATE)1 in the 4 ROIs as the ratio of $$$\Delta R_2^*/C_t$$$ at contrast agent (CA) equilibrium where, Ct is the CA (Gadavist) concentration, and was computed as $$$\Delta R_1/r_1$$$ (r1 assumed to be 3.3 mmol-1s-1). Our hypothesis is that ALS induced muscle degeneration results in reduced fiber diameters, translating to lower TRATE values than in healthy muscle.
Results
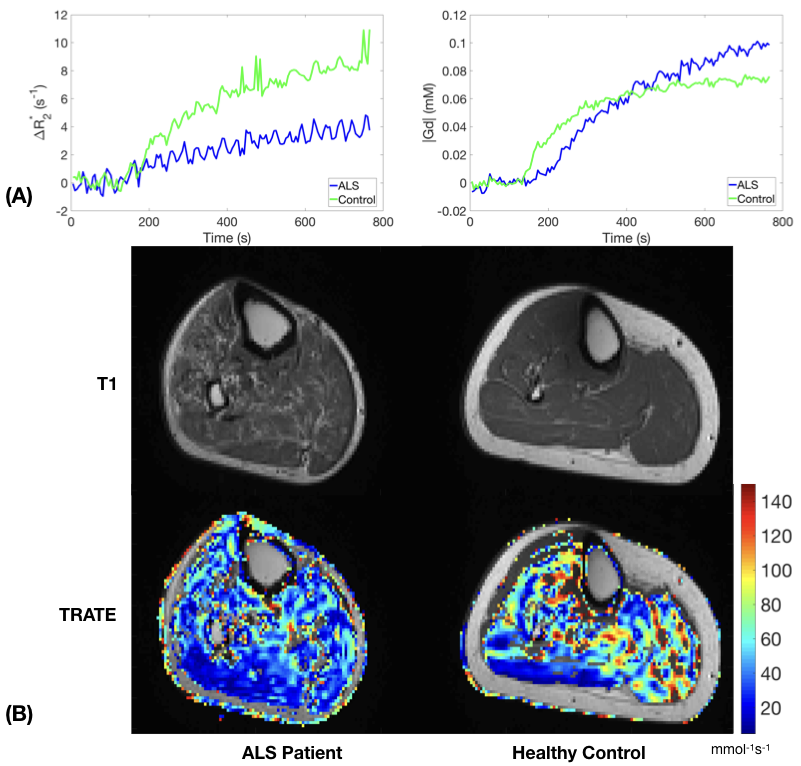
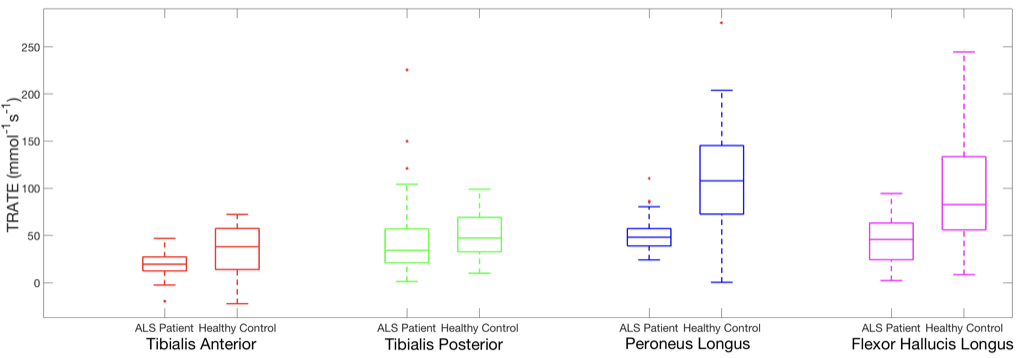
As per the biophysical basis of MRC, at contrast agent equilibrium, the measured change in transverse relaxation rates ($$$\Delta R_2^*$$$) and therefore TRATE, serve as a “signature” of the cytoarchitectural properties of myofibers. Figure 1(A) illustrates this phenomenon through observed changes in $$$\Delta R_2^*$$$, and CA concentration over time. The values in the anterior tibial muscle of an ALS patient were markedly lower when compared to the same in a healthy control. Single slice (axial) computed TRATE maps are shown in Fig. 1(B). The heterogeneity among TRATE values is evident from these maps in the ALS patient as well as the healthy control. TRATE was found to be consistently lower within ROIs identifying TA, TP, FHL and PL muscle groups in the ALS patient when compared to the healthy controls (Fig. 2).Discussion
Prior histopathologic analysis of muscle degeneration in ALS patients demonstrates that myofiber diameter and density both decrease with disease progression, features that biophysically reduce TRATE1. This correlates well with our hypothesis of being able to detect abnormal muscle cytoarchitecture with TRATE. Minimal changes in contrast agent concentration during uptake indicates that the significant changes in TRATE observed are primarily due to $$$ΔR_2^*$$$ changes. ALS progression is heterogeneous, as was observed in the varied TRATE estimates across different muscle groups. The patients enrolled in this study presented with unilateral and bilateral disease progression in the lower extremities. Longitudinal changes (visits 6 months apart) in these estimates were varied in patients with unilateral progression, when compared to patients with reported bilateral progression. Although the data presented here are representative, this is an ongoing study and further data will be utilized to obtain statistics on the relationship between TRATE and muscle degeneration. We anticipate observing high correlation between TRATE and clinical indicator scores obtained.Conclusion
The results presented in this work establish the veracity of our hypothesis to use MR Cytography as a robust, non-invasive, and quantitative biomarker in evaluating ALS induced changes to muscle myofiber microstructure. Future work focuses on imaging more patients, evaluating TRATE against non-imaging reference standards, and assessing the repeatability of TRATE as a biomarker.Acknowledgements
This work was supported by the Flinn Foundation, Award #2094, and in part by Philips Healthcare.References
- Semmineh, N. B., Xu, J. , Skinner, J. T., Xie, J. , Li, H. , Ayers, G. and Quarles, C. C. (2015), Assessing tumor cytoarchitecture using multiecho DSC‐MRI derived measures of the transverse relaxivity at tracer equilibrium (TRATE). Magn. Reson. Med., 74: 772-784. doi:10.1002/mrm.25435
- Jenkinson, M., Bannister, P., Brady, J. M. and Smith, S. M. Improved Optimisation for the Robust and Accurate Linear Registration and Motion Correction of Brain Images. NeuroImage, 17(2), 825-841, 2002.
Figures