1260
Can be Pi2 signal in 31P MR spectra a biomarker of critical limb ischemia in diabetic patients?1MR-Unit, Dept. Diagnostic and Interventional Radiology, Institute for Clinical and Experimental Medicine, Prague, Czech Republic, 2Dept. Diabetology, Institute for Clinical and Experimental Medicine, Prague, Czech Republic
Synopsis
A group of 65 diabetic patients with critical limb ischemia was studied by rest and dynamic phosphorous MR spectroscopy. An unknown signal in the position 5.2 – 5.4 ppm (labeled as Pi2) was observed in calf muscle spectra of 14 patients. Two hypotheses of the Pi2 signal explanation were taken into the consideration: a) phosphorus in alkaline phosphate pool or b) phosphorus in an unknown phosphomonoester. Results support hypothesis a) and we think that Pi2 signal at 5.4 ppm in patients with diabetic foot disease could be considered as the biomarker of the most severe muscular damage.
Introduction
A group of diabetic patients with critical limb ischemia was studied by rest and dynamic phosphorous MR spectroscopy (31P MRS). An unknown signal in the position 5.2 – 5.4 ppm (labeled as Pi2) was observed in calf muscle spectra of several patients.1 The signal with similar chemical shift had been assigned to the inorganic phosphate from mitochondrial pool by several authors at 7T 2 and the signal intensity was positively correlated with mitochondrial capacity. It is in contrast to our patients where the highest values of the unknown signal were observed in patients in the worst health state (with edema, ulcers tissue, etc.). Thus, another explanation of the unknown signal origin must be considered.Subjects and Methods
The group of 65 diabetic patients was examined by rest and dynamic non-localized 31P MR spectroscopy. Examinations were performed at 3T MR tomograph Trio (Siemens, Germany) equipped with surface dual 1H/31P coil (Rapid, Germany) and home-made pedal ergometer.
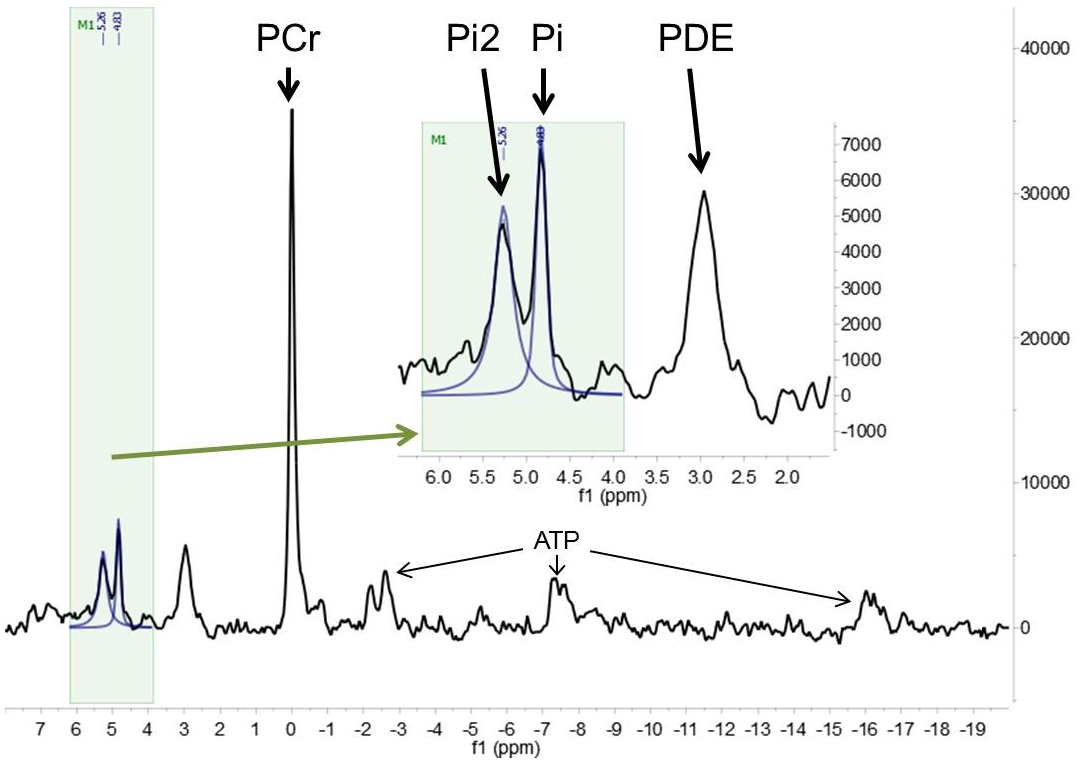
31P MR spectra were analyzed by AMARES (jMRUI 5.0 software). Lorentzian line shapes were applied: phosphocreatine (PCr, 0 ppm), inorganic phosphate (Pi, 4.94 ppm), and the unknown Pi2 signal (5.2 - 5.4 ppm). The relative chemical shifts of Pi, Pi2 and PCr were used to calculate pH.3
Dynamic spectroscopy (exercise on MR ergometer) was performed only if the patient's physical condition allowed it. All the subjects provided their informed consent in line with local Ethical Committee rules.
Results
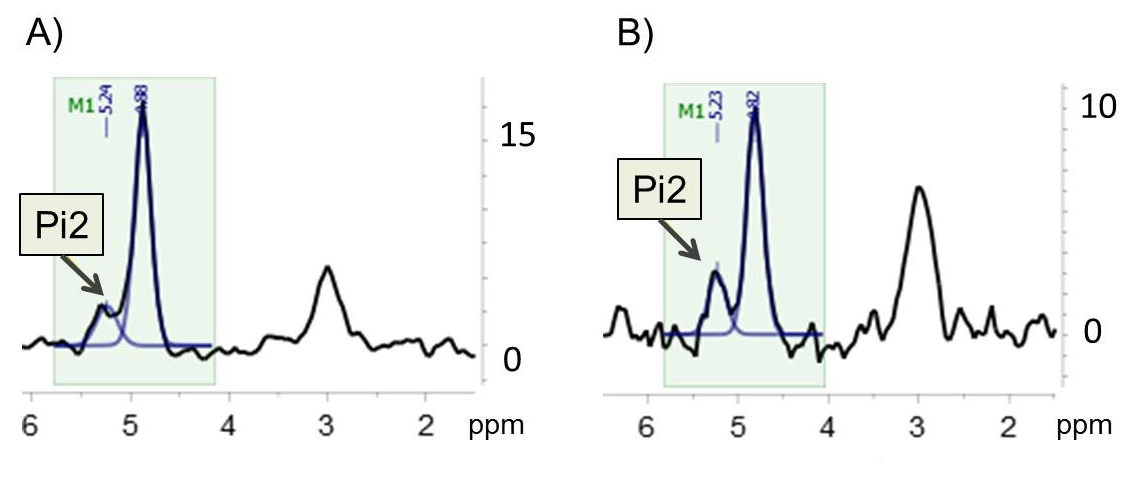
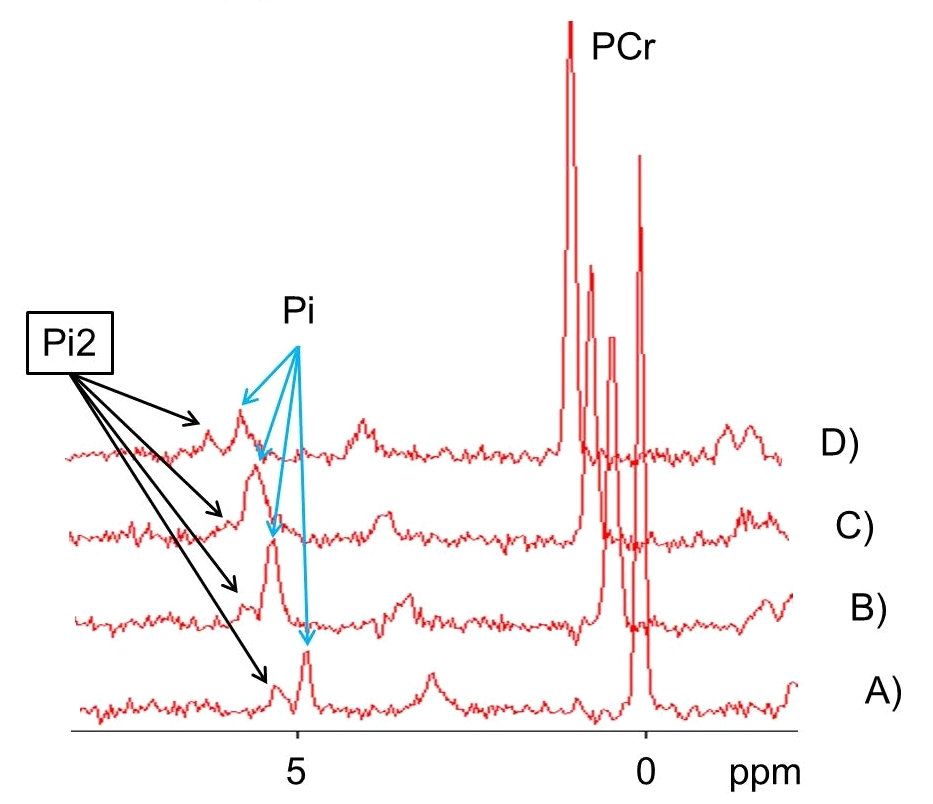
The unknown Pi2 signal (S/N>2) was visible in 14 patients of 65 examined diabetic subjects, but the trace of Pi2 (S/N≈1-2) in 31P MR spectrum was visible also in other subjects (see Figure 1). The signal was reproducible during couple month period (see Figure 2). Relative amplitude of Pi2 to Pi signal was (82±46) % and to PCr signal was (7±2) %. Intramyocellular pH based on chemical shifts PCr and Pi was 7.05±0.02, pH corresponding to the unknown Pi2 signal was 7.54±0.05. Dynamic 31P MRS was done only in 4 of 14 patients due to their health and physical status (see Figure 3).Discussion
Our data of 14 patients group demonstrate that the Pi2 signal between 5.2-5.4 ppm is not an artifact. The signal is intensive, reproducible and can be considered stable under physical stress. Besides 7T studies of intramitochondrial Pi, signal in this ppm location (with lower intensity) was also described in patients with muscular dystrophy.4
We followed two hypotheses of the Pi2 signal explanation: a) phosphorus in alkaline phosphate pool or b) phosphorus in an unknown phosphomonoester. Alkaline pool could consist of a) Pi in cytoplasma of the mitochondria (mitochondria pH 7.3; 5 or other organelles, b) Pi in cytosol of considerably damaged/degenerated muscle cells with leaky membrane and inadequate cell homeostasis, 6 or c) Pi in interstitium and blood vessels. Interstitium and blood vessels have referred values between 7.36-7.44 (our patient pH of blood 7.359-7.385). Moreover, extracellular concentration of Pi is obviously low (blood Pi standard reference value: 0.7-1.5 mmol/l; our patients 1.13-3.10 mmol/l) and volume of tissue fluid is smaller than volume of cytosol. Mean pH calculated from Pi2 in our group of patients is 7.54±0.05, it means close but higher than pH discussed for all theoretically mentioned hypotheses. On the other hand, the highest intensity of Pi2 signal was measured in patients before major amputation where devastating cell damage was present.
So that, in the moment, we prefer the hypothesis of alkaline pool although the presence of an unknown phosphomonoester cannot be excluded.
Conclusion
We think that Pi2 signal at 5.4 ppm in patients with diabetic foot disease could be considered as the biomarker of the most severe muscular damage.Acknowledgements
The study was supported by Ministry of Health of the Czech Republic, grants AZV 15-26906A and conceptual development of research organization („Institute for Clinical and Experimental Medicine – IKEM, IN 00023001“).References
1. Sedivy P, Drobny M, Dezortova M, Herynek V, Roztocil K, Cermakova H, Nemcova A, Dubsky M, Hajek M. 31P MR spectroscopy of patients with mild and serious lower limb ischemia. Int Angiol. 2018; 37(4):293-299.
2. Valkovic L, Chmelik M, Ukropcova B, et al. Skeletal muscle alkaline Pi pool is decreased in overweight-to-obese sedentary subjects and relates to mitochondrial capacity and phosphodiester content. Sci Rep. 2016; 6:20087.
3. Moon RB, Richards JH. Determination of intracellular pH by P-31 magnetic-resonance. J Biol Chem. 1973; 248(20):7276-7278.
4. Reyngoudt H, Turk S, Carlier PG. H-1 NMRS of carnosine combined with P-31 NMRS to better characterize skeletal muscle pH dysregulation in Duchenne muscular dystrophy. NMR Biomed. 2018; 31(1):e3839.
5. Kan HE, Klomp DWJ, Wong CS, et al. In vivo P-31 MRS detection of an alkaline inorganic phosphate pool with short T1 in human resting skeletal muscle. NMR Biomed. 2010; 23(8):995-1000.
6. Wary C, Naulet T, Thibaud JL, et al. Splitting of Pi and other 31P NMR anomalies of skeletal muscle metabolites in canine muscular dystrophy NMR Biomed. 2012; 25(10):1160-1169.
Figures