1256
High-resolution Isotropic Whole Brain T2 Mapping with Model-based Super-resolution Reconstruction1School of Engineering, Institute for Digital Communications,University of Edinburgh, Edinburgh, United Kingdom, 2Centre for Clinical Brain Sciences, University of Edinburgh, Edinburgh, United Kingdom, 3Advanced Clinical Imaging Technology, Siemens Healthcare AG, Lausanne, Switzerland, 4LTS5, École Polytechnique Fédérale de Lausanne, Lausanne, Switzerland, 5Department of Radiology, University Hospital Lausanne (CHUV), Lausanne, Switzerland, 6Computer Science Department, University of Bath, Bath, United Kingdom
Synopsis
We propose a method to reconstruct 1-mm3 isotropic T2 maps based on multiple 2D multi-echo spin-echo (MESE) acquisitions. To compensate for the prolonged scan time due to multiple acquisitions, data were highly (10-fold) undersampled. The data was reconstructed by combining a classical super-resolution approach with an iterative model-based reconstruction. The method was tested on a phantom and four healthy volunteers. T2 values were compared against fully sampled MESE data. The proposed technique allows the assessment of T2 values in brain structures at high isotropic resolution.
Purpose
High-resolution isotropic brain T2 mapping with multi-echo spin-echo (MESE) acquisitions is difficult due to the slice thickness limitation of a 2D sequence1. If used as a 3D acquisition, SAR limits are easily exceeded due to the high power deposition of non-selective refocusing pulses2. These limitations can be addressed by using super-resolution (SR) reconstruction where multiple low-resolution (LR) images are acquired with a different FOV1 or orientation3,4, and combined by solving a non-linear problem. However, the need for multiple orientations results in a substantial increase in scan duration. We propose to combine model-based5 and SR1 reconstruction to obtain high-resolution (1-mm3 isotropic) T2 maps based on an undersampled MESE acquisition.Theory
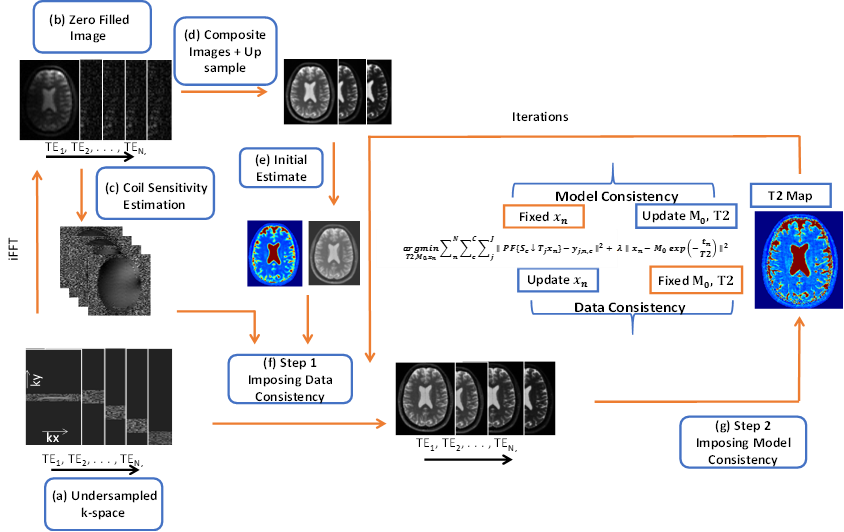
A high-resolution series of images $$$x_n$$$ (with $$$ n = 1, …, N,$$$ and $$$N$$$ the number of spin-echoes) is estimated by minimizing the difference to LR k-space $$$y_{j,n,c}$$$ with $$$S_c$$$ coil sensitivities (with $$$c = 1,…,C,$$$ and $$$C$$$ the number of coils), $$$T_j$$$ representing a rotation or translation of the FOV (with $$$j=1,…, J,$$$ and $$$J$$$ the number of LR k-spaces), ↓ downsampling operator, $$$F$$$ Fourier transform and $$$P$$$ undersampling. Subsequently, the image corresponding to the signal model $$$x_n=M_0 exp(-{t_n/T2})$$$ is calculated by fitting a mono-exponential decay onto $$$x_n$$$ (with echo-time $$$t_n$$$), intrinsically estimating $$$T2$$$ and $$$M_0$$$:
$$\operatorname*{arg\,min}_{T2, M_0,x_n} \sum_{i=1}^C \sum_{n=1}^N \sum_{j=1}^J \| PF\left\{S_c\downarrow T_jx_n\right\}-y_{j,n,c}\|^2 + \lambda_ \|x_n{-\ M}_0exp\left(-\frac{t_n}{T2}\right)\|^2 $$
where the first term ensures data-consistency of the HR image with the acquired data and the second term ensures model-consistency. To balance the two terms, a regularization parameter λ is introduced. The optimization is done iteratively by alternating between minimising data- and model-consistency (see Figure 1)
Methods
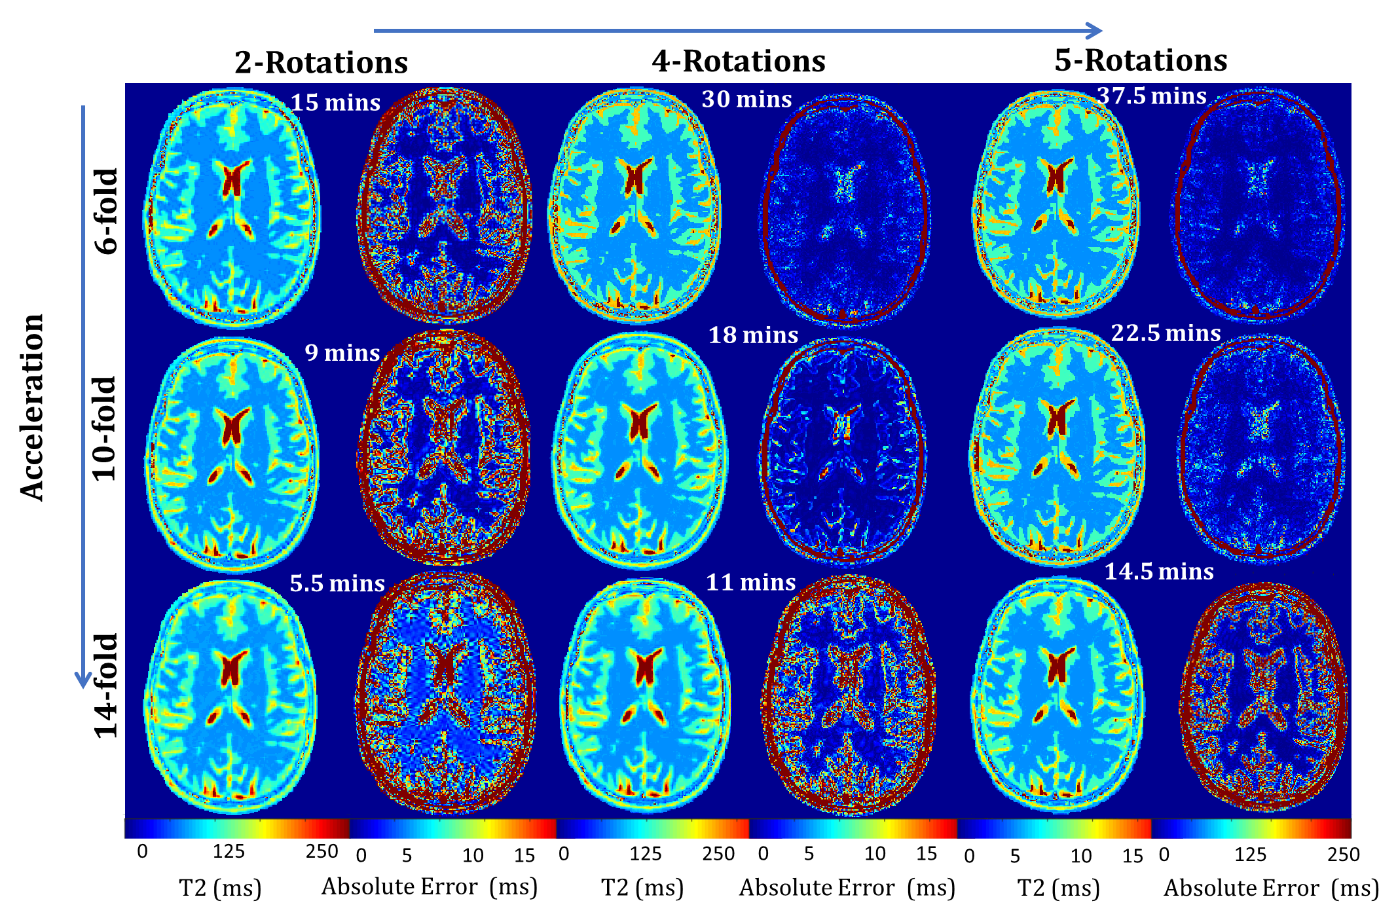
Simulations were performed on a numerical phantom6 to ascertain the trade-off between number of rotations and the acceleration factor. To this end, T2 maps were reconstructed from the simulated undersampled LR k-spaces for an increasing number of rotations and acceleration factors. The differences from the gold-standard T2 map were visually inspected and the root mean square error (RMSE) was calculated.
Data from a multipurpose phantom and four healthy subjects were acquired at 3T (MAGNETOM Skyra, Siemens Healthcare, Erlangen, Germany) with a 10-fold- accelerated GRAPPATINI7 prototype sequence (60 sagittal slices, (1x1x4) mm3 resolution, TR=5.4s, ΔTE=10ms, ETL=16). The acquisition was repeated four times with each scan rotated about the longitudinal axis at incremental steps of 45° (TA=18:04min). For comparison, 29 axial slices with 4mm thickness were acquired with a fully sampled MESE sequence. For the phantom, a single slice was acquired using a conventional single-echo SE sequence with three TEs (12,50,100 ms).
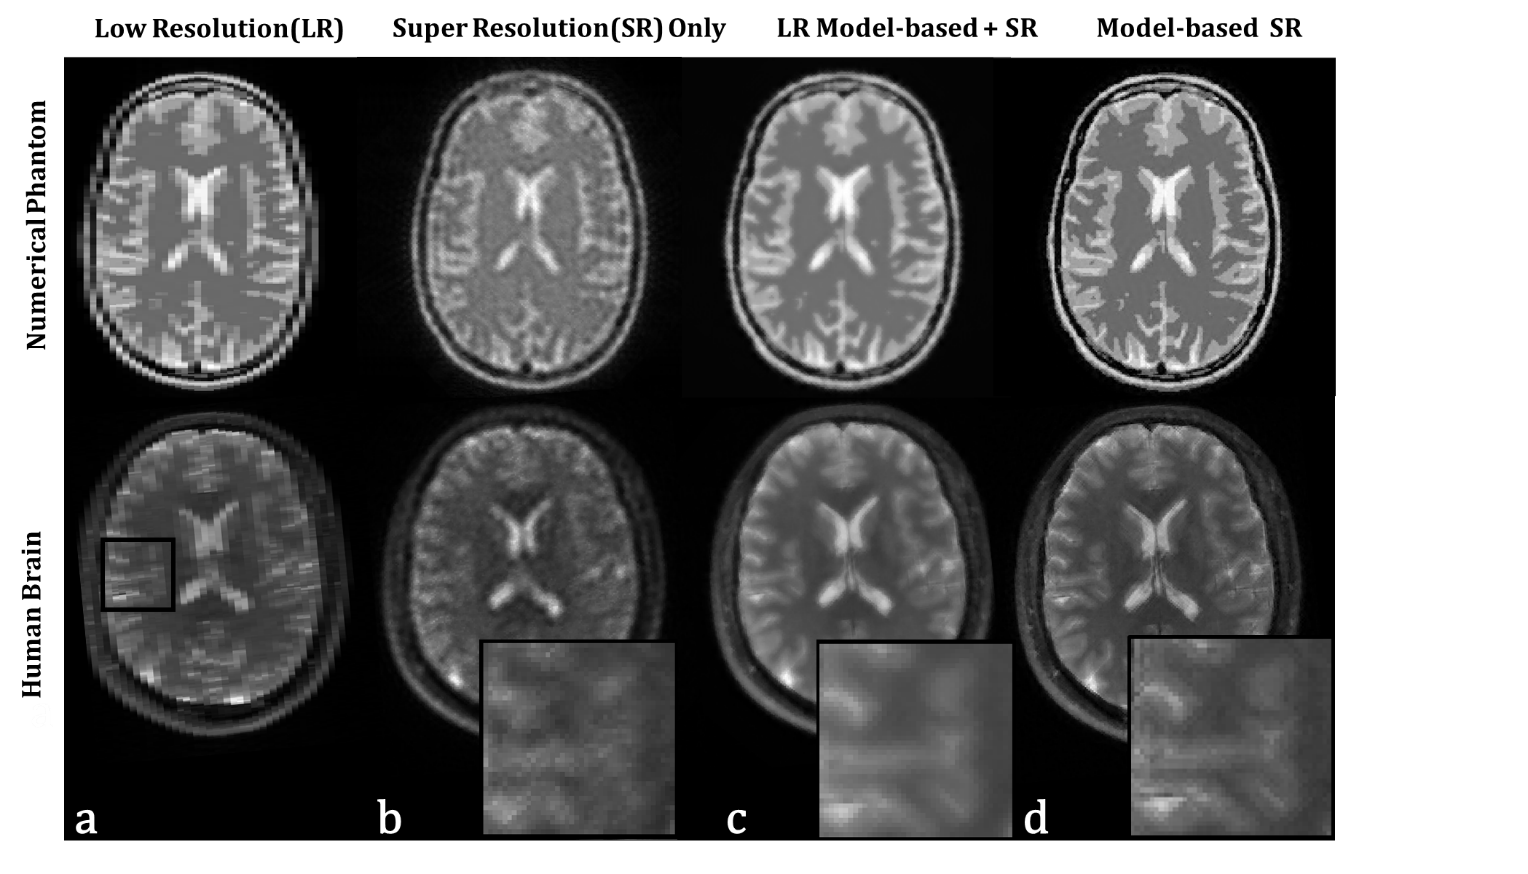
The proposed approach was compared to two other methods. The first approach is the “LR model-based + SR” reconstruction where the T2 maps were reconstructed on the individual LR orientations using model-based reconstruction followed by up-sampling to a HR grid. The second approach is the ‘SR only’ reconstruction without the model consistency term.
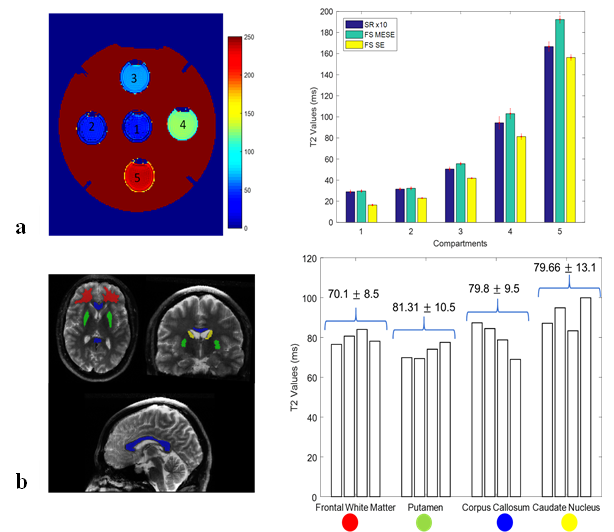
ROI analysis was performed on the phantom and in vivo T2 maps. T2 values from different compartments of the phantom were compared to the T2 values from fully sampled MESE and SE data. T2 values from ROIs were compared across volunteers to assess the consistency of T2 values.
Results
Numerical simulations showed that the best trade-off is 10-fold acceleration with four rotations (RMSE=7.8 ms, TA=18 mins). Five rotations and 6-fold acceleration showed the least error (RMSE=3.2 ms) but required an acquisition time of 37 minutes (Figure 2). Fourteen-fold acceleration with five rotations had an acquisition time of 14 minutes but an RMSE of 12.5 ms.
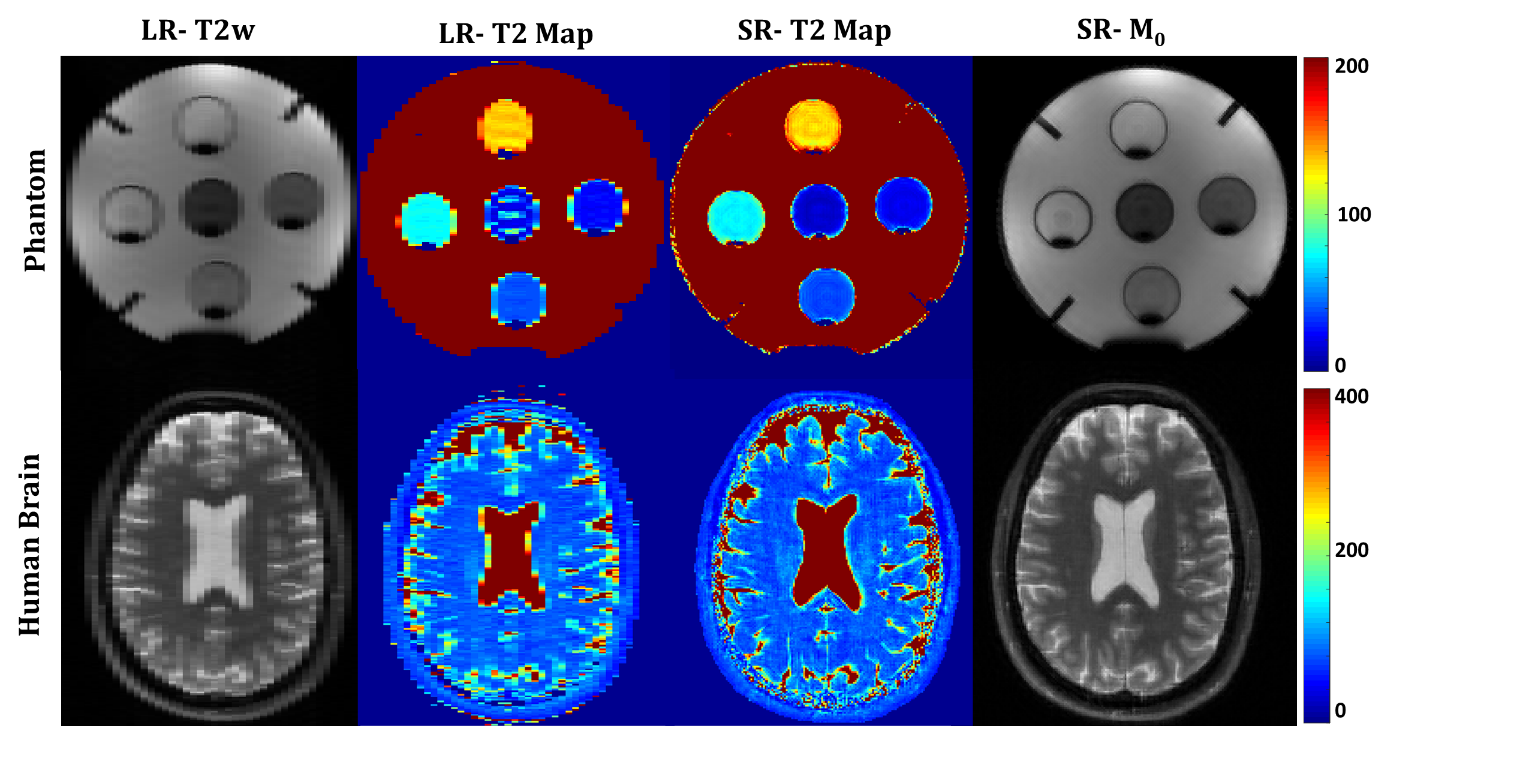
The proposed algorithm (Figure 3) showed improved resolution over LR images for both phantom and brain. Comparison between the proposed methods and the ‘SR only’ and ‘LR model-based + SR reconstruction’ showed that integrating SR and model knowledge in one cost function improves the reconstruction (Figure 4).
ROI analysis of the phantom compartments revealed that at shorter T2, the proposed method was comparable with the fully sampled MESE. However, the error increased with higher T2 values (compartments 3 and 4 showing a relative difference of 10-12%, and 15% for compartment 5). For the volunteers’ data, the values found in the brain structures were consistent across subjects (8.5-13.1ms standard deviation).
Discussion and Conclusion
Model-based super-resolution T2 mapping enables reconstruction of HR relaxation maps with a ten times faster acquisition in comparison to a fully sampled acquisition. However, total acquisition time is still not acceptable in clinical routine. Future work should explore further acceleration with different sampling patterns or simultaneous multi-slice8. In addition, motion correction and slice profiles were not considered for this work. Including those in future work will considerably improve the performance of the algorithm.Acknowledgements
The research leading to these results has received funding from the European Union's Seventh Framework Programme (FP7-PEOPLE-2013-ITN) under grant agreement n 607290 SpaRTaN.References
1. Greenspan H, Oz G, Kiryati N, Peled S. MRI inter-slice reconstruction using super-resolution. Magnetic resonance imaging 2002;20(5):437-446.
2. Hennig J. Multiecho imaging sequences with low refocusing flip angles. Journal of Magnetic Resonance (1969). 1988 Jul 1;78(3):397-407.
3. Scherrer B, Gholipour A, Warfield SK. Super-resolution reconstruction to increase the spatial resolution of diffusion weighted images from orthogonal anisotropic acquisitions. Medical image analysis 2012;16(7):1465-1476.
4. Van Steenkiste G, Poot DH, Jeurissen B, Den Dekker AJ, Vanhevel F, Parizel PM, Sijbers J. Super‐resolution T1 estimation: Quantitative high resolution T1 mapping from a set of low resolution T1‐weighted images with different slice orientations. Magnetic resonance in medicine 2017;77(5):1818-1830.
5. Sumpf TJ, Uecker M, Boretius S, Frahm J. Model‐based nonlinear inverse reconstruction for T2 mapping using highly undersampled spin‐echo MRI. Journal of Magnetic Resonance Imaging 2011;34(2):420-42.
6. Guerquin-Kern M, Lejeune L, Pruessmann KP, Unser M. Realistic analytical phantoms for parallel magnetic resonance imaging. IEEE Transactions on Medical Imaging. 2012 Mar;31(3):626-36.
7. Hilbert T, Sumpf TJ, Weiland E, Frahm J, Thiran JP, Meuli R, Kober T, Krueger G. Accelerated T2 mapping combining parallel MRI and model‐based reconstruction: GRAPPATINI. Journal of Magnetic Resonance Imaging 2018.
8. K. Setsompop, J. Stockmann, Q. Fan, T. Witzel, and L. Wald, “Generalized slice dithered enhanced resolution simultaneous multislice (gslider-sms) to increase volume encoding, snr and partition profile fidelity in high-resolution diffusion imaging,” in Proceedings of the 24th Annual Meeting of ISMRM, Singapore, 2016, p. 607.
Figures