1248
Nasopharyngeal Irradiation can Increase Signal Intensity on T1-Weighted MRI of the Dentate Nucleus in Patients with Nasopharyngeal Malignancies1Department of radiology, Rui Jin Hospital, Shanghai, China, 2Department of radiology, Wayne State University, Detroit, MI, United States
Synopsis
Patients with nasopharyngeal malignancies (NPM) are generally treated by nasopharyngeal irradiation. In order to evaluate curative effect, gadolinium-based contrast agents (GBCAs)-based MRI examinations are always performed repeatedly. Whether the nasopharyngeal irradiation affects the T1 signal intensity (SI) in DN remains unclear. 68 NPM patients and 68 suitable control patients were enrolled. We found that the uptake rate of gadolinium from the NPM was significantly higher than that from control patients. We speculated that the nasopharyngeal irradiation increases the T1 SI by the damage to the blood–brain barrier (BBB).
Abstract
Introduction Nasopharyngeal irradiation is usually carried out to effectively treat patients with nasopharyngeal malignancies (NPM). Gadolinium-based contrast agents (GBCAs)-based MRI examinations are often performed to estimate NPM progression and curative consequence. SI changes in the DN because of the brain irradiation have been reported in previous studies (1-6). However, how the nasopharyngeal irradiation affects the signal intensity (SI) changes in dentate nucleus (DN) on unenhanced T1-weighted MR images in NPM patients with repeated GBCAs administrations remains unclear. In this study, we explored whether nasopharyngeal irradiation affects SI changes in DN, and to discover a reasonable evaluation of the uptake of gadolinium in the DN as a function of the number of doses.
Methods Patients: The institutional review board of Rui Jin hospital approved this study. Because this was a retrospective study written, informed consent was waived. The picture archiving and communication system (PACS) and radiology information systems were searched from January 2008 to June 2018 to identify consecutive patients with NPM who had undergone irradiation therapy. 68 NPM patients who had undergone irradiation and at least four GBCAs-enhanced MR examinations and 68 suitable control patients were enrolled. MR imaging protocol: All patients in this study underwent MR examination with one of 6 MR imaging systems at our institution (two GE 1.5-T units [Signa MR, USA], one GE 3.0-T units, two Siemens 1.5-T units [Aera XJ, Germany], and one United Imaging 1.5-T unit [uMR 560, China]). All MR examinations included an unenhanced axial T1-weighted sequence for at least the first and last scanning sessions. Axial T1-weighted sequence in the form of a fluid-attenuated inversion recovery (FLAIR) sequence was obtained. Image analysis: The SIs in the DN and cerebellar white matter (CWM) were calculated on unenhanced T1-weighted images. The DN/CWM ratio and relative percentage change (Rchange) between the first and last examinations for each patient were calculated. DN/CWM ratio and Rchange were compared between groups. Associations of Rchange with dependent variables including sex, age, number of doses, and interval between the first and the last contrast-enhanced examinations were explored. Statistical analysis: Statistical analysis was performed with SPSS Statistics software. Analysis included the Shapiro-Wilk test, paired t test, Wilcoxon rank sum test, univariate linear regression analysis and multivariable linear regression analysis.
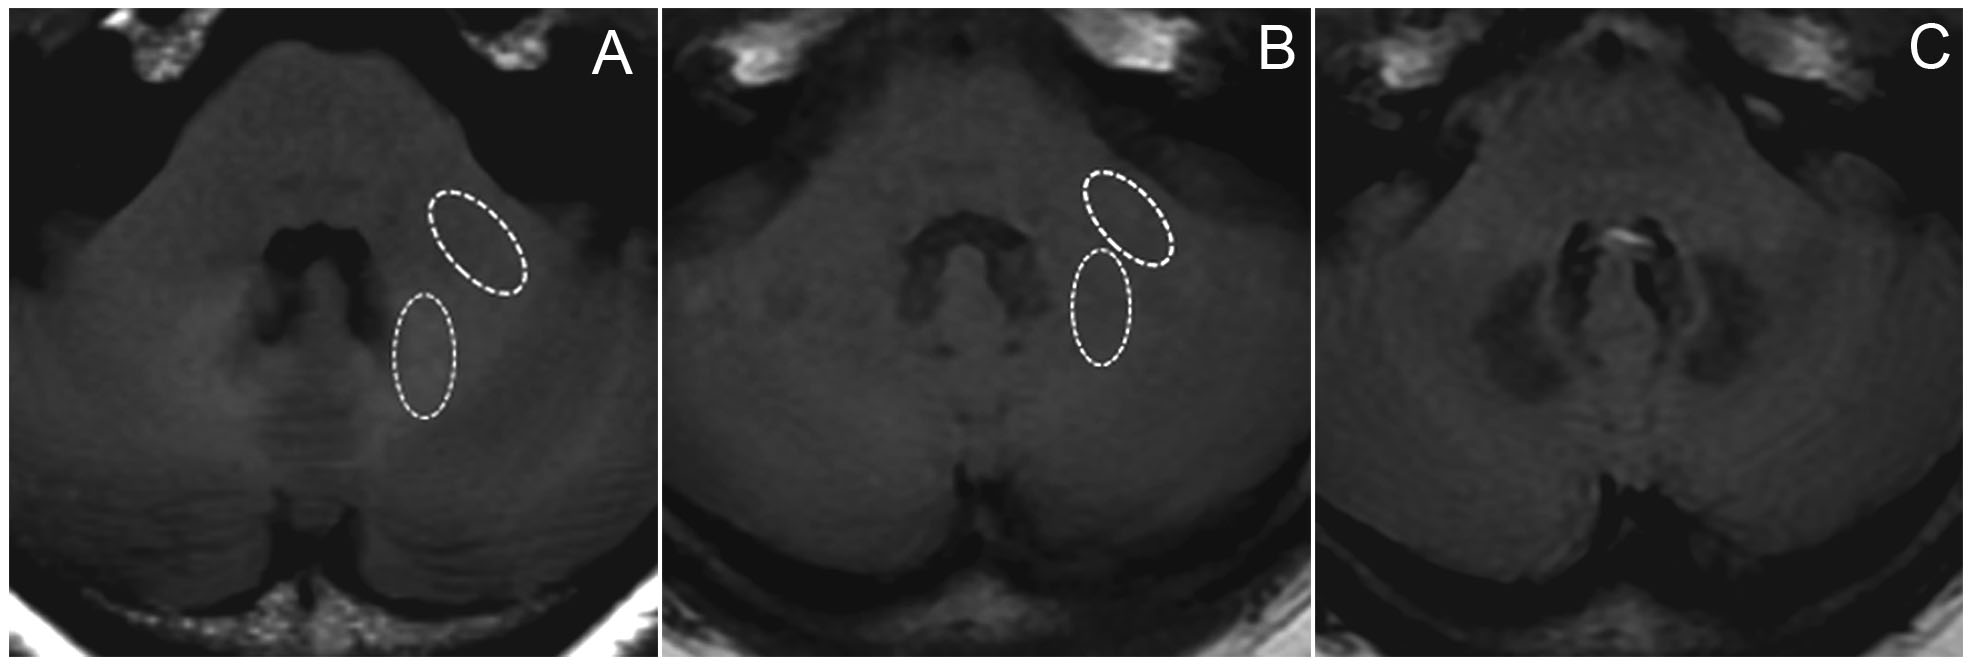
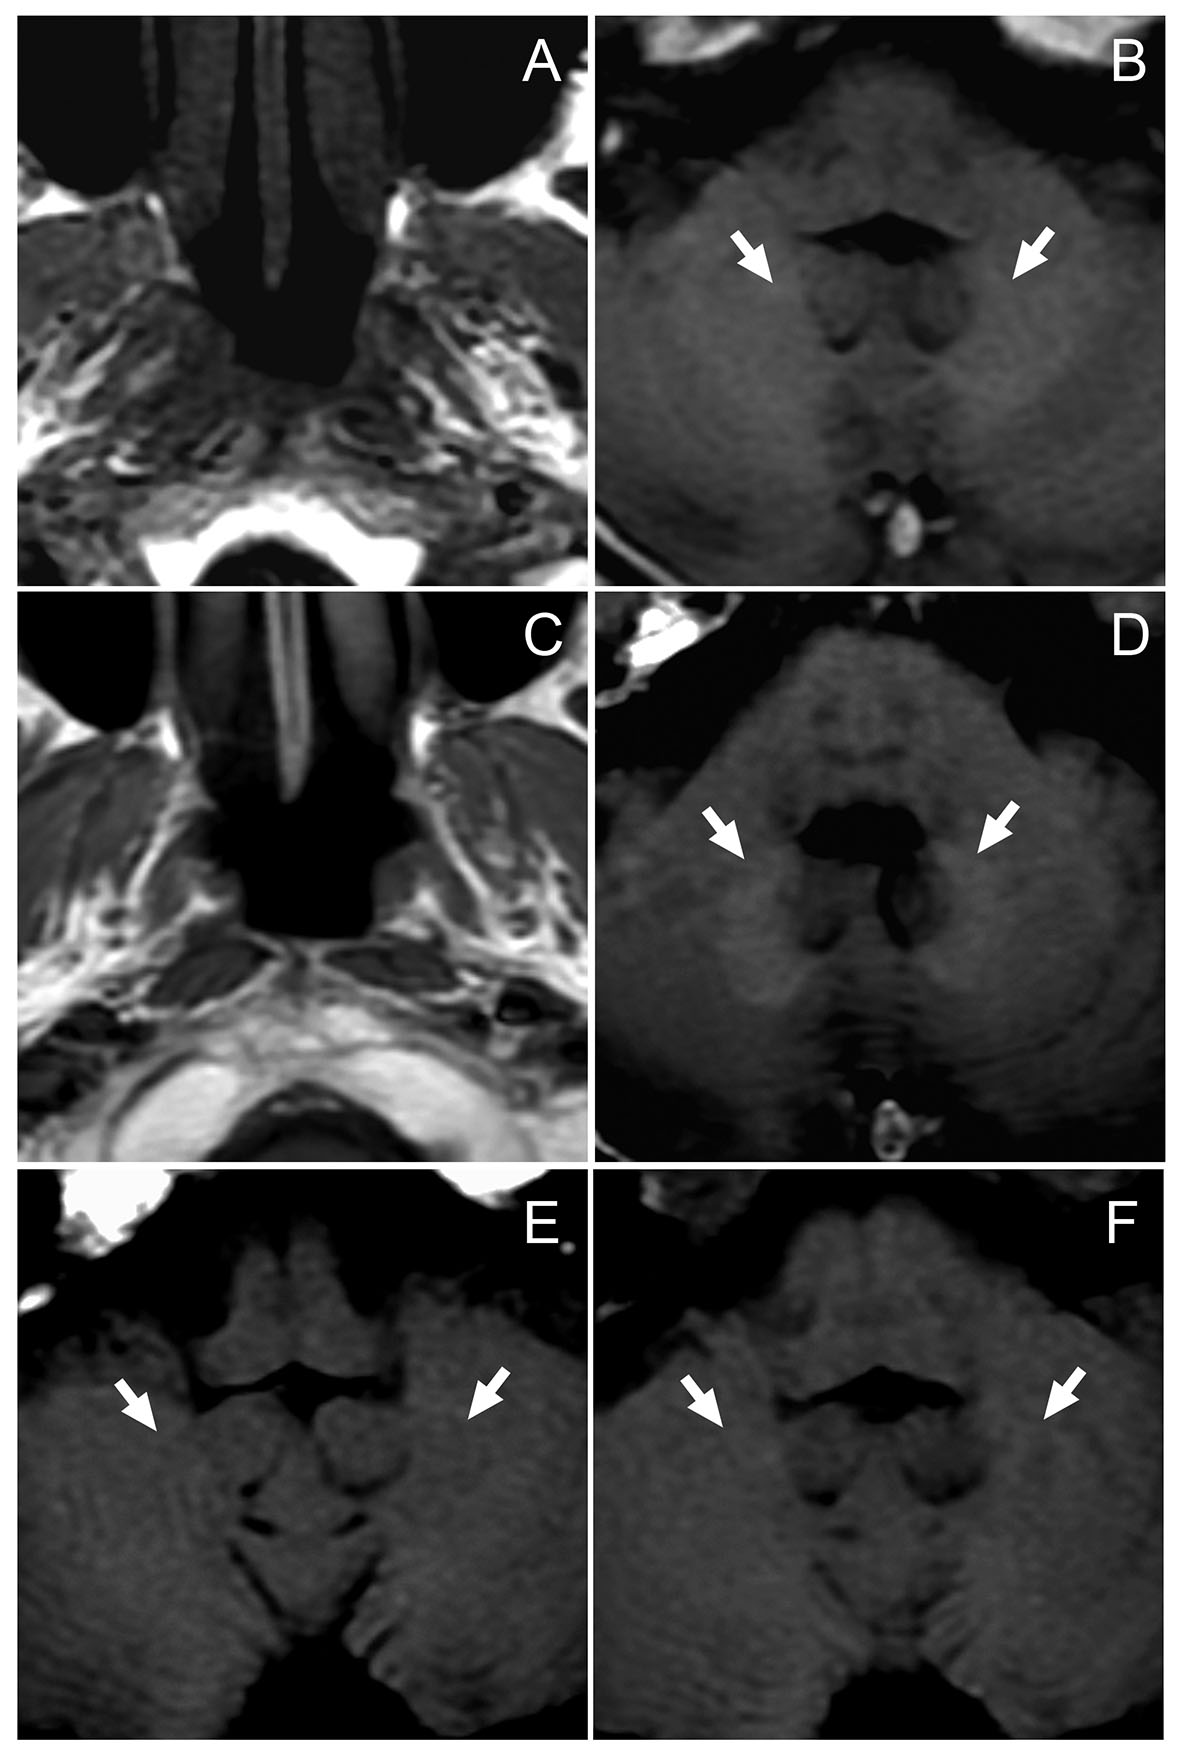
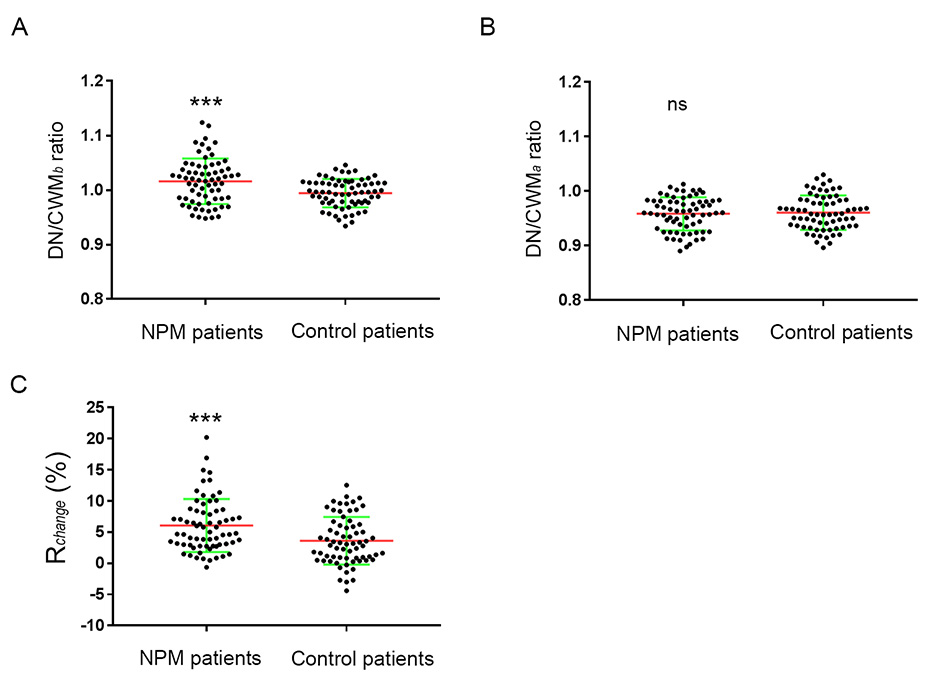
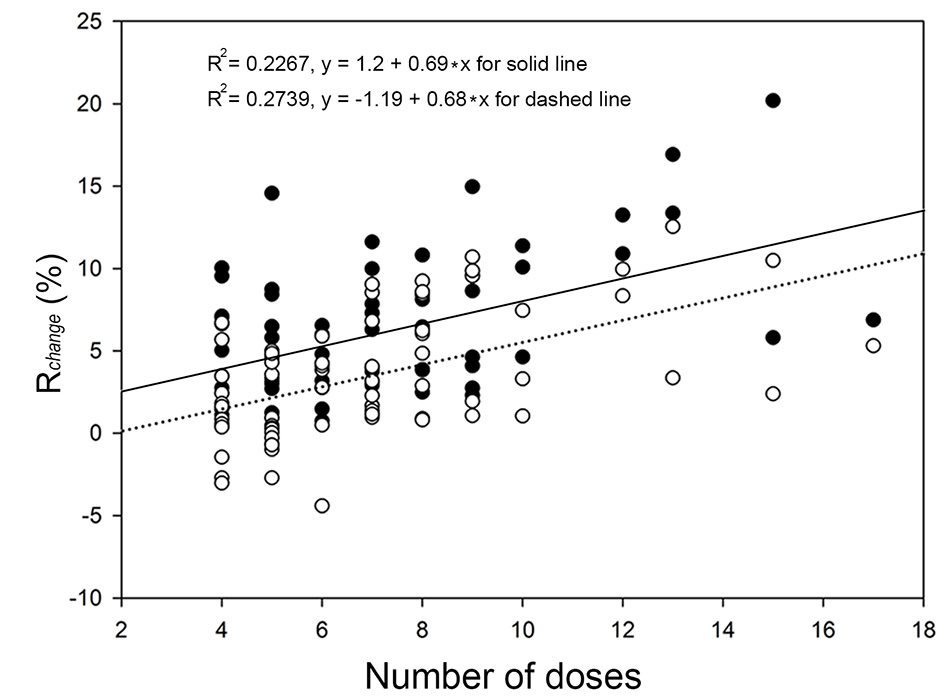
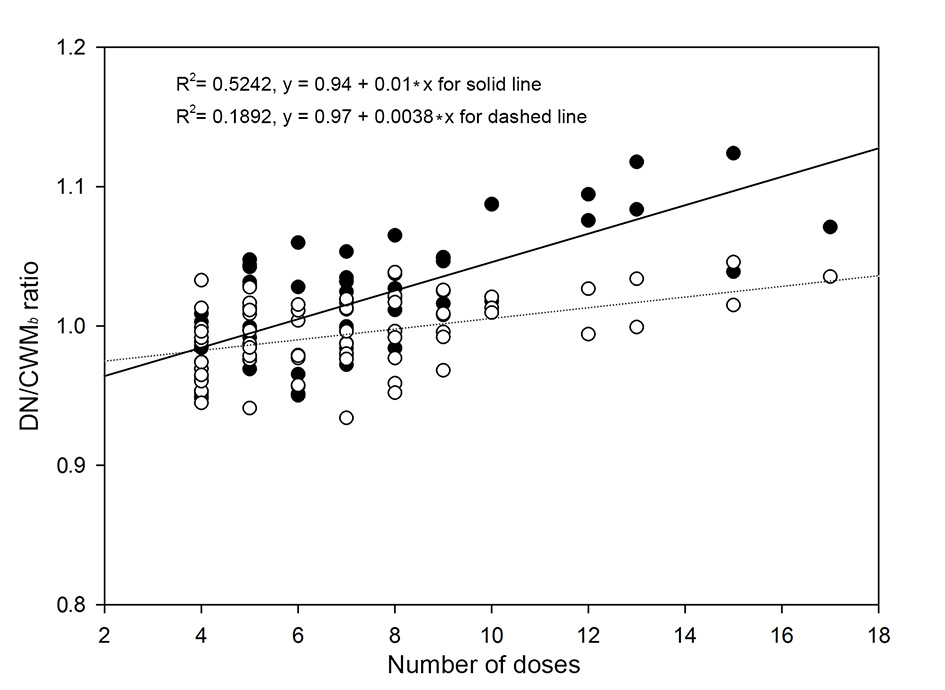
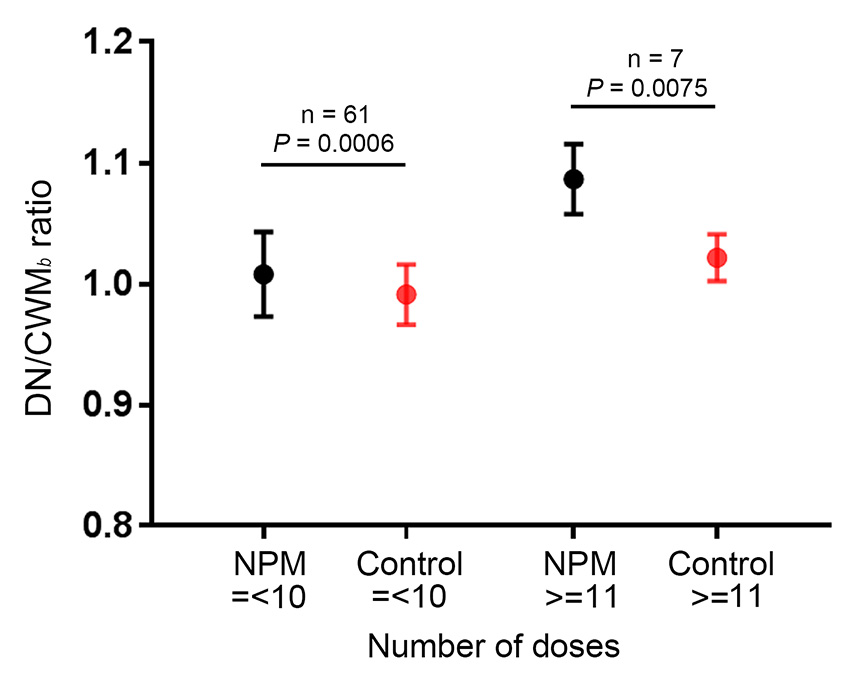
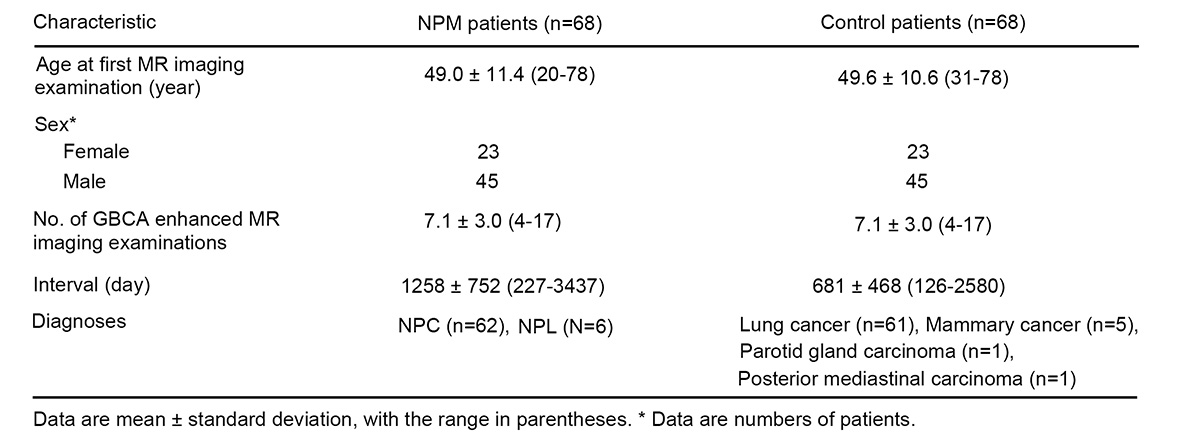
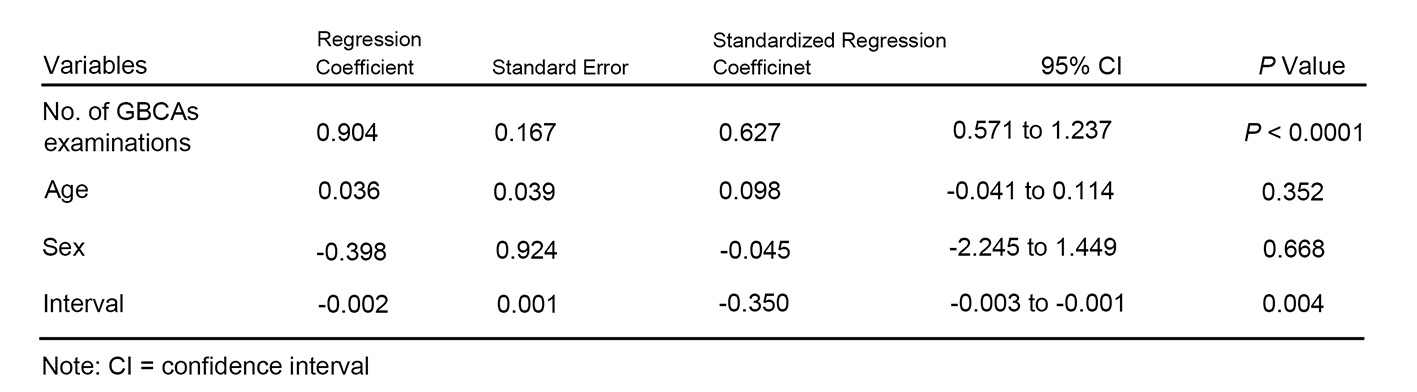
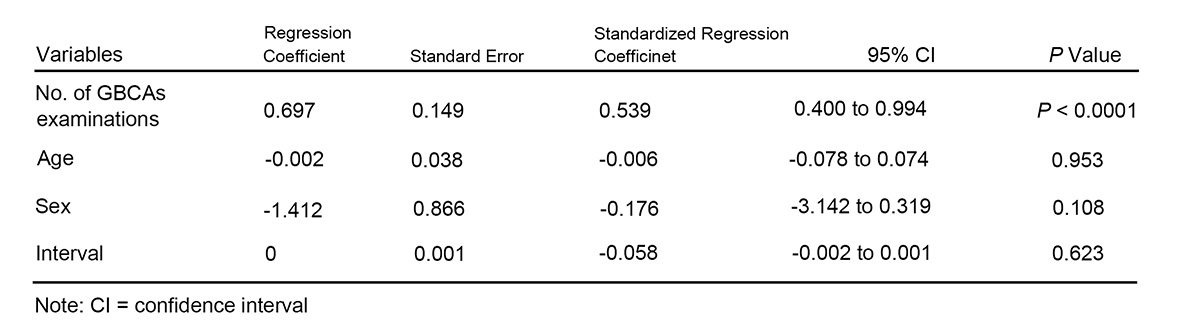
Results The DN was easier seen in NPM than control patients after GBCA administration as shown in figures 1 and 2. The comparison of DN/CWM ratio and Rchange between NPM patients and control patients were shown in figure 3. The Rchange and DN/CWM ratio versus the number of doses administered for the NPM group and the control group with univariate linear regression line for each group were shown in figure 4 and 5, respectively. Graph shows mean DN/CWMb ratio as a function of the number of doses. The comparison of DN/CWM ratio from subgroups between the NPM group and the control group was shown in figure 6. The demographics and patient characteristics by group were shown in figure 7. Multivariable linear regression analysis regarding the Rchange for NPM patients and control patients was shown in figures 8 and 9.
Discussion and Conclusion The mechanisms by which irradiation causes increased SI of the DN are still unknown. Kasahara et al (4) showed that irradiation can make cellular and molecular changes in normal tissues of the central nervous system. These cellular and molecular changes caused by free radicals are related with the increased T1 SI of the DN owing to their T1-shortening effects (4, 7). In addition, irradiation can cause vascular damage. In capillaries, vessel dilatation and wall asymmetry can be found. Thrombosis happens to induce ischemic changes, which will further cause mineral deposition (3, 4). An increase in iron may be caused by the recirculation of blood after transient ischemia, leading to T1 relaxation time shortening (8). Fujioka et al (9) reported that the above changes would not persistent for longer than one year. Therefore, the increased SI of the DN in most of the NPM patients may not be simply due to the above irradiation-induced changes. Blood–brain barrier (BBB) is frequently damaged by irradiation (10-16). Then the passage of macromolecular substance, such as GBCAs, will become easier. The NPM patients in our study presented absence of intracranial abnormalities. Therefore, our results seemed to reveal that irradiation promotes gadolinium deposition by the disruption of the BBB. Nasopharyngeal irradiation can increase the T1 SI in the DN, which might suggest accelerated gadolinium deposition because of the damage to the BBB.
Acknowledgements
We thank the grant supports from National Natural Science Foundation of China 81471808, 81271740, and 81301347.References
1. Lee KF, Suh JH. CT evidence of grey matter calcification secondary to radiation therapy. Computerized Tomography. 1977;1(1):103.
2. Lewis E, Lee YY. Computed tomography findings of severe mineralizing microangiopathy in the brain. Journal of Computed Tomography. 1986;10(4):357.
3. Shanley DJ. Mineralizing microangiopathy: CT and MRI. Neuroradiology. 1995;37(4):331-3.
4. Kasahara S, Miki Y, Kanagaki M, et al. Hyperintense dentate nucleus on unenhanced T1-weighted MR images is associated with a history of brain irradiation. Radiology. 2011;258(1):222-8.
5. Tamrazi B, Nguyen B, Liu CJ, et al. Changes in Signal Intensity of the Dentate Nucleus and Globus Pallidus in Pediatric Patients: Impact of Brain Irradiation and Presence of Primary Brain Tumors Independent of Linear Gadolinium-based Contrast Agent Administration. Radiology. 2017:171850.
6. Tamrazi B, Liu CJ, Cen SY, Nelson MB, Dhall G, Nelson MD. Brain Irradiation and Gadobutrol Administration in Pediatric Patients with Brain Tumors: Effect on MRI Brain Signal Intensity. Radiology. 2018:173057.
7. Burger P. The pathology of central nervous system radiation injury. Radiation Injury to the Nervous System. 1991.
8. Krause GS, Nayini NR, White BC, et al. Natural course of iron delocalization and lipid peroxidation during the first eight hours following a 15-minute cardiac arrest in dogs. Annals of Emergency Medicine. 1987;16(11):1200.
9. Fujioka M, Taoka T, Hiramatsu KI, Sakaguchi S, Sakaki T. Delayed ischemic hyperintensity on T1-weighted MRI in the caudoputamen and cerebral cortex of humans after spectacular shrinking deficit. Stroke; a journal of cerebral circulation. 1999;30(5):1038.
10. Valk PE, Dillon WP. Radiation injury of the brain. Ajnr Am J Neuroradiol. 1991;12(1):45-62.
11. Rubin P, Gash DM, Hansen JT, Nelson DF, Williams JP. Disruption of the blood-brain barrier as the primary effect of CNS irradiation. Radiotherapy & Oncology Journal of the European Society for Therapeutic Radiology & Oncology. 1994;31(1):51-60.
12. Adair JC, Baldwin N, Kornfeld M, Rosenberg GA. Radiation-induced blood-brain barrier damage in astrocytoma: relation to elevated gelatinase B and urokinase. Journal of Neuro-Oncology. 1999;44(3):283-9.
13. Steen RG, Spence D, Wu S, Xiong X, Kun LE, Merchant TE. Effect of therapeutic ionizing radiation on the human brain. Annals of Neurology. 2001;50(6):787.
14. Van VM, Kal HB, Taphoorn MJ, El-Sharouni SY. Changes in blood-brain barrier permeability induced by radiotherapy: implications for timing of chemotherapy? (Review). Oncology Reports. 2002;9(4):683.
15. Fauquette W, Amourette C, Dehouck MP, Diserbo M. Radiation-induced blood-brain barrier damages: an in vitro study. Brain Research. 2012;1433:114-26. 16. Lim WH, Choi SH, Yoo RE, et al. Does radiation therapy increase gadolinium accumulation in the brain?: Quantitative analysis of T1 shortening using R1 relaxometry in glioblastoma multiforme patients. Plos One. 2018;13(2):e0192838.
Figures