1246
Detection of malignant parotid gland tumors using multi-modality MRI and deep learning: diffusion versus T1 contrast-enhanced imaging1National Taiwan University of Science and Technology, Taipei, Taiwan, 2Chinese Medical University Hsinchu Hospital, Hsinchu, Taiwan, 3Feng Chia University, Taichung, Taiwan
Synopsis
The study presents an automatic recognition method for parotid gland tumor. We used a convolution neural network to conduct the segmentation of parotid gland tumor and classifications of tumor types. We also designed eight combinations of various MRI contrasts to compare the results of recognition for parotid gland tumor. We compared results obtained using various combinations of MR images as the input of the convolutional neural network and found that diffusion-related parameters and contrast-enhanced T1 images played the primary role of the prediction accuracy.
Purpose
Various MR imaging methods have been shown their potential to discriminate malignancy of parotid gland tumors (PGT), including but not limited to T2-weighted, postcontrast T1-weighted, and diffusion-weighted images.1,2 In this study, we developed an automatic diagnosis system for PGTs by using recently advanced deep-learning methods and the multi-modality MRI images. The specific aims of this study included segmenting the regions of PGTs and predicting the tumor malignancy.Materials and Methods
This study was approved by the institutional review board and written informed consents were waived. We collected 133 MRI datasets from 40 PGT patients (benign PGT: 23, malignant PGT: 17). Each dataset consisted of five types of multi-slice MR images encompassing the PGT region, including T2, T1 with contrast-enhancement, diffusion-weighted echo-planar images (DW-EPI, b values: 0, 1000 sec/mm2) and the corresponding apparent-diffusion-coefficient (ADC) maps. The five types of images are referred to as T2, T1ce, b0, bk, and ADC respectively. The T2, T1ce and DW-EPI images underwent co-registration in SPM software package. Also, we manually outlined the tumor regions and labeled the pixels as 0: background, 1: benign, and 2: malignant PGTs. We generated 8 combinations of the 5 types of MRI images as the input multi-channel images for the following deep-learning procedures. They were listed in Table 1. We normalized the images with the maximum intensity of each channel and padded zeros to each image to construct a multi-channel image training image (256×256×4). We distributed the subjects into three groups to conduct 3-fold cross-validation of deep learning.
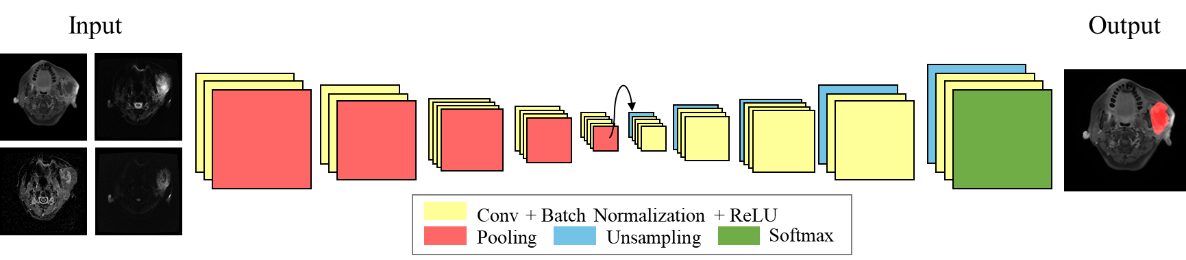
We used two-dimensional SegNet for pixel-wise semantic segmentation.3 The architecture of SegNet implementation is displayed in Figure 3. In this study, we adapted a model won the third prize in BraTS 2017,4 as the pre-trained model. A four-channel input layer was implemented, and the SegNet was pre-trained with four types of brain MR images (T2, FLAIR, T1, T1ce). Approximately 2×10⁵ 2D images extracted from 285 3D datasets were used to train the BraTs model. We transferred the weights of the pre-trained model and trained a new model with the PGT datasets. The pre-initialization of the SegNet allowed the training procedure of the new PGT model converged to a moderate accuracy. Finally, we calculated the values of sensitivity, precision, and F1-score of the neural network and compare 8 types of multi-channel images.
Results
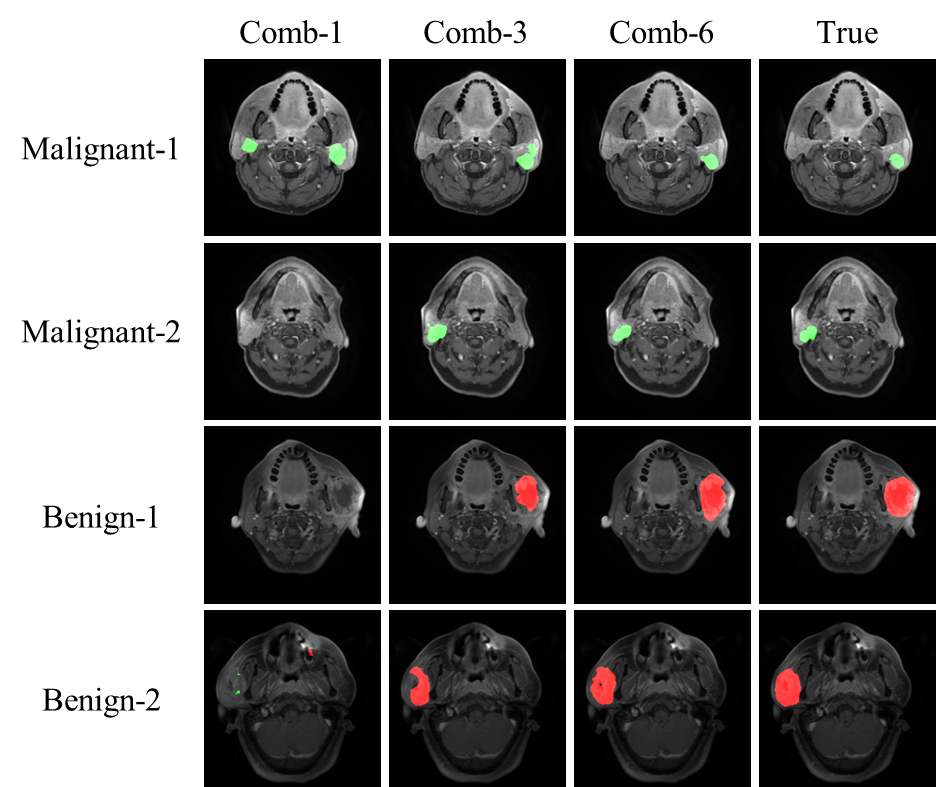
Figure 2 displays the example results of recognition for PGT and Table 1 shows the group statistics of the accuracy indexes of PGT segmentations and classifications. Notice that the Comb-6 (b0 + bk + ADC + T1ce) performs best in the segmentation task according to the F1 score, which can also be identified in Figure 2. However, the classification of Comb-6 is not as accurate as the rest combinations. Thus, we fused two models for the tumor classifications, i.e., Comb-6 as the segmentation model and Comb-3, 4, or 5 as the classification model. The F1-scores of tumor classifications of Comb-6+Comb-4 and Comb-6+Comb-5 were close to 0.87.
We then merged the multi-slice results (133 slices) into 40 patients by a voting mechanism. All the tumors identified from the slices acquired from the same subject were collected, and the numbers of malignant and benign tumors were calculated to “vote” the malignancy of the PGT of this subject. In the event of a tie, the PGT was identified as malignant. Table 2 lists the accuracy metrics of identifying malignant PGTs by three configurations of input datasets. They were Comb-2 requiring only T2 and T1ce, Comb-3 requiring only b0, b0 and ADC obtained by DW-EPI, and Comb-6+Comb-4 requiring T1ce and DW-EPI-related images. The accuracy obtained using Comb-6+Comb-4 datasets is the highest amount the three methods.
Discussions and Conclusions
We evaluated various combinations of MRI images to identify the malignancy of PGTs by the SegNet method. The results supported that the model trained with only DW-EPI images performed better than the model trained with structural images (T2+T1ce). Combining T1ce and DW-EPI into Comb-6+Comb-4 prominently improved the segmentation and classification results. It suggested that multi-modality MR images improve the accuracy of the detection of malignant PGTs using the multi-channel deep learning method. However, the drawback of combining different MR modalities is potential misregistration between the channels (i.e., MR modalities). Although SPM was used for affine registration, the DW-EPI distortion along phase-encoding direction could hamper registration precision and thus reduced the accuracy of multi-channel deep learning. The deformable ANTS registration method may improve the alignment of EPI and T1ce and thus merits further investigations. In summary, the SegNet method combined with multi-modality MRI is practical for the detection of malignant PGT.Acknowledgements
Supported by the Ministry of Science and Technology under grants 107-2314-B-039-071 and 107-2314-B-011-002-MY3References
1. Christe A, Waldherr C, Hallett R, Zbaeren P, Thoeny H, MR Imaging of Parotid Tumors: Typical Lesion Characteristics in MR Imaging Improve Discrimination between Benign and Malignant Disease, American Journal of Neuroradiology August 2011, 32 (7) 1202-1207.
2. Liu YJ, Lee YH, Chang HC, Huang TY, Chiu HC, Wang CW, Chiou TW, Hsu K, Juan CJ, Huang GS, and Hsu HH, A Potential Risk of Overestimating Apparent Diffusion Coefficient in Parotid Glands, PLoS One. 2015; 10(4): e0124118.
3. Badrinarayanan V, Kendall A, Chipolla R, SegNet: A Deep Convolutional Encoder-Decoder Architecture for Scene Segmentation, IEEE Transactions on Pattern Analysis and Machine Intelligence, Jan 2017.
4. Yang TL, Ou YN, Huang TY, Automatic segmentation of brain tumor from MR images using SegNet: selection of training data sets, third prize, MICCAI 2017: Multimodal Brain Tumor Segmentation Challenge 2017
Figures