1243
Diffusion Weighted Imaging to differentiate human papillomavirus positive from human papilloma virus negative head and neck squamous cell carcinoma: how do b-values influence results?1Radiology department, Geneva University Hospital, Geneva, Switzerland
Synopsis
This study investigates whether and how the choice of b-values influences ADC ability to differentiate between human papillomavirus (HPV) positive (HPV+) from HPV negative (HPV-) head and neck squamous cell carcinoma (HNSCC) using quantitative histogram parameters of tumor ADC maps obtained with different combinations of b-values and with monoexponential and bi-exponential models (IVIM). Results show that ADC calculated with 2 b-values, b0 and b1000, are sufficient and that ADC calculated only with high b-values (combination excluding b0) are not able to differentiate both tumor types.
Introduction
Diffusion weighted imaging (DWI) is increasingly used for oncologic disease assessment in the head and neck. In particular, it was recently shown that ADC histogram parameters allow differentiating human papillomavirus (HPV) positive (HPV+) from HPV negative (HPV-) head and neck squamous cell carcinoma (HNSCC).1 This information is important since prognosis in oropharyngeal HPV+ HNSCC is better than in HPV- cancers. There is, however, a lack of consensus concerning the right choice of b-values for DWI acquisition, notably regarding the inclusion of low b-values (more sensitive to perfusion effects) or on the contrary of only high b-values (to eliminate perfusion effects in ADC calculation).
The purpose of this study was to investigate whether and how the choice of b-values influences ADC ability to differentiate between HPV+ and HPV- HNSCC using quantitative histogram parameters of tumor ADC maps obtained with different combinations of b-values and with monoexponential and bi-exponential models (IVIM).
Methods
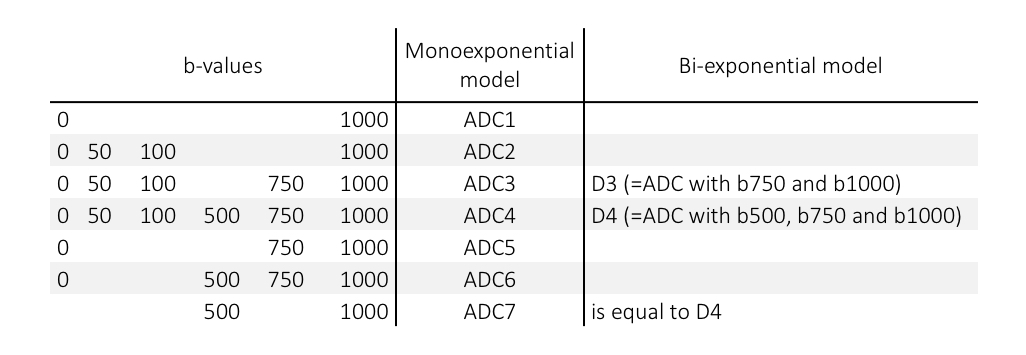
Thirty-seven patients were retrospectively included in this study: 26 HPV- and 11 HPV+. DWI was acquired on a 3T system with 6 b-values: b0, 50, 100, 500, 750, 1000 following previously published recommendations.2 Sequence parameters were: FOV 230x254mm2, acquired resolution 2x2x3mm3, reconstructed 1.3x1.3x3mm3, TE/TI/TR 73/230/6859ms. SENSE acceleration factor 2, 40 slices, acquisition time 4min7s. Reconstruction of multiple ADC maps (using monoexponential model) and D maps (using bi-exponential IVIM model) were performed with an in-house developed Matlab software. For the bi-exponential IVIM model, D was calculated on high b-values (b>=500 s/mm2).3 Table 1 shows the choice and combination of b-values for each calculated ADC or D map. A region of interest encompassing the lesion was drawn on ADC1 map and copied on the other maps. Mean ADC or D values, as well as histogram parameters, such as excess kurtosis and skewness were evaluated for each tumor map (i.e. for each combination of investigated b-values). Statistical analyses were performed with R Statistics. Differences between groups were assessed with the Wilcoxon test.Results
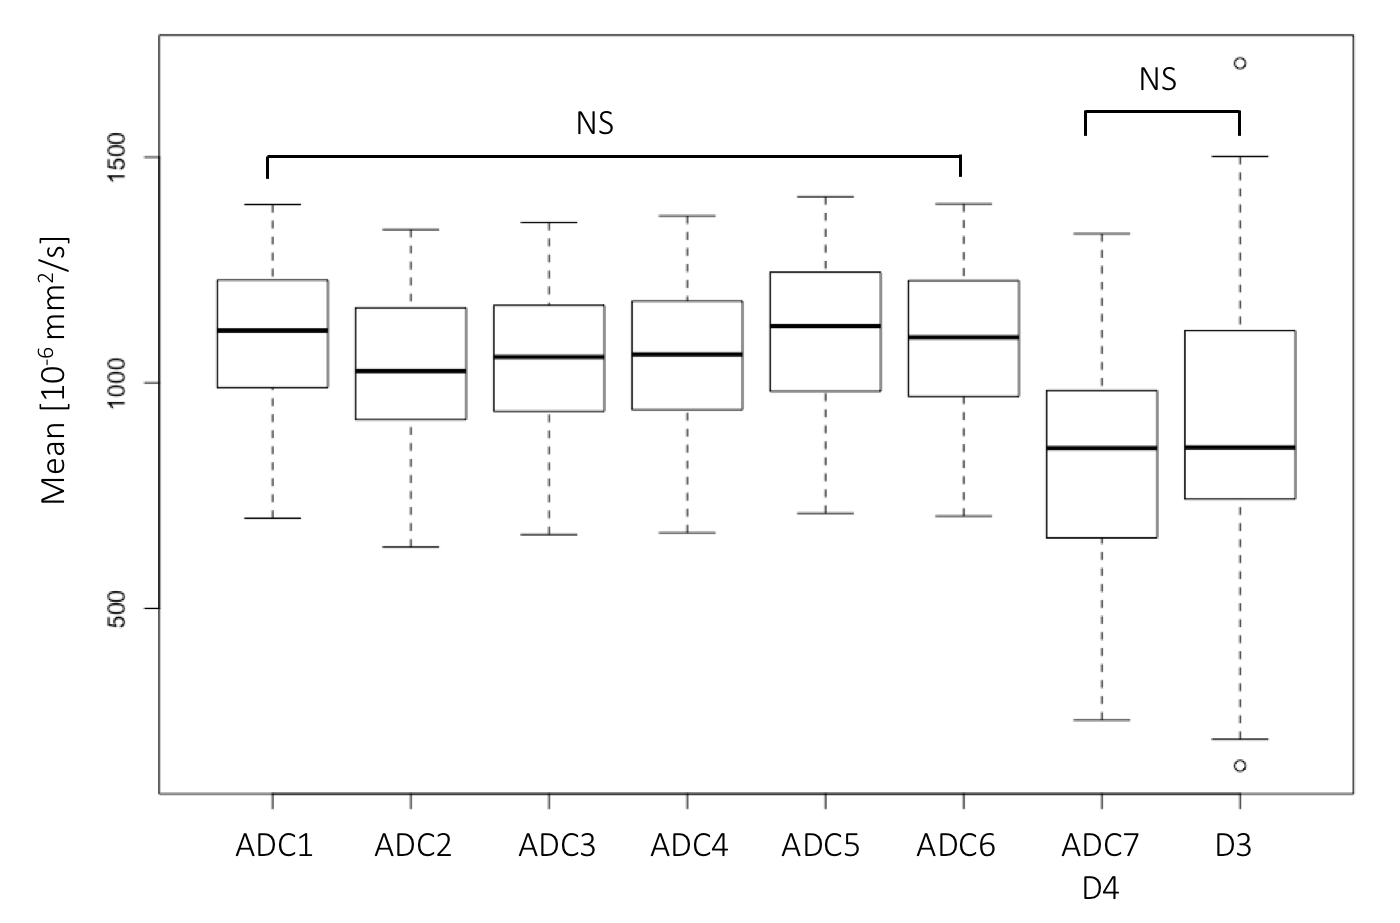
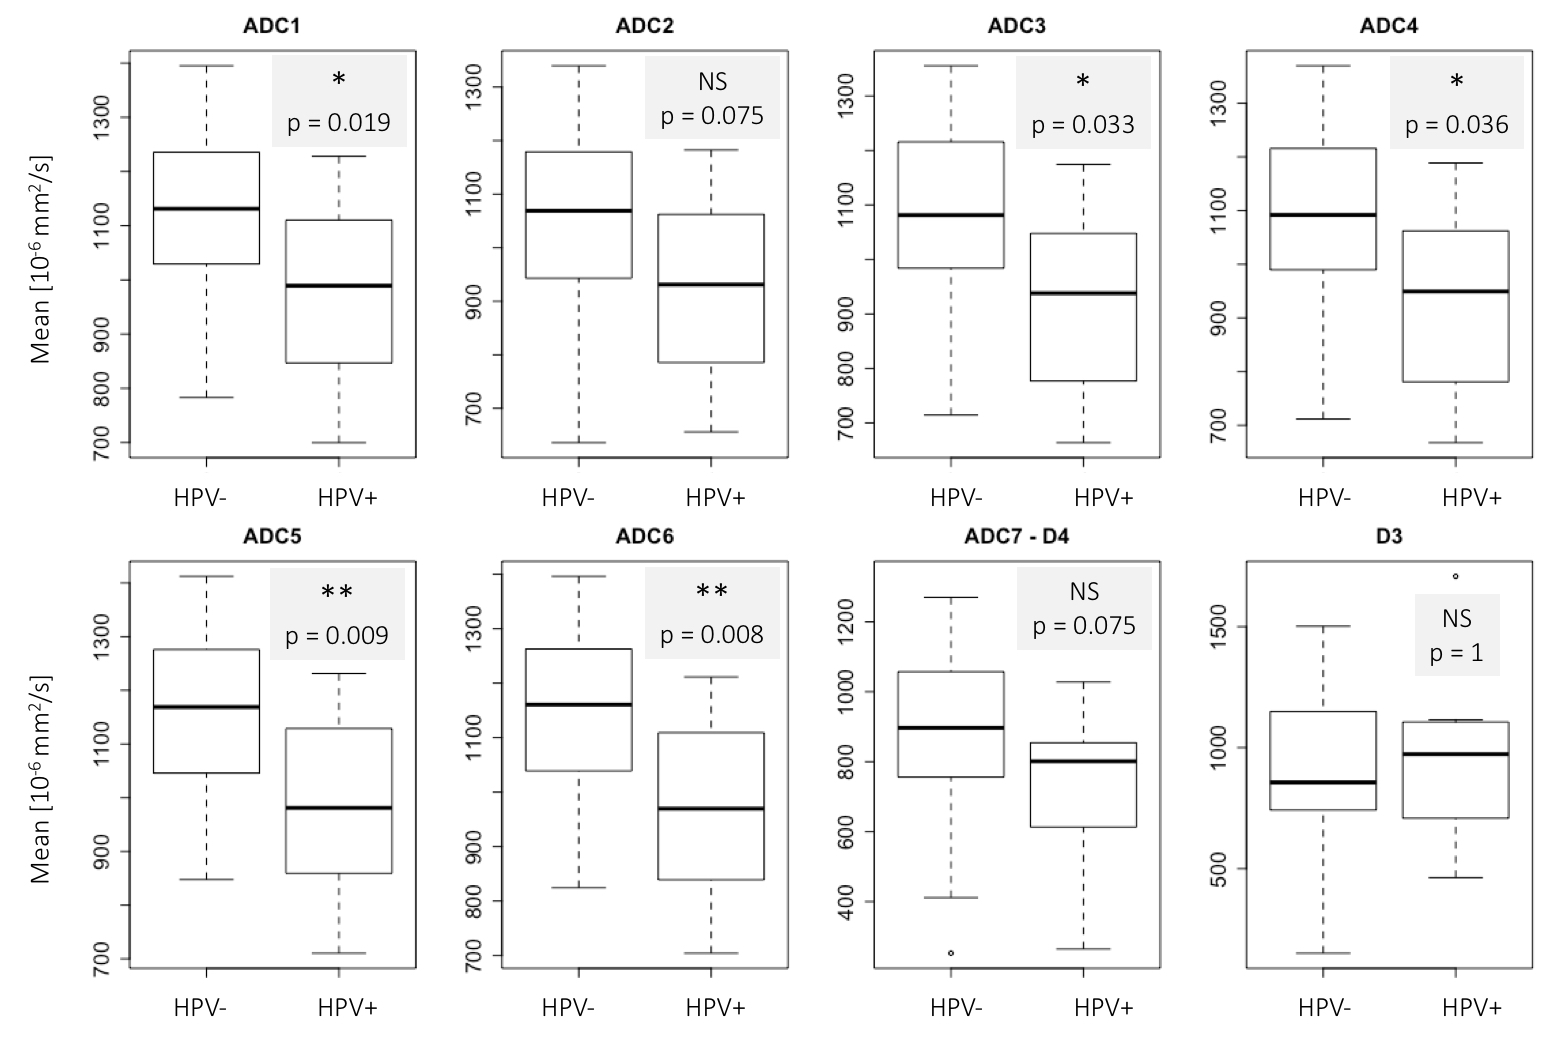
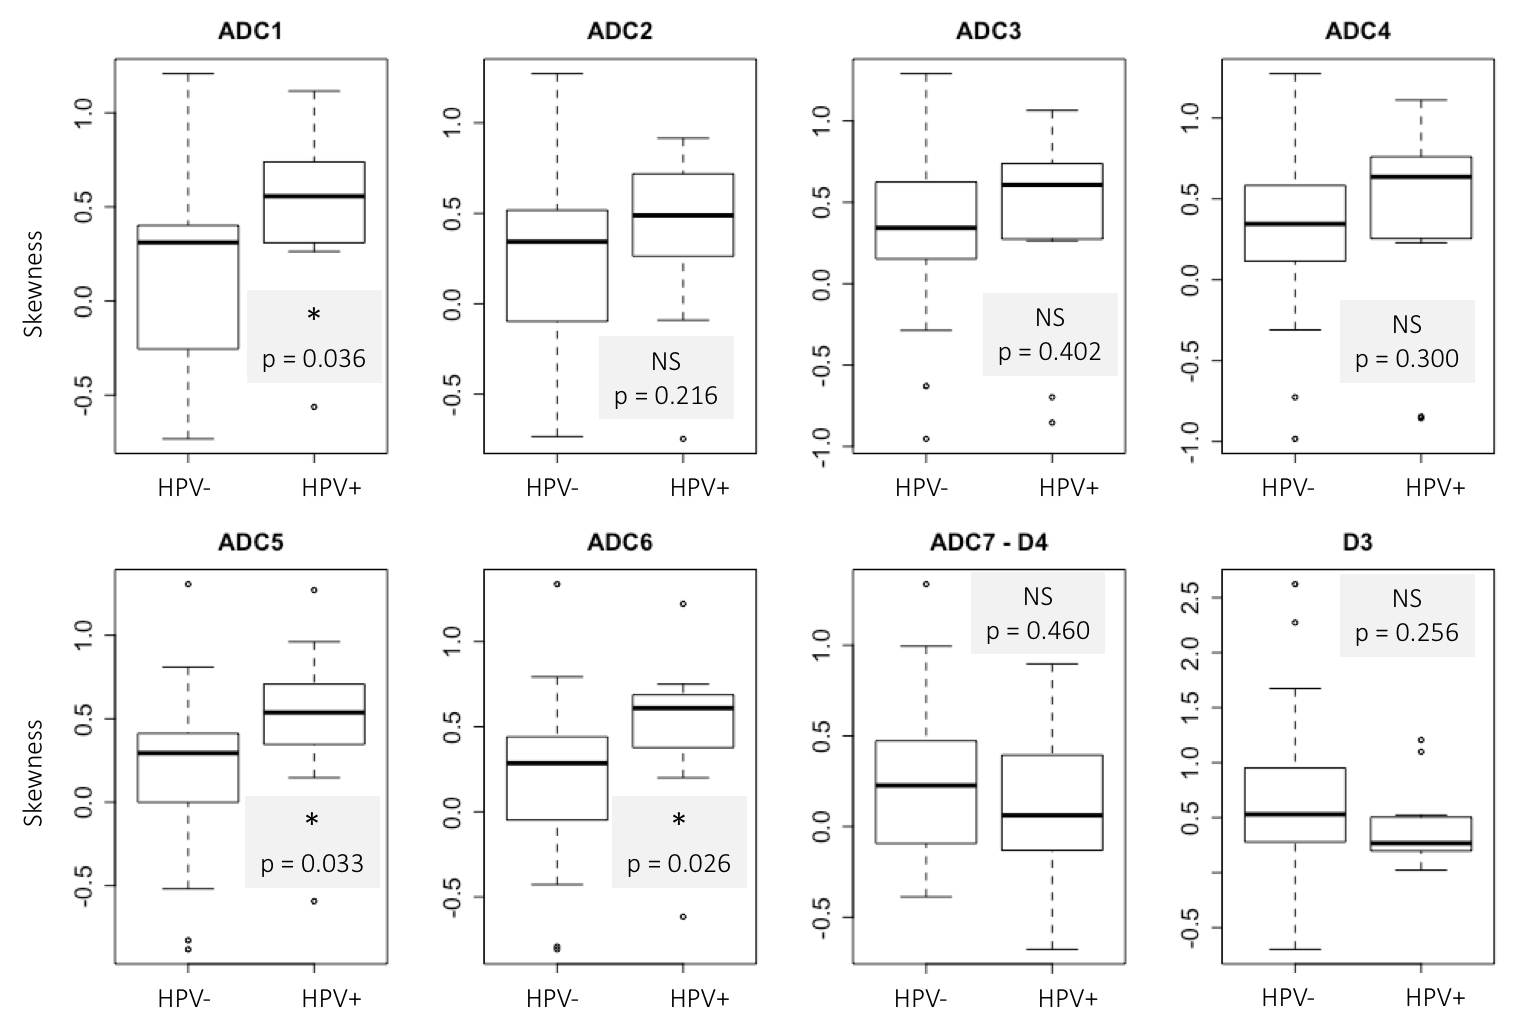
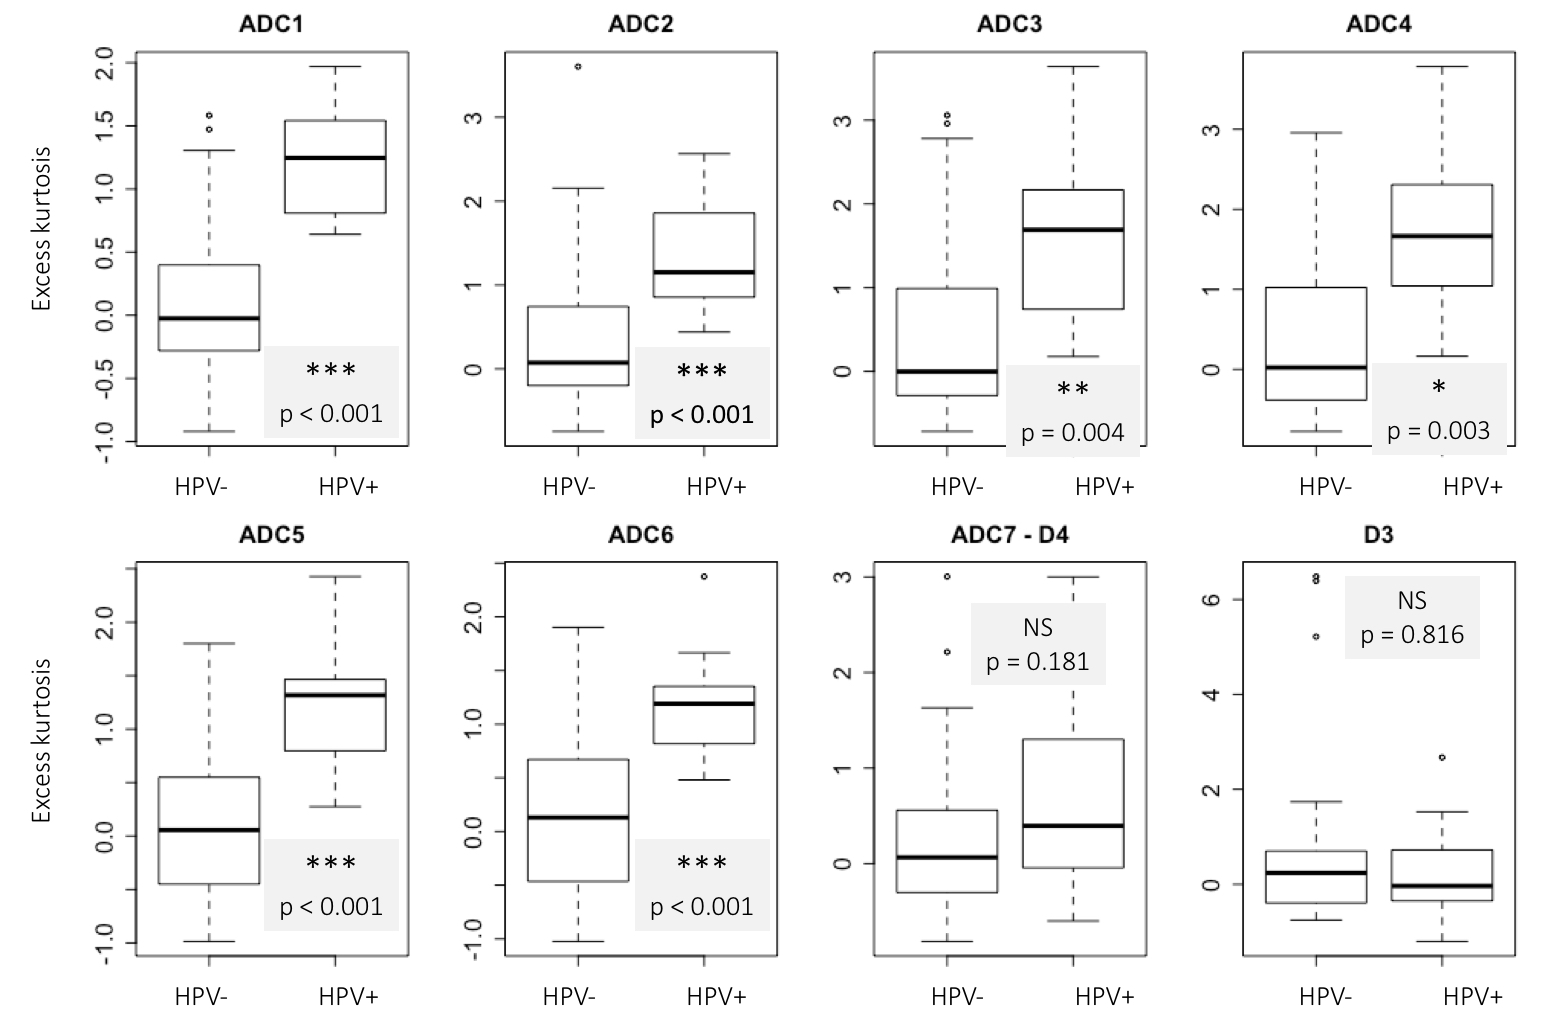
Figure 1 shows the mean ADC (or D) value of tumor ROIs for all patients. There is a statistically significant difference between each of the mean ADC (or D) values with the exception of D3 and D4 and for ADC1 and ADC6. Figure 2 shows the boxplots of mean ADC (or D) values for each calculated map for HPV- and HPV+ tumors. A significantly lower mean ADC for HPV+ HNSCC for all maps except ADC2, D3 and D4 is seen. The observed difference is higher with ADC5 and ADC6 (using 3 and 4 b-values, respectively). Figure 3 shows that only ADC1, ADC5 and ADC6 skewness is significantly different between HPV- and HPV+ cancers with a higher skewness in HPV+ tumors. Finally, figure 4 shows that ADC1 to ADC6 kurtosis is significantly higher in HPV+ than in HPV- HNSCCs, whereas D4 and D3 do not show any difference between kurtosis in both groups.Discussion
The results obtained in this study confirm the results from a previous study3 using ADC calculated with b0-b1000. However, in addition we demonstrate that the choice of b-values is extremely important since some combinations simply fail to discriminate between HPV+ and HPV- lesions, whereas other combinations show high performance with strong statistical differences. In particular, using only high b-values for ADC calculation appears not to be effective to address this specific question (D3 using b750 and b1000 and D4 using b500, b750 and b1000). The best differentiation between the two tumor groups was obtained with a combination of b0 and high b-values ranging from b500 to b1000 (ADC1, ADC5, ADC6). Finally, the acquisition of 6 b-values with the addition of b50 and b100 (ADC4) did not show improved discriminatory results than the choice of only 2 b-values (ADC1: b0 b1000): This result has practical implications, since it allows a major decrease in DWI acquisition time.Conclusion
The question of the right number and choice of b-values certainly requires a specific evaluation depending on the question to be addressed. To discriminate HPV+ from HPV- lesions, our results show that ADC calculated with 2 b-values, b0 and b1000, are sufficient and that ADC calculated only with high b-values (combination excluding b0) are not able to differentiate both tumor types.Acknowledgements
No acknowledgement found.References
1. De Perrot T, Lenoir V, Domingo Ayllon M, et al. Apparent Diffusion Coefficient Histograms of Human Papillomavirus – Positive and Human Papillomavirus – Negative Head and Neck Squamous Cell Carcinoma : Assessment of Tumor Heterogeneity and Comparison with Histopathology. AJNR Am J Neuroradiol. 2017, 38:2153-60.
2. Vandecaveye V, Dirix P, De Keyzer F, et al. Diffusion-weighted magnetic resonance imaging early after chemoradiotherapy to monitor treatment response in head-and-neck squamous cell carcinoma. Int J Radiat Oncol Biol Phys. 2012 1;82(3):1098-107.
3. Le Bihan D, Breton E, Lallemend D, et al. Separation of diffusion and perfusion in intravoxel incoherent motion MR imaging. Radiology. 1988 168(2):497-505.
Figures