1235
Compressed Sensing Accelerated Wideband Myocardial Perfusion Pulse Sequence for Patients with a Cardiac Implantable Electronic Device1Radiology, Northwestern University Feinberg School of Medicine, Chicago, IL, United States, 2Biomedical Engineering, Northwestern University, Evanston, IL, United States, 3Radiology, Mayo Clinic, Rochester, MN, United States, 4Cardiology, Internal Medicine, Northwestern University Feinberg School of Medicine, Chicago, IL, United States
Synopsis
We have recently developed a 2-fold accelerated wideband myocardial perfusion MRI pulse sequence using TGRPPA for imaging patients with a cardiac implantable electronic device (CIED). In patients with rapid heart rates and/or during stress, it may be necessary to further accelerate the perfusion scans to adequately sample the heart. This study describes a 5-fold accelerated wideband myocardial perfusion pulse sequence using compressed sensing and how repeatable it is for quantification of resting myocardial blood flow (MBF) measurement in patients with and without a CIED.
Introduction
Wideband cardiac MRI methods enable suppression of image artifacts induced by a cardiac implantable electronic device (CIED).1-5 We have recently developed a 2-fold accelerated wideband myocardial perfusion MRI pulse sequence using TGRAPPA5. In patients with rapid heart rates and/or during stress, 2-fold acceleration may be inadequate to sample 3 short-axis planes per heartbeat. Even in normal heart rates, it may be desirable to further accelerate the perfusion scans to sample more than 3 short-axis planes per heartbeat, in order to increase the diagnostic confidence and provide a margin of error to read through image artifacts such as the dark rim artifacts. In this study, we sought to develop a 5-fold accelerated wideband myocardial perfusion pulse sequence using compressed sensing (CS)6,7 and evaluated the intra-scan repeatability of quantification of resting myocardial blood flow (MBF) in patients with and without a CIED.Methods
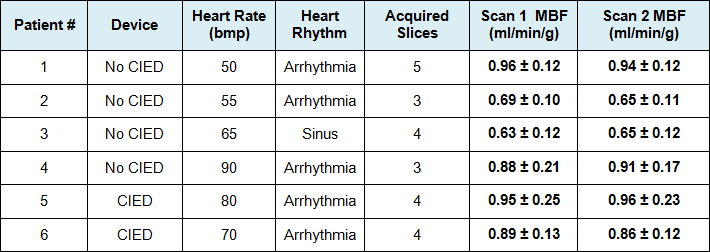
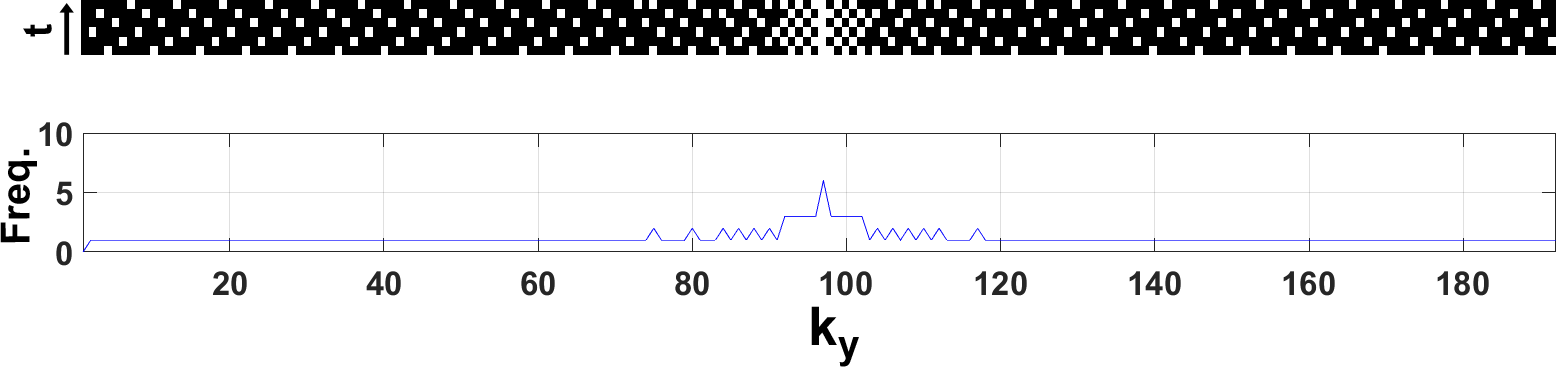
Pulse Sequence: We modified wideband myocardial perfusion pulse sequence5 to employ a 5-fold accelerated ky-t sampling pattern shown in Figure 1. Relevant imaging parameters included: FOV = 400 x 400mm2, slice thickness = 8 mm, matrix = 192 x 192, flip angle = 15°, receiver bandwidth = 744 Hz/pix, TE/TR = 1.40/2.75 msec, saturation-recovery time to the center of k-space (TS) = 100 msec (calculated time delay: 20 msec for arterial input function (AIF) and 100 msec for MBF), repetitions = 60 (58 T1-weighted (T1w) and 2 proton-density (PD) images at the end with 2-second pauses), 3-5 short-axis slices per heartbeat depending on heart rate, and gradient echo readout. One basal short-axis plane was used to sample the AIF with saturation-recovery time to the center of k-space (TS) = 20 msec and centric k-space ordering, and remaining short-axis planes were used to sample the tissue function (TF) with TS = 100 msec and linear k-space ordering. Human Subjects & Injection Protocol: We imaged 4 male patients without a CIED (49.8 ± 17.5 years) and 2 male patients with a CIED (65 and 71 years) at a 1.5T MRI system (Avanto, Siemens). For each patient, two resting perfusion scans were performed with 0.10 mmol/kg of gadobutrol (Gadavist, Bayer) administration (4-5 cc/s) approximately 5 minutes apart, in order to reduce residual contrast agent effects during the second scan. Each patient was instructed to breathe shallow throughout the scan. Image Reconstruction: CS reconstruction was performed with temporal total variation as the sparsifying transform with normalized weight of 0.01 and 50 iterations. During post-processing, we used block-wise matching to further reduce noise.8 MBF Quantification: Advanced Normalization Tools (ANTs; http://picsl.upenn.edu/software/ants/) was implemented to perform motion correction. T1-weighted images were normalized by the PD images to correct for unknown equilibrium magnetization and then T1 was calculated using a Bloch equation.9 Assuming fast water exchange and relaxivity constants of gadobutrol, we converted T1 to gadobutrol concentration, in order to obtain AIF and tissue function curves. Finally, MBF was quantified on a pixel-by-pixel using Fermi deconvolution model10. Statistical Analysis: We pooled all patient data to compare resting MBF measurements. We manually drew ROIs of LV cavity for AIF and whole myocardium to calculated mean resting MBF values. Test-retest data pairs were compared using a paired t-test and linear regression and Bland-Altman analyses. p<0.05 was considered statistically significant.Results
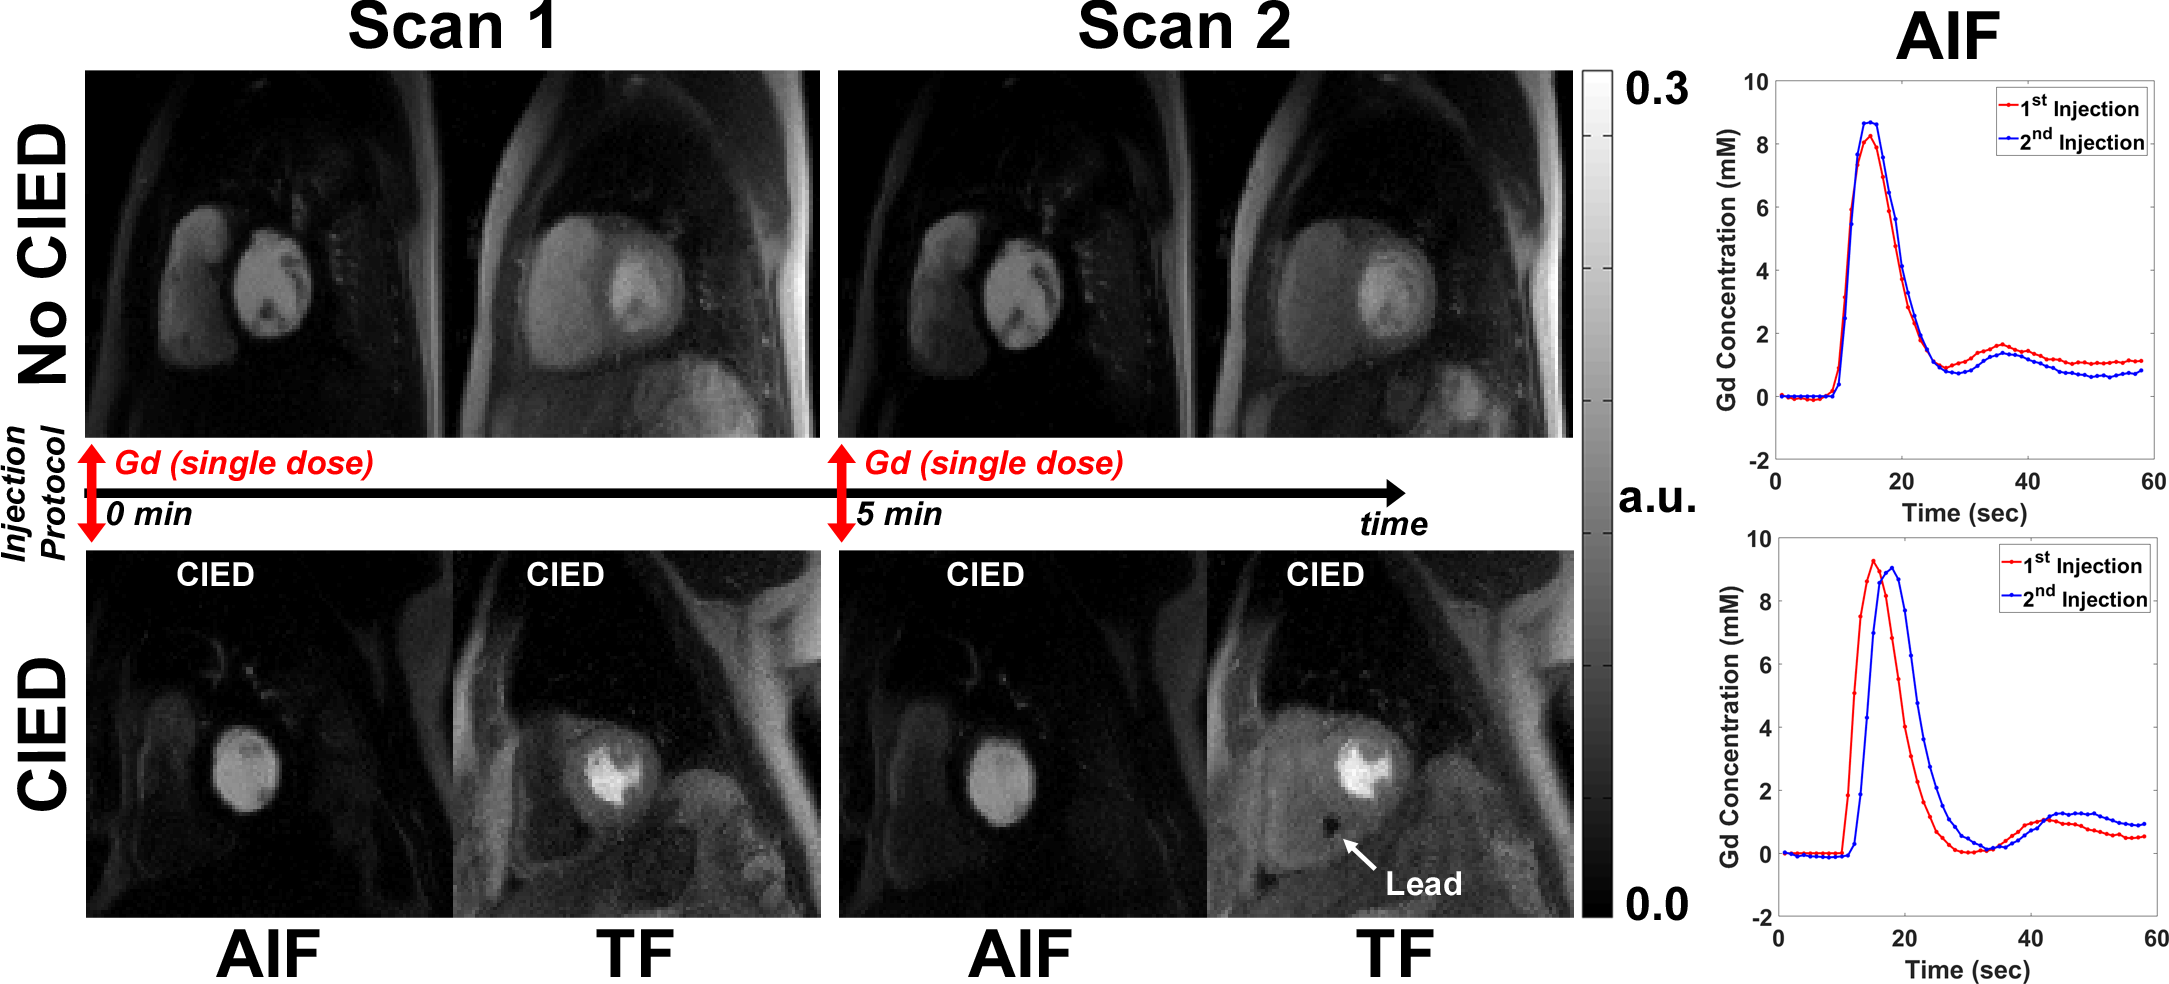
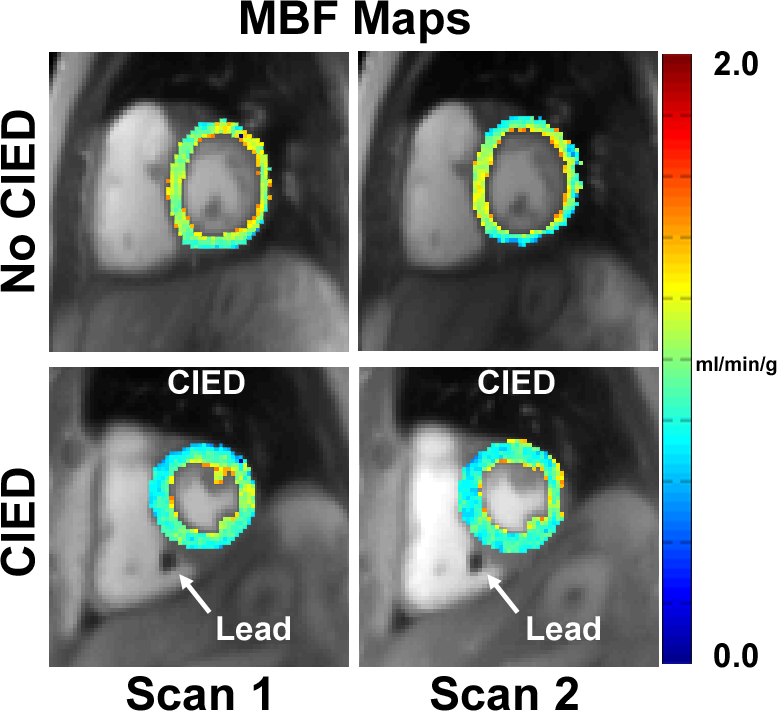
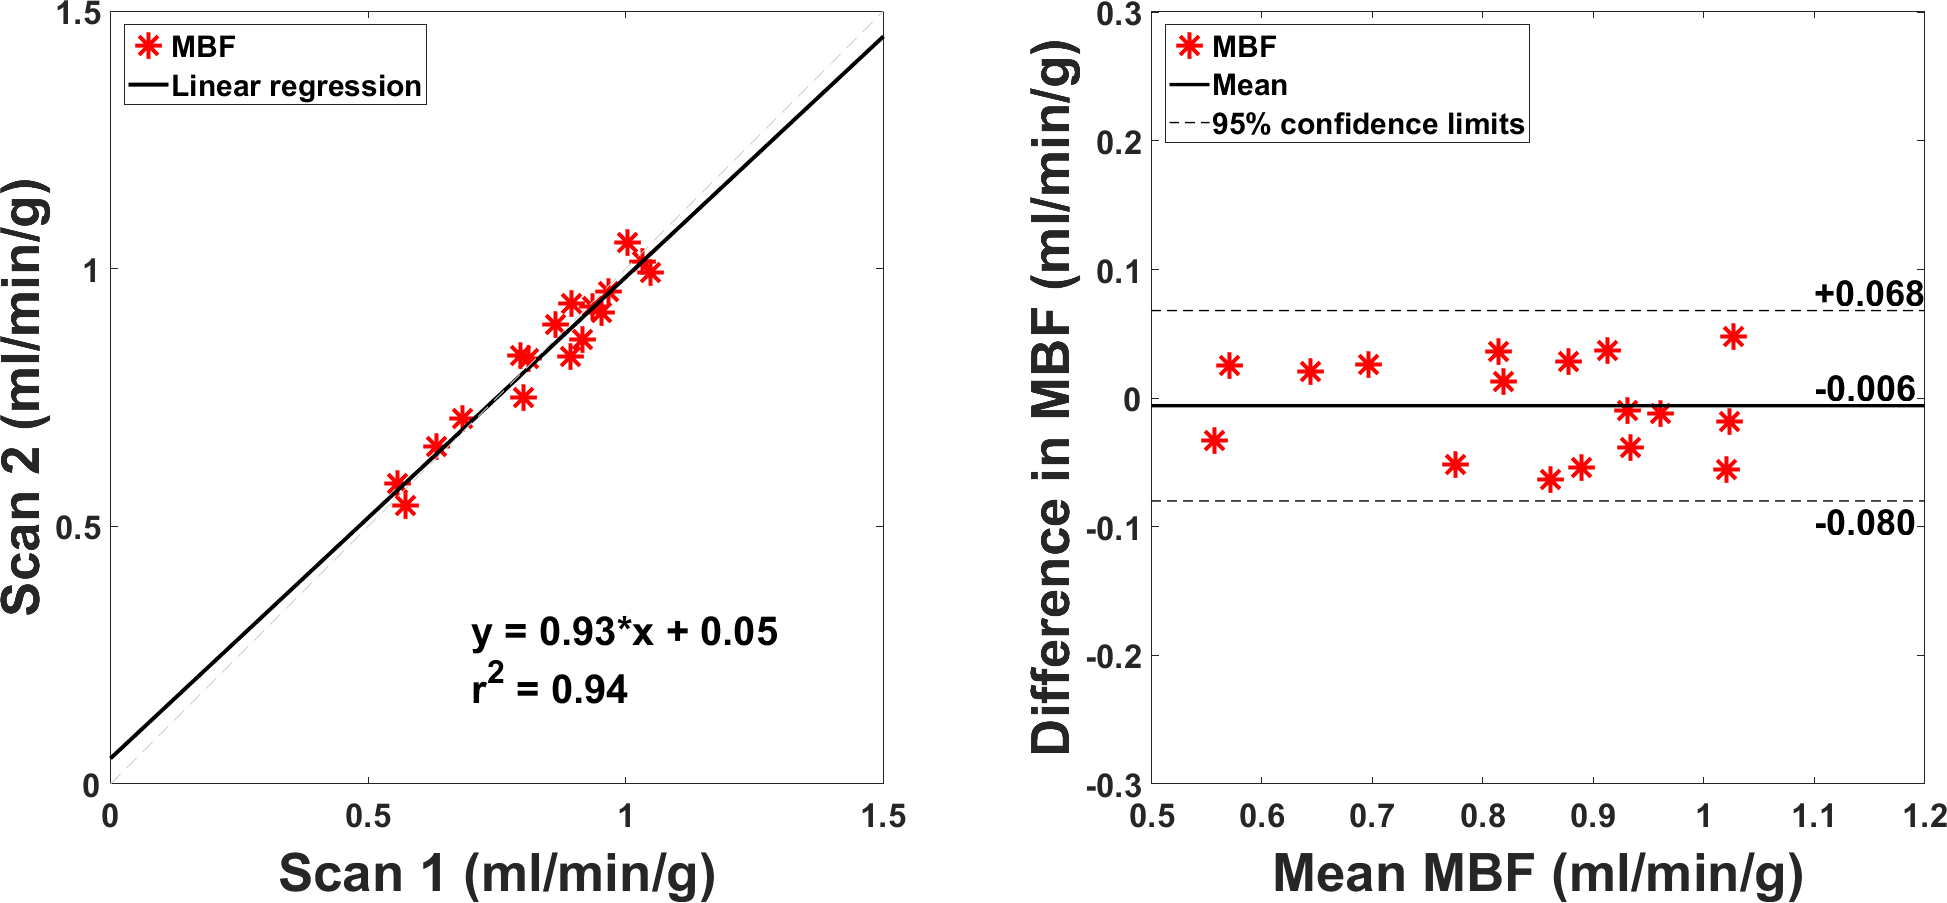
Figure 2 shows representative AIF and tissue function images at peak enhancement for scans 1 and 2 in one non-device patient and another with a CIED. Figure 3 shows the corresponding MBF maps calculated from the patients shown in Figure 2. For 6 patients examined, between scans 1 and 2, mean MBF was not significantly (p=0.53) different (Table 1). These resting MBF values agree with literature.7,11,12 As shown in Figure 4, repeated MBF values were strongly correlated (r2=0.94) and in good agreement (mean difference = -0.006 ml/min/g [-0.70 % of mean]; coefficient of repeatability = 0.074 ml/min/g [8.79% of mean]).Discussion
This study demonstrated that 5-fold accelerated wideband myocardial perfusion pulse sequence with CS produced MBF values that agree with literature and are reproducible, including patients with a CIED. Future work includes evaluation in a diverse population with a variety of CIED types.Acknowledgements
This work was supported in part by the following grants: NIH R01HL116895, R01HL138578, R21EB024315, R21AG055954References
1. Rashid S, Rapacchi S, Vaseghi M, Tung R, Shivkumar K, Finn JP, Hu P. Improved late gadolinium enhancement MR imaging for patients with implanted cardiac devices. Radiology 2014;270(1):269-274.
2. Shao J, Rashid S, Renella P, Nguyen KL, Hu P. Myocardial T1 mapping for patients with implanted cardiac devices using wideband inversion recovery spoiled gradient echo readout. Magn Reson Med 2017;77(4):1495-1504.
3. Ranjan R, McGann CJ, Jeong EK, Hong K, Kholmovski EG, Blauer J, Wilson BD, Marrouche NF, Kim D. Wideband late gadolinium enhanced magnetic resonance imaging for imaging myocardial scar without image artefacts induced by implantable cardioverter-defibrillator: a feasibility study at 3 T. Europace 2015;17(3):483-488.
4. Hong K, Jeong EK, Wall TS, Drakos SG, Kim D. Wideband arrhythmia-Insensitive-rapid (AIR) pulse sequence for cardiac T1 mapping without image artifacts induced by an implantable-cardioverter-defibrillator. Magn Reson Med 2015;74(2):336-345.
5. Hong K, Collins JD, Knight BP, Carr JC, Lee DC, Kim D. Wideband myocardial perfusion pulse sequence for imaging patients with a cardiac implantable electronic device. Magn Reson Med 2018.
6. Lustig M, Donoho D, Pauly JM. Sparse MRI: The application of compressed sensing for rapid MR imaging. Magn Reson Med 2007;58(6):1182-1195.
7. Naresh N, Haji-valizadeh H, Aouad P, Barrett M, Chow K, Ragin A, Collins J, Carr J, Lee D, Kim D. Accelerated, first-pass cardiac perfusion pulse sequence with radial k-space sampling, compressed sensing, and KWIC reconstruction tailored for visual analysis and quantification of MBF. Magn Reson Med (in press).
8. Dabov K, Foi A, Katkovnik V, Egiazarian K. Image denoising by sparse 3-D transform-domain collaborative filtering. IEEE Trans Image Process 2007;16(8):2080-2095.
9. Cernicanu A, Axel L. Theory-based signal calibration with single-point T1 measurements for first-pass quantitative perfusion MRI studies. Acad Radiol 2006;13(6):686-693.
10. Christian TF, Rettmann DW, Aletras AH, Liao SL, Taylor JL, Balaban RS, Arai AE. Absolute myocardial perfusion in canines measured by using dual-bolus first-pass MR imaging. Radiology 2004;232(3):677-684.
11. Murthy VL, Bateman TM, Beanlands RS, Berman DS, Borges-Neto S, Chareonthaitawee P, Cerqueira MD, deKemp RA, DePuey EG, Dilsizian V, Dorbala S, Ficaro EP, Garcia EV, Gewirtz H, Heller GV, Lewin HC, Malhotra S, Mann A, Ruddy TD, Schindler TH, Schwartz RG, Slomka PJ, Soman P, Di Carli MF. Clinical Quantification of Myocardial Blood Flow Using PET: Joint Position Paper of the SNMMI Cardiovascular Council and the ASNC. J Nucl Med 2018;59(2):273-293.
12. Kellman P, Hansen MS, Nielles-Vallespin S, Nickander J, Themudo R, Ugander M, Xue H. Myocardial perfusion cardiovascular magnetic resonance: optimized dual sequence and reconstruction for quantification. J Cardiovasc Magn Reson 2017;19(1):43.
Figures