1233
Improving the accuracy of Blood Oxygen Level Dependent Imaging using FLASH normalised T2 prepared SSFP acquisition1Radcliffe Department of Medicine, Oxford Centre for Clinical Magnetic Resonance Research, University of Oxford, Oxfordshire, United Kingdom
Synopsis
T2-prepared
Introduction
Blood oxygen level dependent (BOLD) imaging permits the non-invasive assessment of myocardial oxygenation, by harnessing the paramagnetic property of deoxyhaemoglobin as intrinsic contrast. BOLD CMR offers promise as a gadolinium-free alternative for ischemia detection, particularly in the setting of flow-limiting coronary stenoses and microvascular dysfunction.1-4 T2-prepared steady state free precession (SSFP) has increasingly been used for the assessment of myocardial oxygenation.1 However, its clinical utility remains limited due to wide normal ranges, reducing its diagnostic performance .4 This is in part because of the need for heart rate (HR) correction of signal intensities (SI) as a result of incomplete T1 recovery between T2 preparation pulses and associated images. Kellman et al reported a modified T2-prepared SSFP sequence for imaging myocardial oedema aimed at reducing surface coil sensitivity variations.5 By interleaving a low-flip angle FLASH reference images between the SSFP readouts, spatial SI variations can be removed. We hypothesized that these interleaved FLASH reference images could also remove the need for HR correction, by sampling the changes in steady state longitudinal magnetization due to changing HR. To test this hypothesis, we assessed if FLASH-normalised T2-prepared SSFP BOLD improves both variability and reproducibility of stress BOLD response over standard T2-prepared SSFP BOLD.Methods
Twenty healthy participants underwent CMR in a 3 Tesla Trio (Siemens, Erlangen, Germany) for cine, adenosine stress BOLD and perfusion imaging. Cardiac-gated B0 shimming (Siemens WIP 452) and center of frequency adjustments were performed before cine and BOLD imaging. A single mid-ventricular BOLD slice was acquired using the ECG-gated T2-prepared segmented SSFP sequence with interleaved low flip angle FLASH reference readouts on alternate heartbeats 5 (Siemens WIP 567, VB17). The sequence parameters were: TEprep = 40ms, SSFP TR/TE = 2.86ms/1.43ms, 72 readout lines per heartbeat, and an SSFP flip angle of 44°. The SSFP and FLASH data were acquired in an interleaved fashion over three heartbeats each (six in total) with dummy SSFP and FLASH acquisitions beforehand (eight heartbeats total). Adenosine was infused at a dose of 140 mcg/kg/min and at peak vasodilator stress, a slice-matched stress BOLD image was acquired. Following the acquisition of the stress BOLD image, first pass perfusion imaging was undertaken as previously described.6 The sequence outputs two images, the SSFP image alone, labelled “mag”, and SSFP normalised by the interleaved FLASH image, labelled “norm”. We use “standard” or sBOLD and “normalised”or nBOLD to refer to the images and SI derived from them. Heart rate correction was applied to sBOLD SI based on previously described methods,7 adjusted for the sequence timing used here. Stress BOLD response or ∆SI was defined as a relative increase in BOLD SI from rest to stress: ((Stress BOLD SI - Rest BOLD SI)/Rest BOLD)*100Result
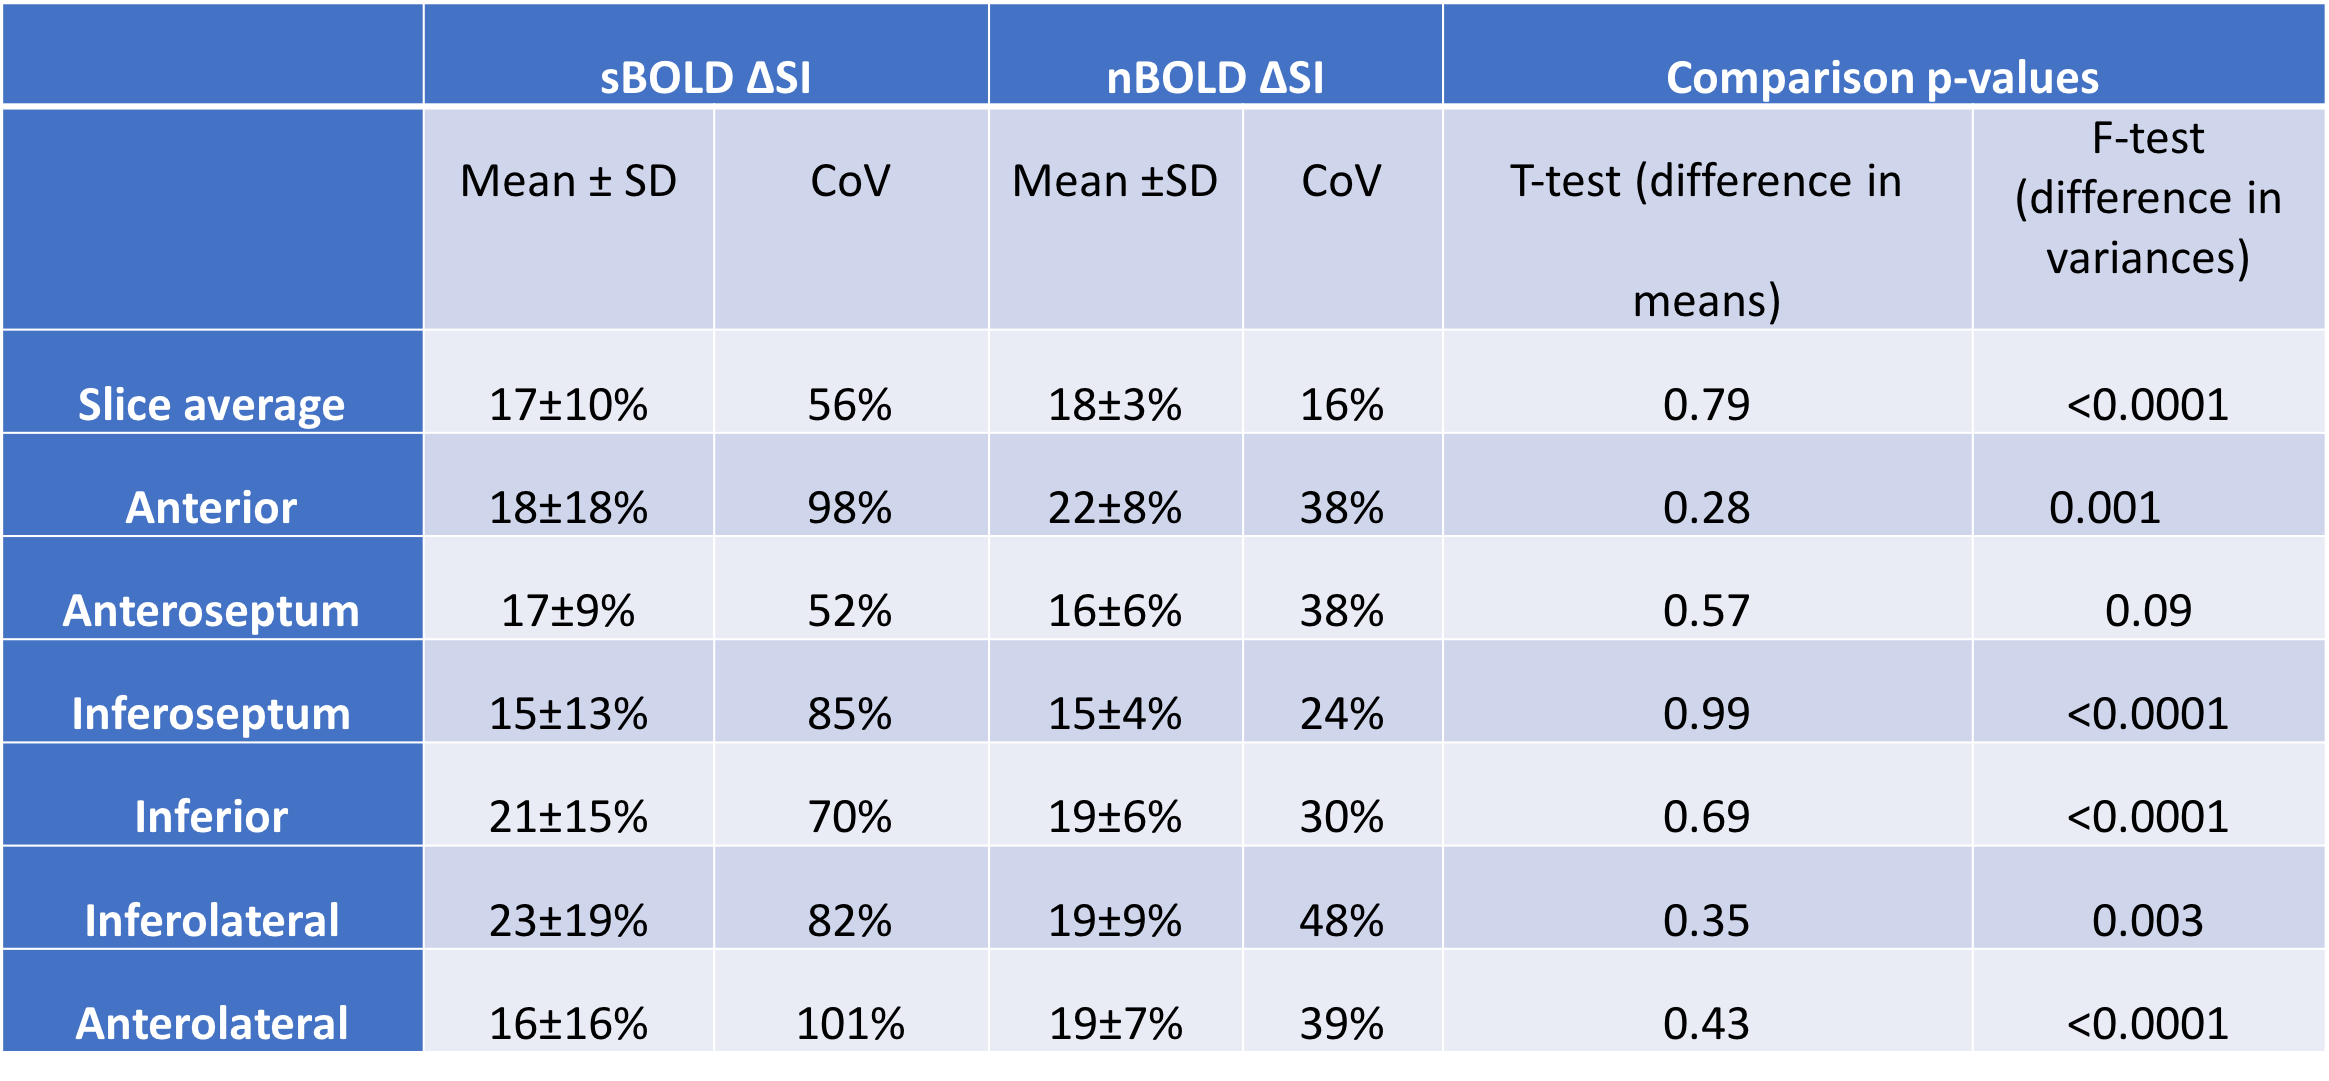
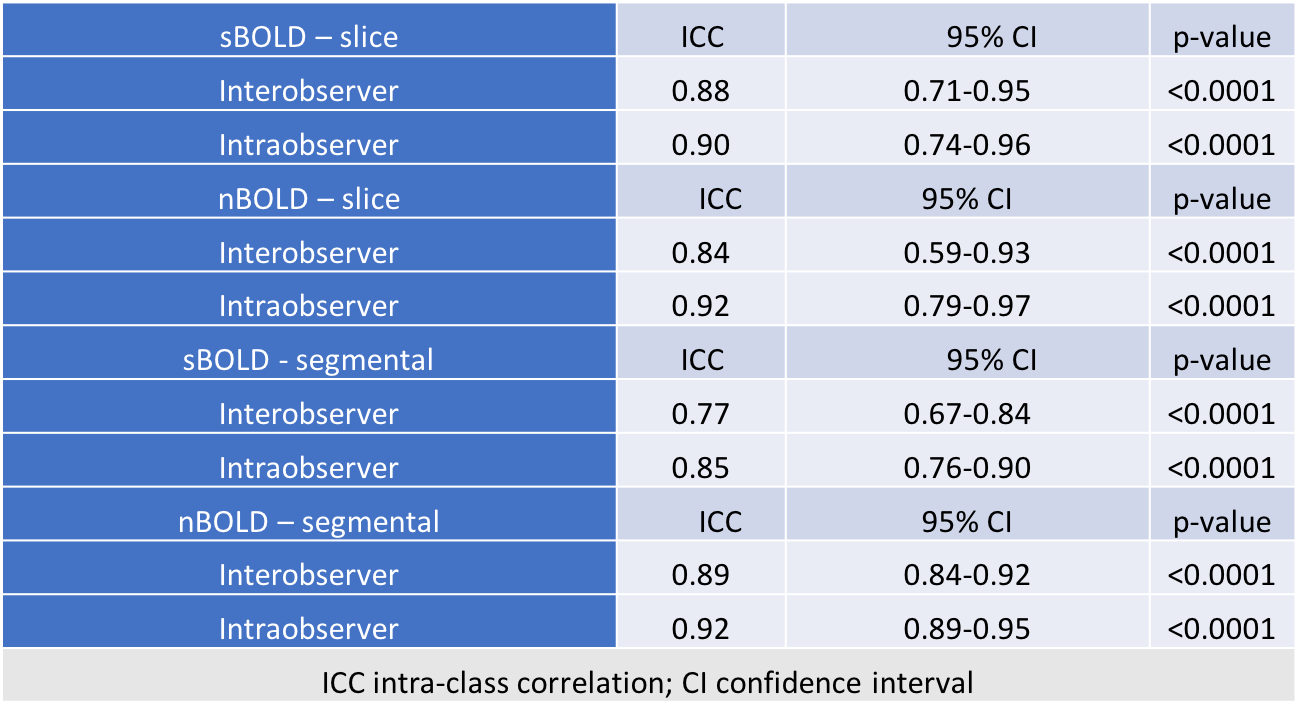
All subjects (mean age 44±12 yrs; 55% male) had normal myocardial perfusion reserve and left ventricular indices. The mean HR corrected standard SSFP SI (sBOLD SI) and (HR uncorrected) normalised SI (nBOLD SI) at rest and stress are shown in Table 1. Normalised SI displayed significantly lower variance (F-test, p<0.0001) compared to standard SI. Mean standard and normalised BOLD ∆SI for healthy subjects were similar at 17±10% and 18±3% respectively (p=0.79) with coefficients of variation of 59% and 17% respectively (Figure 1). At a segmental level, sBOLD response was more variable than nBOLD (p<0.01) in all segments apart from the anteroseptal segment (Table 2). In a linear mixed effects model, sBOLD ∆SI showed dependence on stress heart rate (0.23%/bpm), but nBOLD ∆SI did not. The inter- and intra-observer intraclass correlation coefficients were higher for nBOLD ∆SI at a segmental level (Table 3). The application of a colour map to normalised BOLD images allowed the qualitative assessment of tissue oxygenation (Figure 2).
Discussion
We have demonstrated that the normalisation of T2 prepared SSFP-BOLD images by interleaved FLASH images considerably reduces both segmental and individual variability of the derived BOLD ∆SI without altering the size of BOLD effect measured. FLASH normalisation not only corrects for surface coil sensitivity variation5 but also provides a sample of the longitudinal magnetization avoiding the need for HR correction, demonstrated by a lack of HR dependence of nBOLD ∆SI. The improved segmental variability of rest and stress nBOLD signal intensities further enabled the application of a colour map directly to the normalised BOLD images permitting the qualitative appreciation of changes in the oxygen-sensitive signal during vasodilator stress. Conclusion
FLASH-normalised T2-prepared SSFP BOLD produces highly reproducible signal intensities, with a normal BOLD response of 18±3%. Normalised BOLD colour maps allow the direct visualization of oxygen-sensitive signal offering potential for direct clinical application and incorporation into clinical workflow.Acknowledgements
This study was funded by the National Institute of Health Research Oxford Biomedical Research Centre and the British Heart Foundation. BR and EMT were funded by the National Institute of Health Research Oxford Biomedical Research Centre. RA was funded by a British Heart Foundation Clinical Research Training Fellowship grant (RA: 098436/Z/12/Z). K.C was supported by an NIHR academic clinical fellowship. AH and SN acknowledge support from the Oxford British Heart Foundation Center of Research Excellence (RE/13/1/30181).References
1. Vohringer M, Flewitt JA, Green JD et al. Oxygenation-sensitive CMR for assessing vasodilator-induced changes of myocardial oxygenation. J Cardiovasc Magn Reson 2010;12:20.
2. Karamitsos TD, Dass S, Suttie J et al. Blunted myocardial oxygenation response during vasodilator stress in patients with hypertrophic cardiomyopathy. J Am Coll Cardiol 2013;61:1169-76.
3. Parnham S, Gleadle JM, Bangalore S et al. Impaired Myocardial Oxygenation Response to Stress in Patients With Chronic Kidney Disease. J Am Heart Assoc 2015;4:e002249.
4. Arnold JR, Karamitsos TD, Bhamra-Ariza P et al. Myocardial oxygenation in coronary artery disease: insights from blood oxygen level-dependent magnetic resonance imaging at 3 tesla. J Am Coll Cardiol 2012;59:1954-64.
5. Kellman P, Aletras AH, Mancini C, McVeigh ER, Arai AE. T2-prepared SSFP improves diagnostic confidence in edema imaging in acute myocardial infarction compared to turbo spin echo. Magn Reson Med 2007;57:891-7.
6. Dass S, Cochlin LE, Suttie JJ et al. Exacerbation of cardiac energetic impairment during exercise in hypertrophic cardiomyopathy: a potential mechanism for diastolic dysfunction. European heart journal 2015;36:1547-54.
7. Karamitsos TD, Leccisotti L, Arnold JR et al. Relationship between regional myocardial oxygenation and perfusion in patients with coronary artery disease: insights from cardiovascular magnetic resonance and positron emission tomography. Circ Cardiovasc Imaging 2010;3:32-40.
Figures
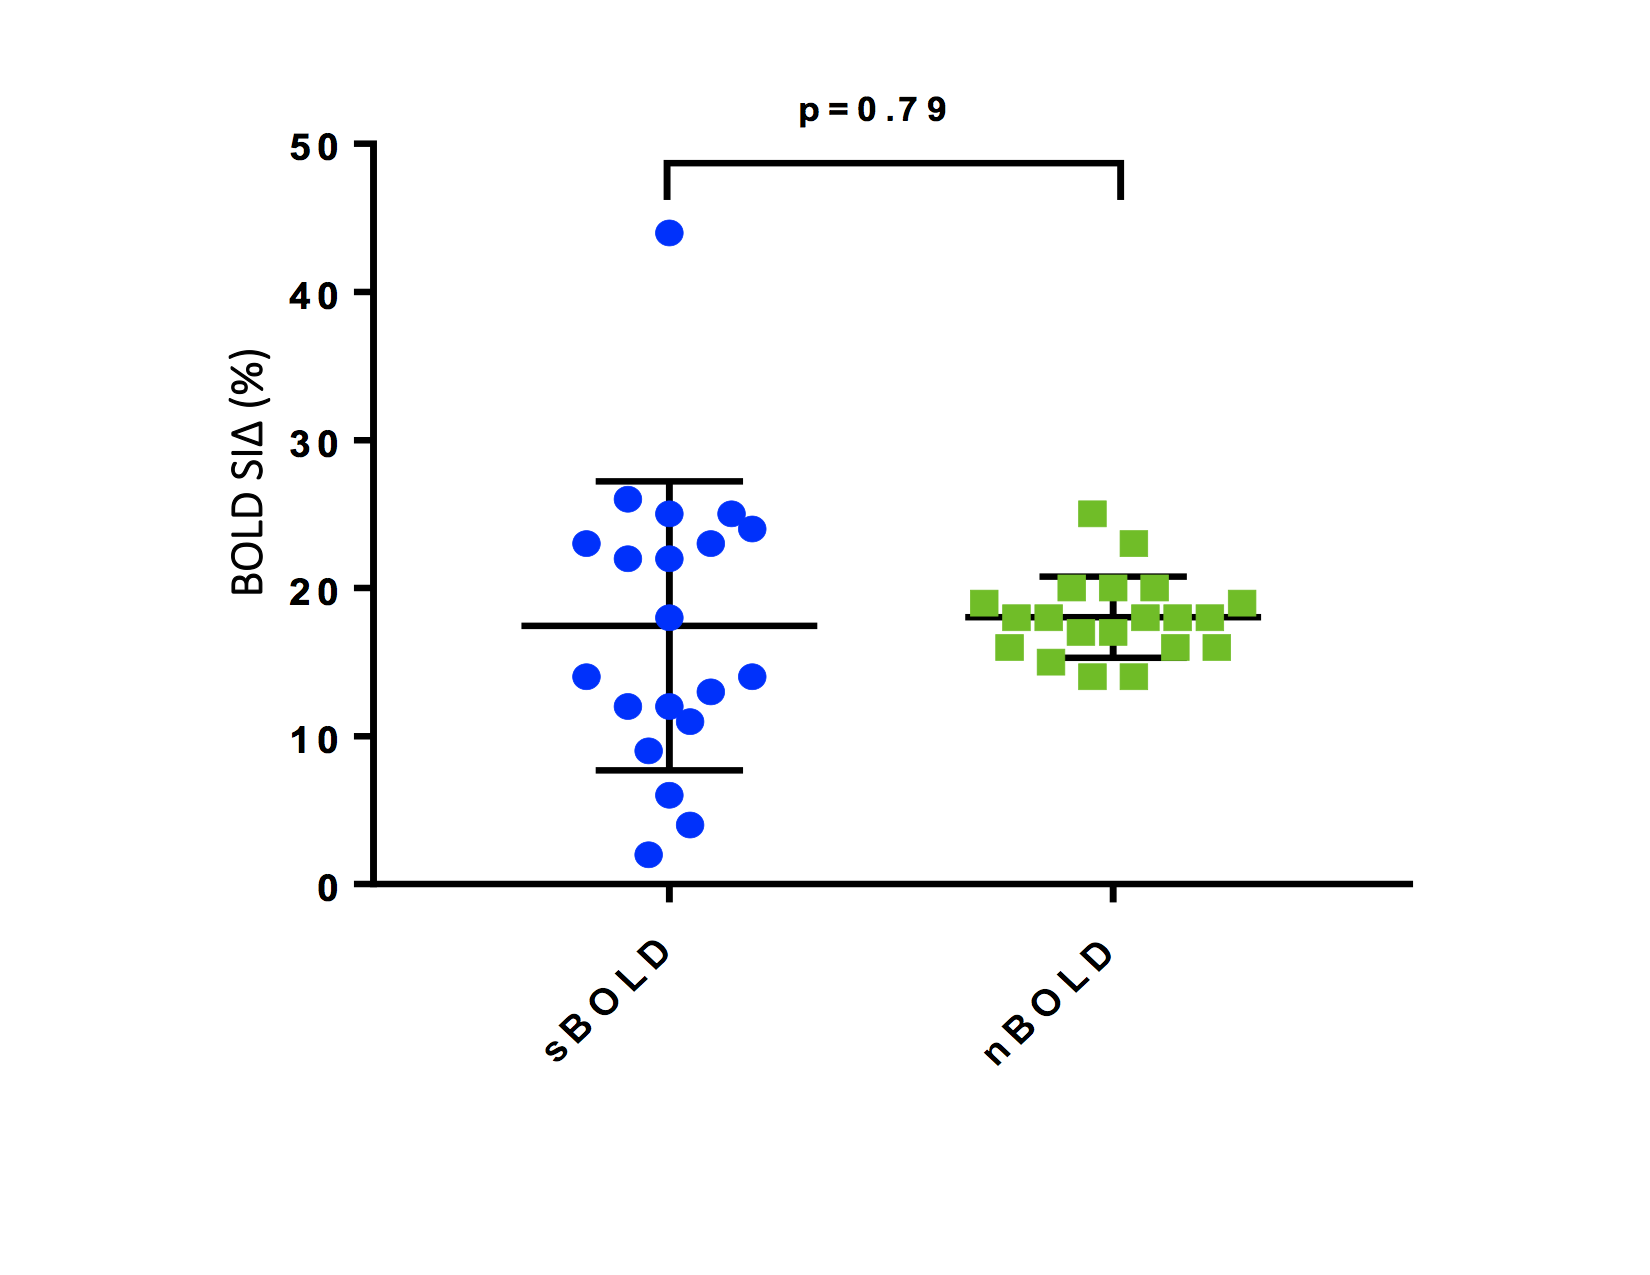
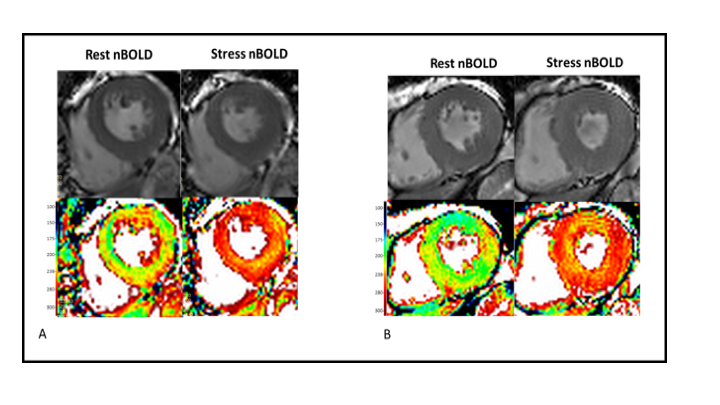
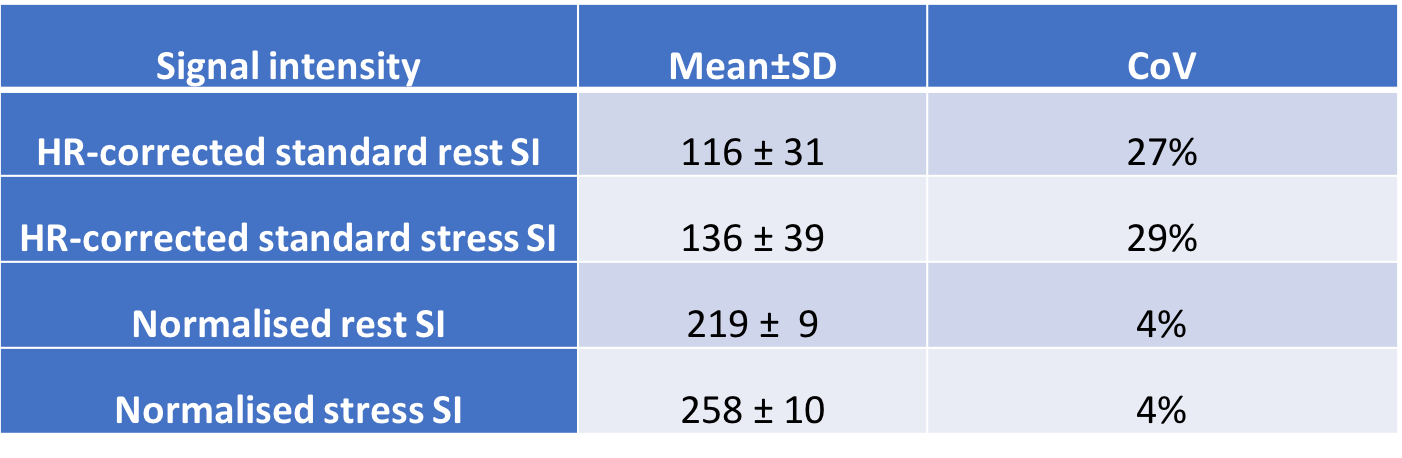
Table 1. Average signal intensities and coefficients of variance for rest and stress sBOLD and nBOLD at the slice level