1231
On Probing Intravoxel Incoherent Motion in the Heart using Spin Echo versus Stimulated Echo Diffusion Weighted Imaging1Institute for Biomedical Engineering, ETH Zurich, Zurich, Switzerland
Synopsis
Intravoxel Incoherent Motion (IVIM) imaging in the heart remains challenging resulting in large variation of the perfusion surrogates in practice. In the present work, IVIM sensitivity of standard and motion-compensated Spin Echo (SE) and Stimulated Echo Acquisition Mode (STEAM) diffusion-weighted imaging approaches are analyzed using Monte Carlo simulations and perfused porcine heart experiments. An extended IVIM model is proposed to account for the microstructural properties of the myocardium. It is demonstrated that motion-compensated SE sequences provide insufficient perfusion sensitivity. In contrast, STEAM allows delineating hypoperfused myocardium using experimental imaging data.
Introduction
The Intravoxel Incoherent Motion (IVIM)1 model has been used to assess perfusion surrogates in the heart of healthy volunteers2–4, patient cohorts5,6 and in animal models (pigs7, dogs8). However, IVIM imaging in the heart remains challenging despite technical advances of cardiac diffusion imaging9–11. In practice, the IVIM perfusion parameters have a relatively high variation compared to diffusion estimates due to the relatively small influence of perfusion on the magnitude signal and the inherent non-linearity of the model. Accordingly, the assumptions of the IVIM model such as anisotropic microcirculation and sufficient directional changes of spins undergoing perfusion require further investigation. Recent cardiac diffusion acquisition strategies using first- and second-order motion compensated spin-echo (SE) sequences (M112, M29) prompt for careful considerations concerning their perfusion sensitivity compared to the conventional Stejskal-Tanner experiment (M013).
It is the objective of the present work to systematically investigate IVIM sensitivity of Spin Echo (SE) and Stimulated Echo Acquisition Mode (STEAM) diffusion-weighted imaging approaches using Monte Carlo simulations and perfused porcine hearts.
Theory & Methods
The concept of normalized phase distributions14 in Equation 1 (trajectory $$${\bf{x}} \left( t \right)$$$, gradient profile $$${{\bf{g}}_h}\left( t \right)$$$ and velocity $$${{\bf{v}}} \left( t \right)$$$):
$$\phi = \gamma \int\limits_0^T {\bf{x}} \left( t \right) \cdot {{\bf{g}}_h}\left( t \right)dt = - \gamma \int\limits_0^T {\left( {\int\limits_0^t {{{\bf{g}}_h}\left( {t'} \right)dt'} } \right) \cdot {\bf{v}}} \left( t \right)dt \qquad (1)$$
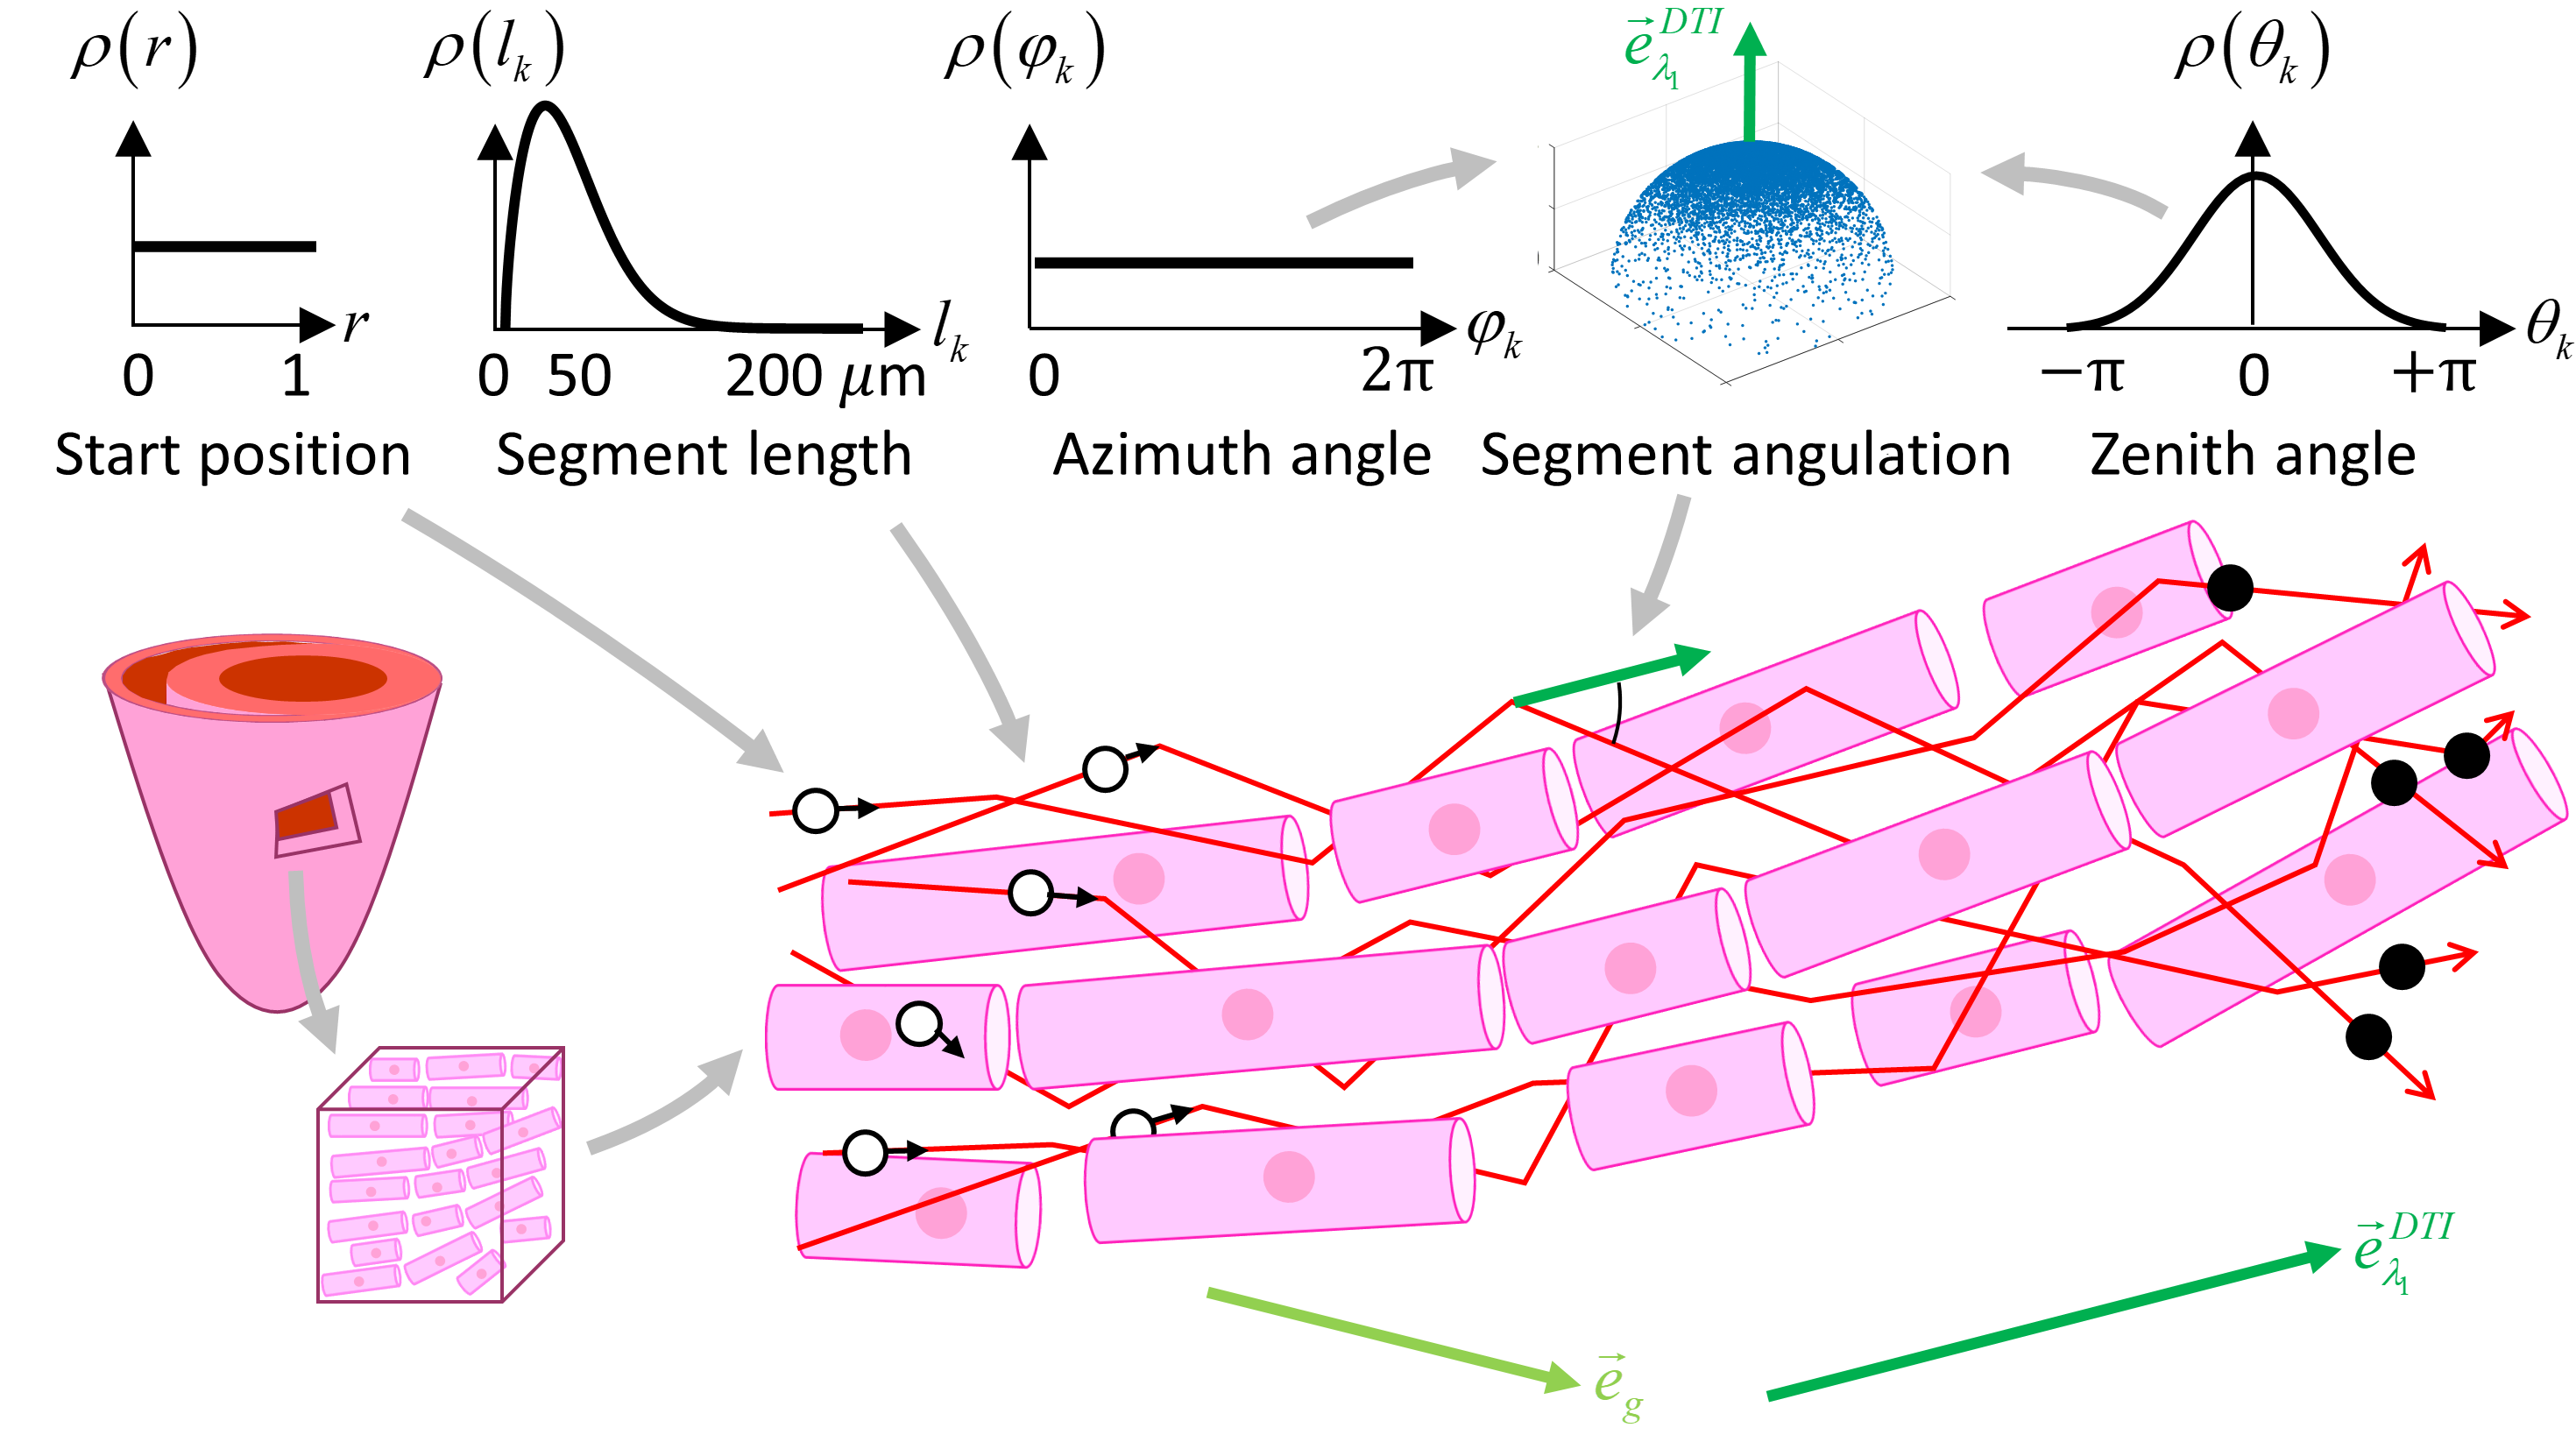
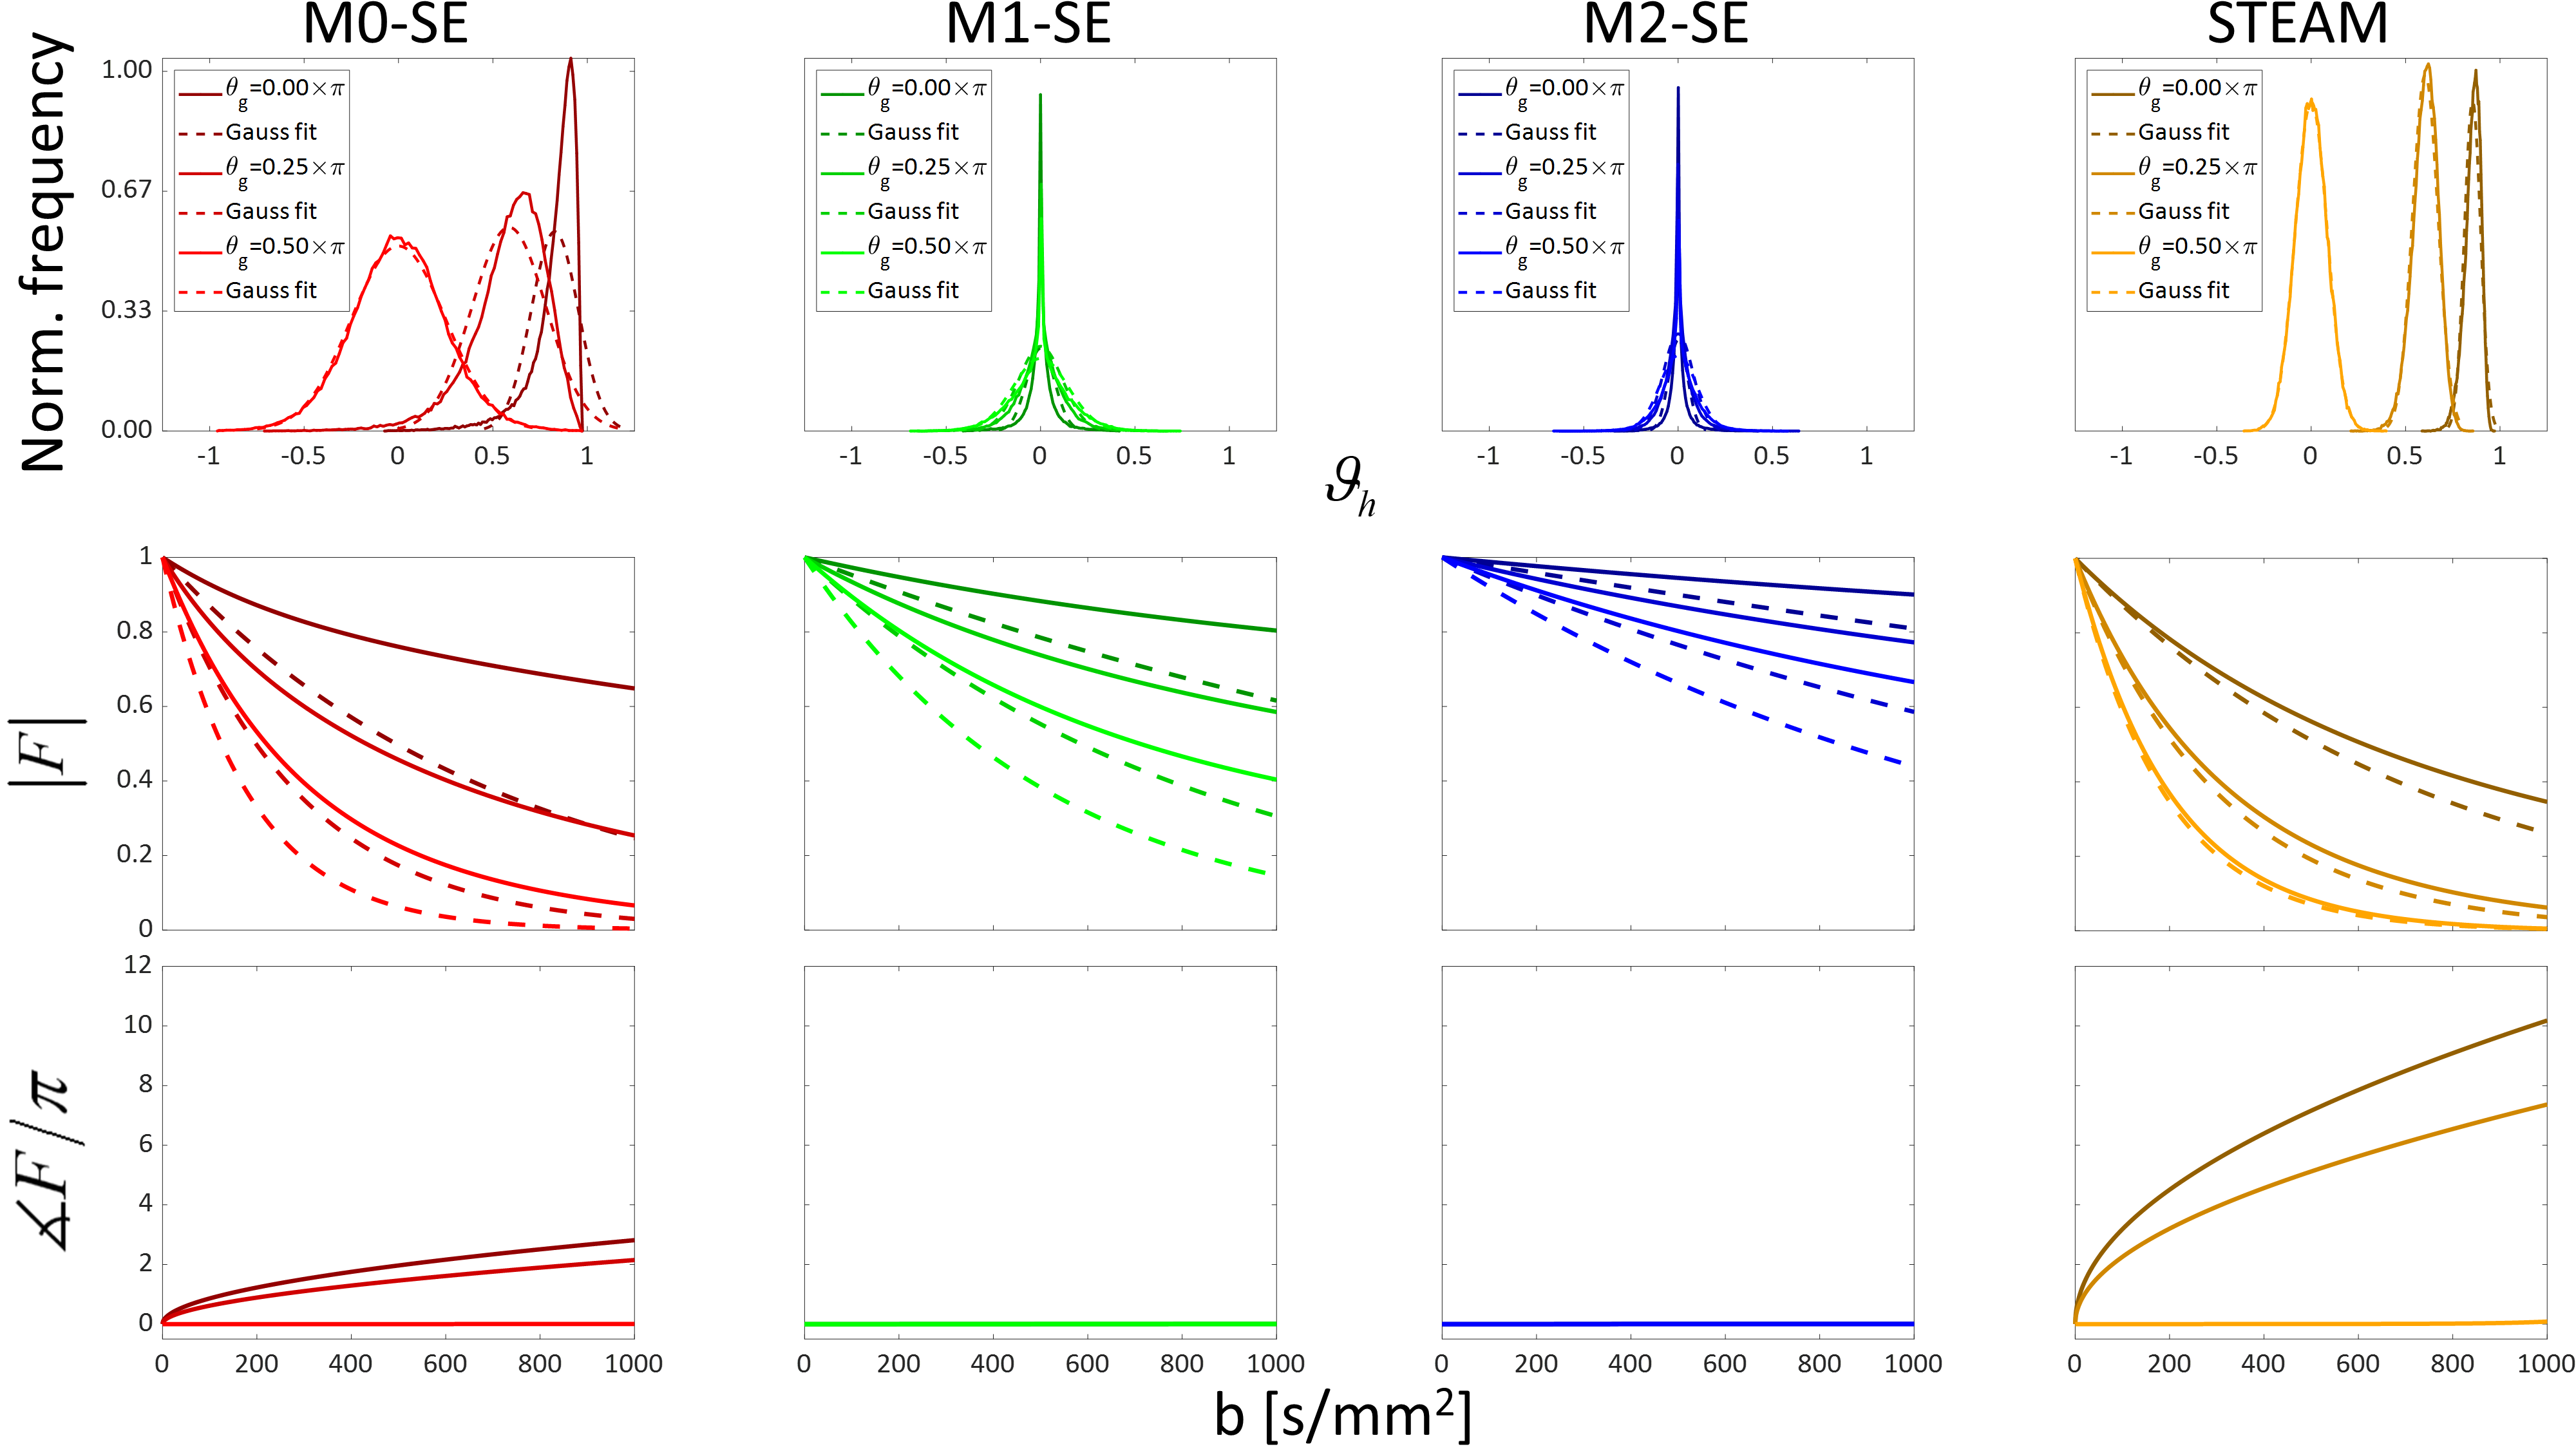
and $$$\phi = v\sqrt {bT} {\vartheta _h}$$$ is used in simulations (Figure 1) and extended by histological findings: the capillary segments15 are scattered along a main direction using a von Mises distribution16–18. The segment lengths follow a Weibull distribution16 and flow velocity is set to 1 mm/s8,19. Magnitude attenuation and phase is determined using 105 simulated spins via Equation 2:
$$F = \left\langle {\exp \left( {i\phi } \right)} \right\rangle \qquad(2)$$
Simulation parameters are: total gradient duration $$$T$$$=105.30ms (SE), 60/44s=1363.60ms (STEAM), gradient lobe duration $$$\delta$$$=10.40/21.25/15.04/3.40ms for M0/M1/M2/STEAM. Zenith angle concentration $$$\kappa$$$=2.520,21, maximum zenith angle 0.5223π (corresponds to 6% back-flow17), gradient azimuth angle zero and length mean/standard deviation $$${\mu _l}/{\sigma _l}$$$=60/40μm16. A Gaussian Phase Approximation (GPA) is derived after correcting for a non-vanishing net phase.
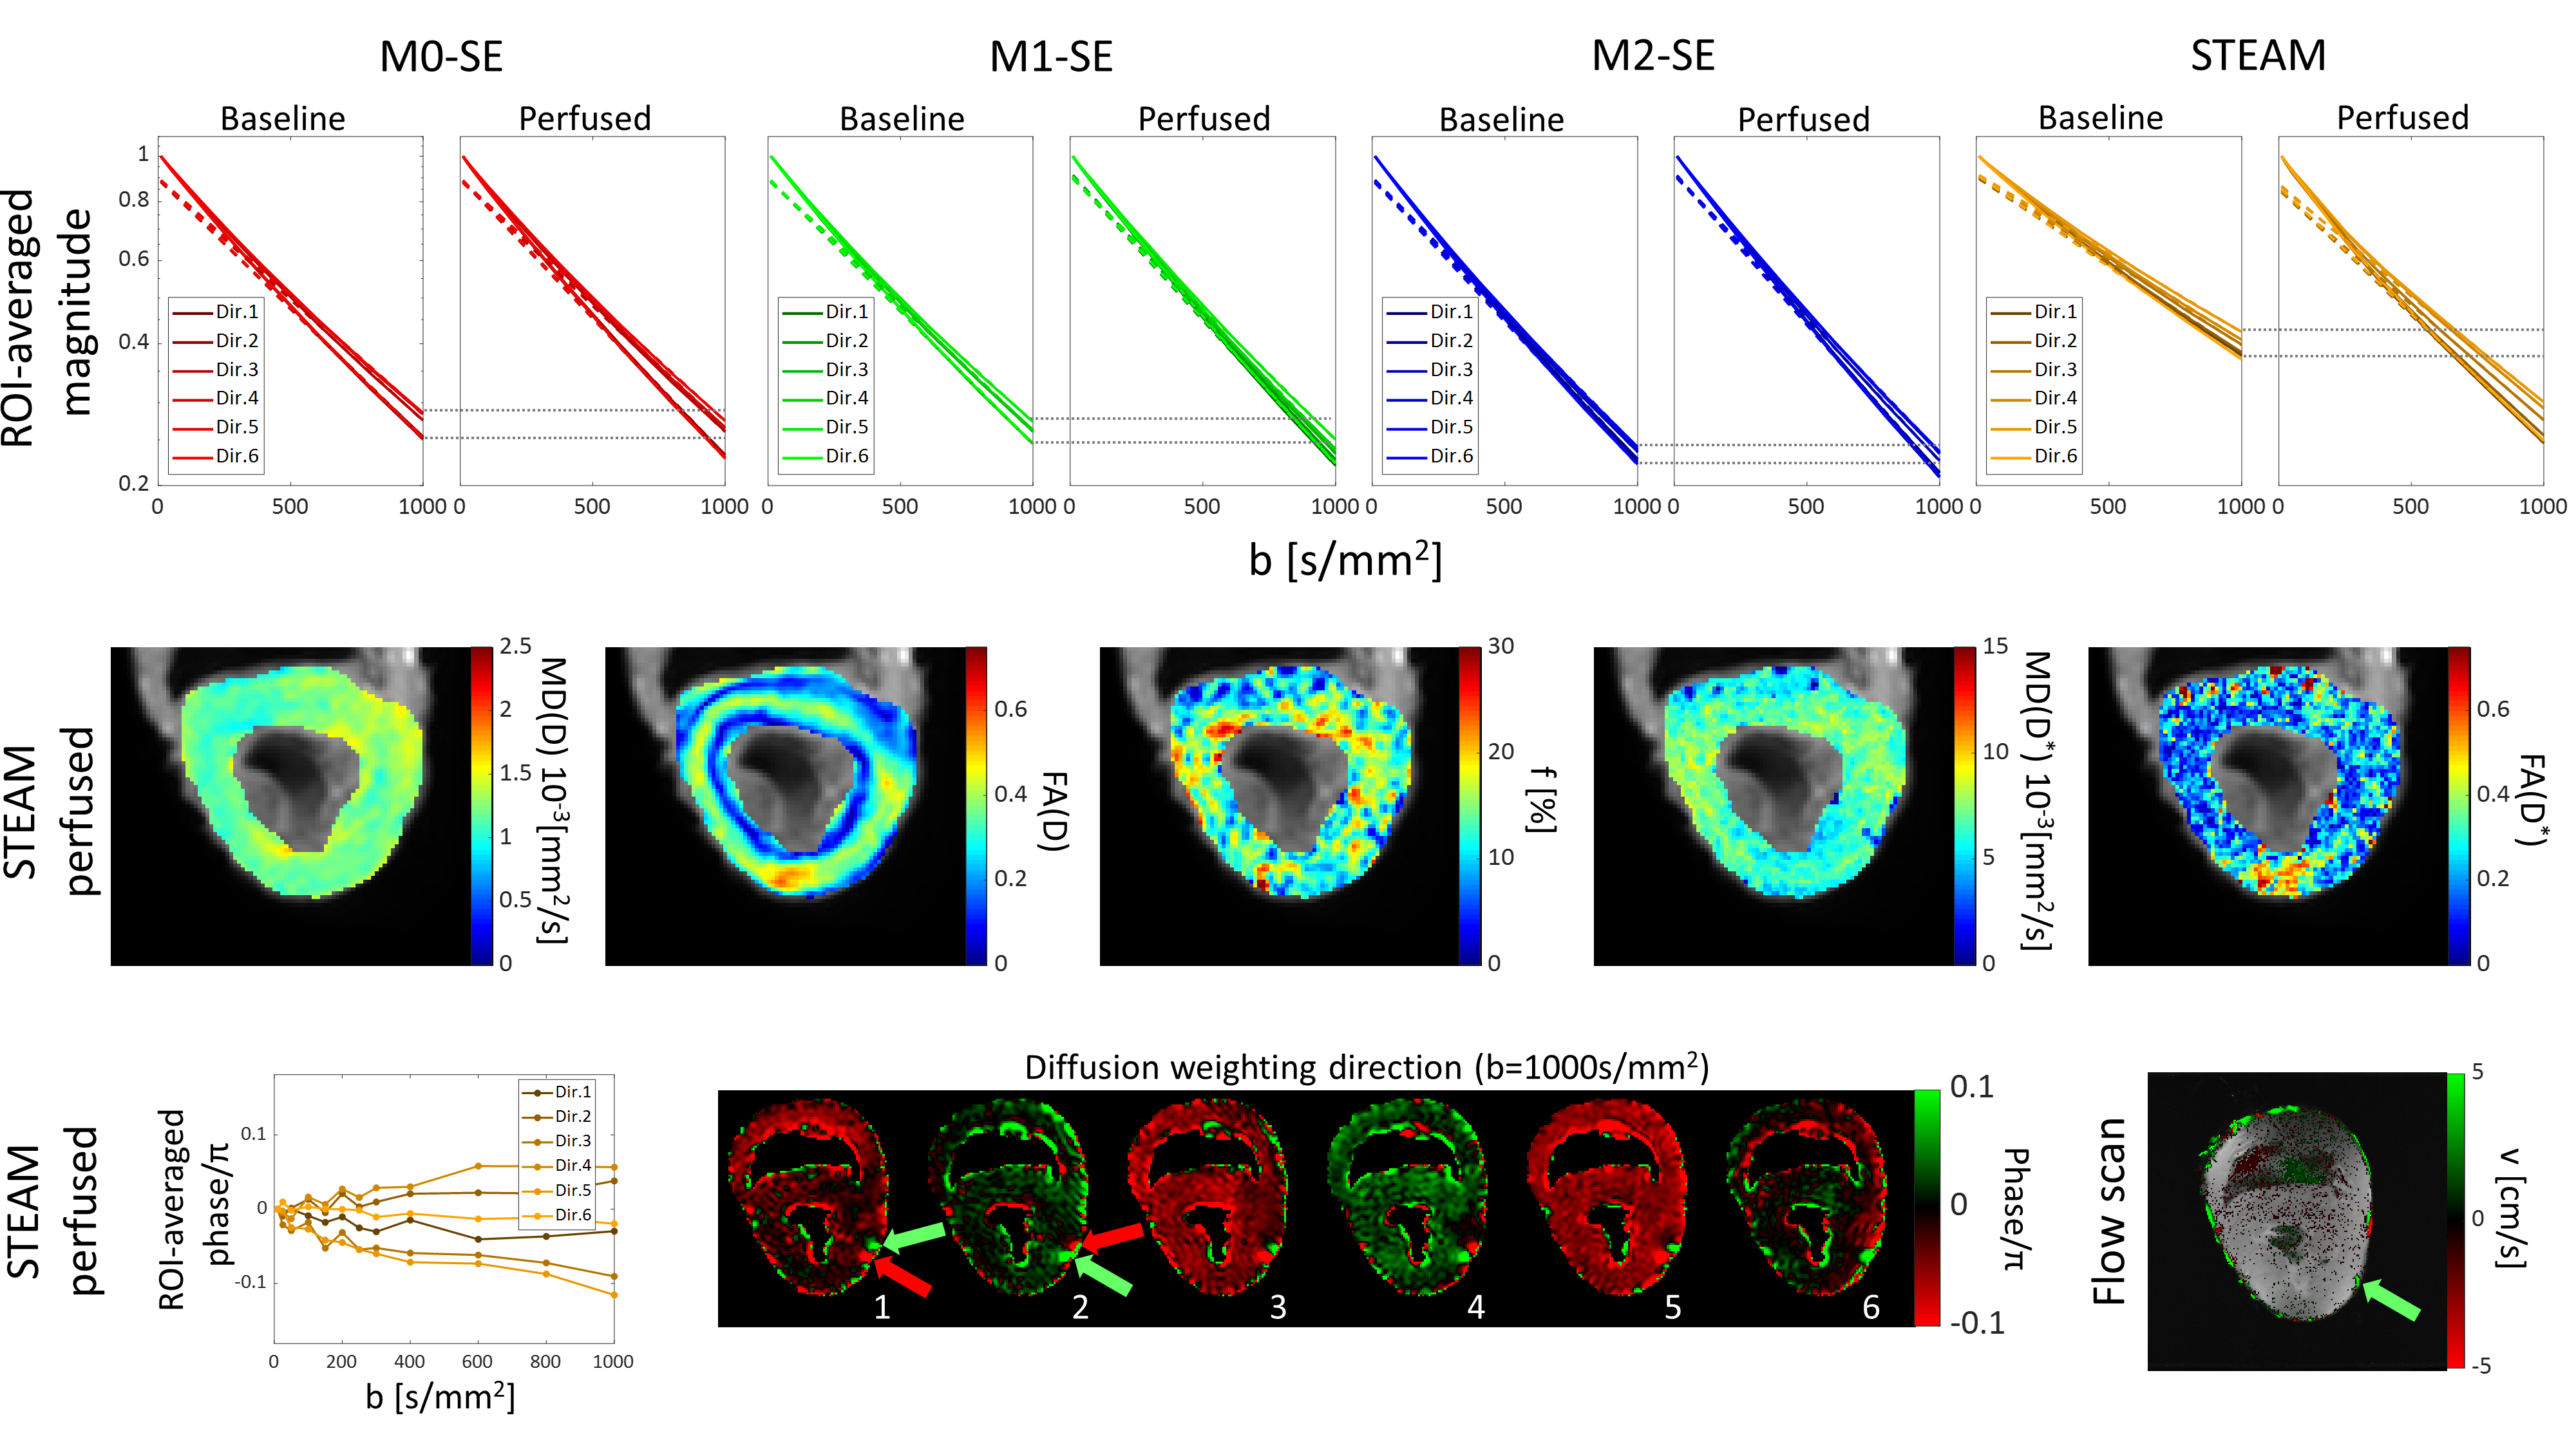
For the ex-vivo experiment a porcine heart was perfused with 0.9% NaCl solution with a peristaltic pump (44rpm, 340ml/min) imaged on a clinical 1.5T MRI scanner (Philips Achieva, Best, the Netherlands) with two single-loop surface coils (Philips SENSE Flex-M, Best, the Netherlands). The scan parameters were: 230x110mm2 FOV, 2.5x2.5x10mm3 resolution, 43 EPI lines single-shot, Local-Look reduced FOV technique22, 3x60/44s=4.091s TR, 148.40ms TE, total gradient durations as above, SPIR fat suppression and triggering to pump rotation (trigger delay 1000ms). The acquired b-values were 10, 25, 50, 100, 150, 200, 250, 300, 400, 600, 800 and 1000s/mm2. Six optimized23 gradient directions were acquired in parallel and anti-parallel direction with two averages. Baseline scans were acquired after deactivating the pump and a delay of 5 minutes. An occlusion experiment was performed by pushing the cannulating tube from the left main artery into the left anterior descending artery (LAD) thereby blocking the circumflex coronary artery (LCX).
Parameter fitting was performed using a two-tensor model (Equation 3) to account for anisotropy (diffusion tensor $$$D$$$, perfusion fraction $$$f$$$, pseudo-diffusion tensor $$$D^*$$$, gradient vector $$${\bf{g}}$$$ and b0 magnitude $$${S_0}$$$):
$$S\left( {b,{\bf{g}}} \right) = {S_0}\left[ {f \cdot \exp \left( { - b{{\bf{g}}^T}{D^*}{\bf{g}}} \right) + \left( {1 - f} \right) \cdot \exp \left( { - b{{\bf{g}}^T}D{\bf{g}}} \right)} \right] \qquad(3)$$
Results
Simulations in Figure 2 indicate that M1 and M2 sequences do not provide sufficient perfusion sensitivity. M0 and STEAM yield magnitude attenuation below 0.5 for b=1000s/mm2 for directions offset from the main capillary direction. While a net phase is observed for both sequences, no net phase is detected for M1 and M2 sequences. The GPA holds only for STEAM, while an overestimation of the magnitude attenuation results with SE protocols.
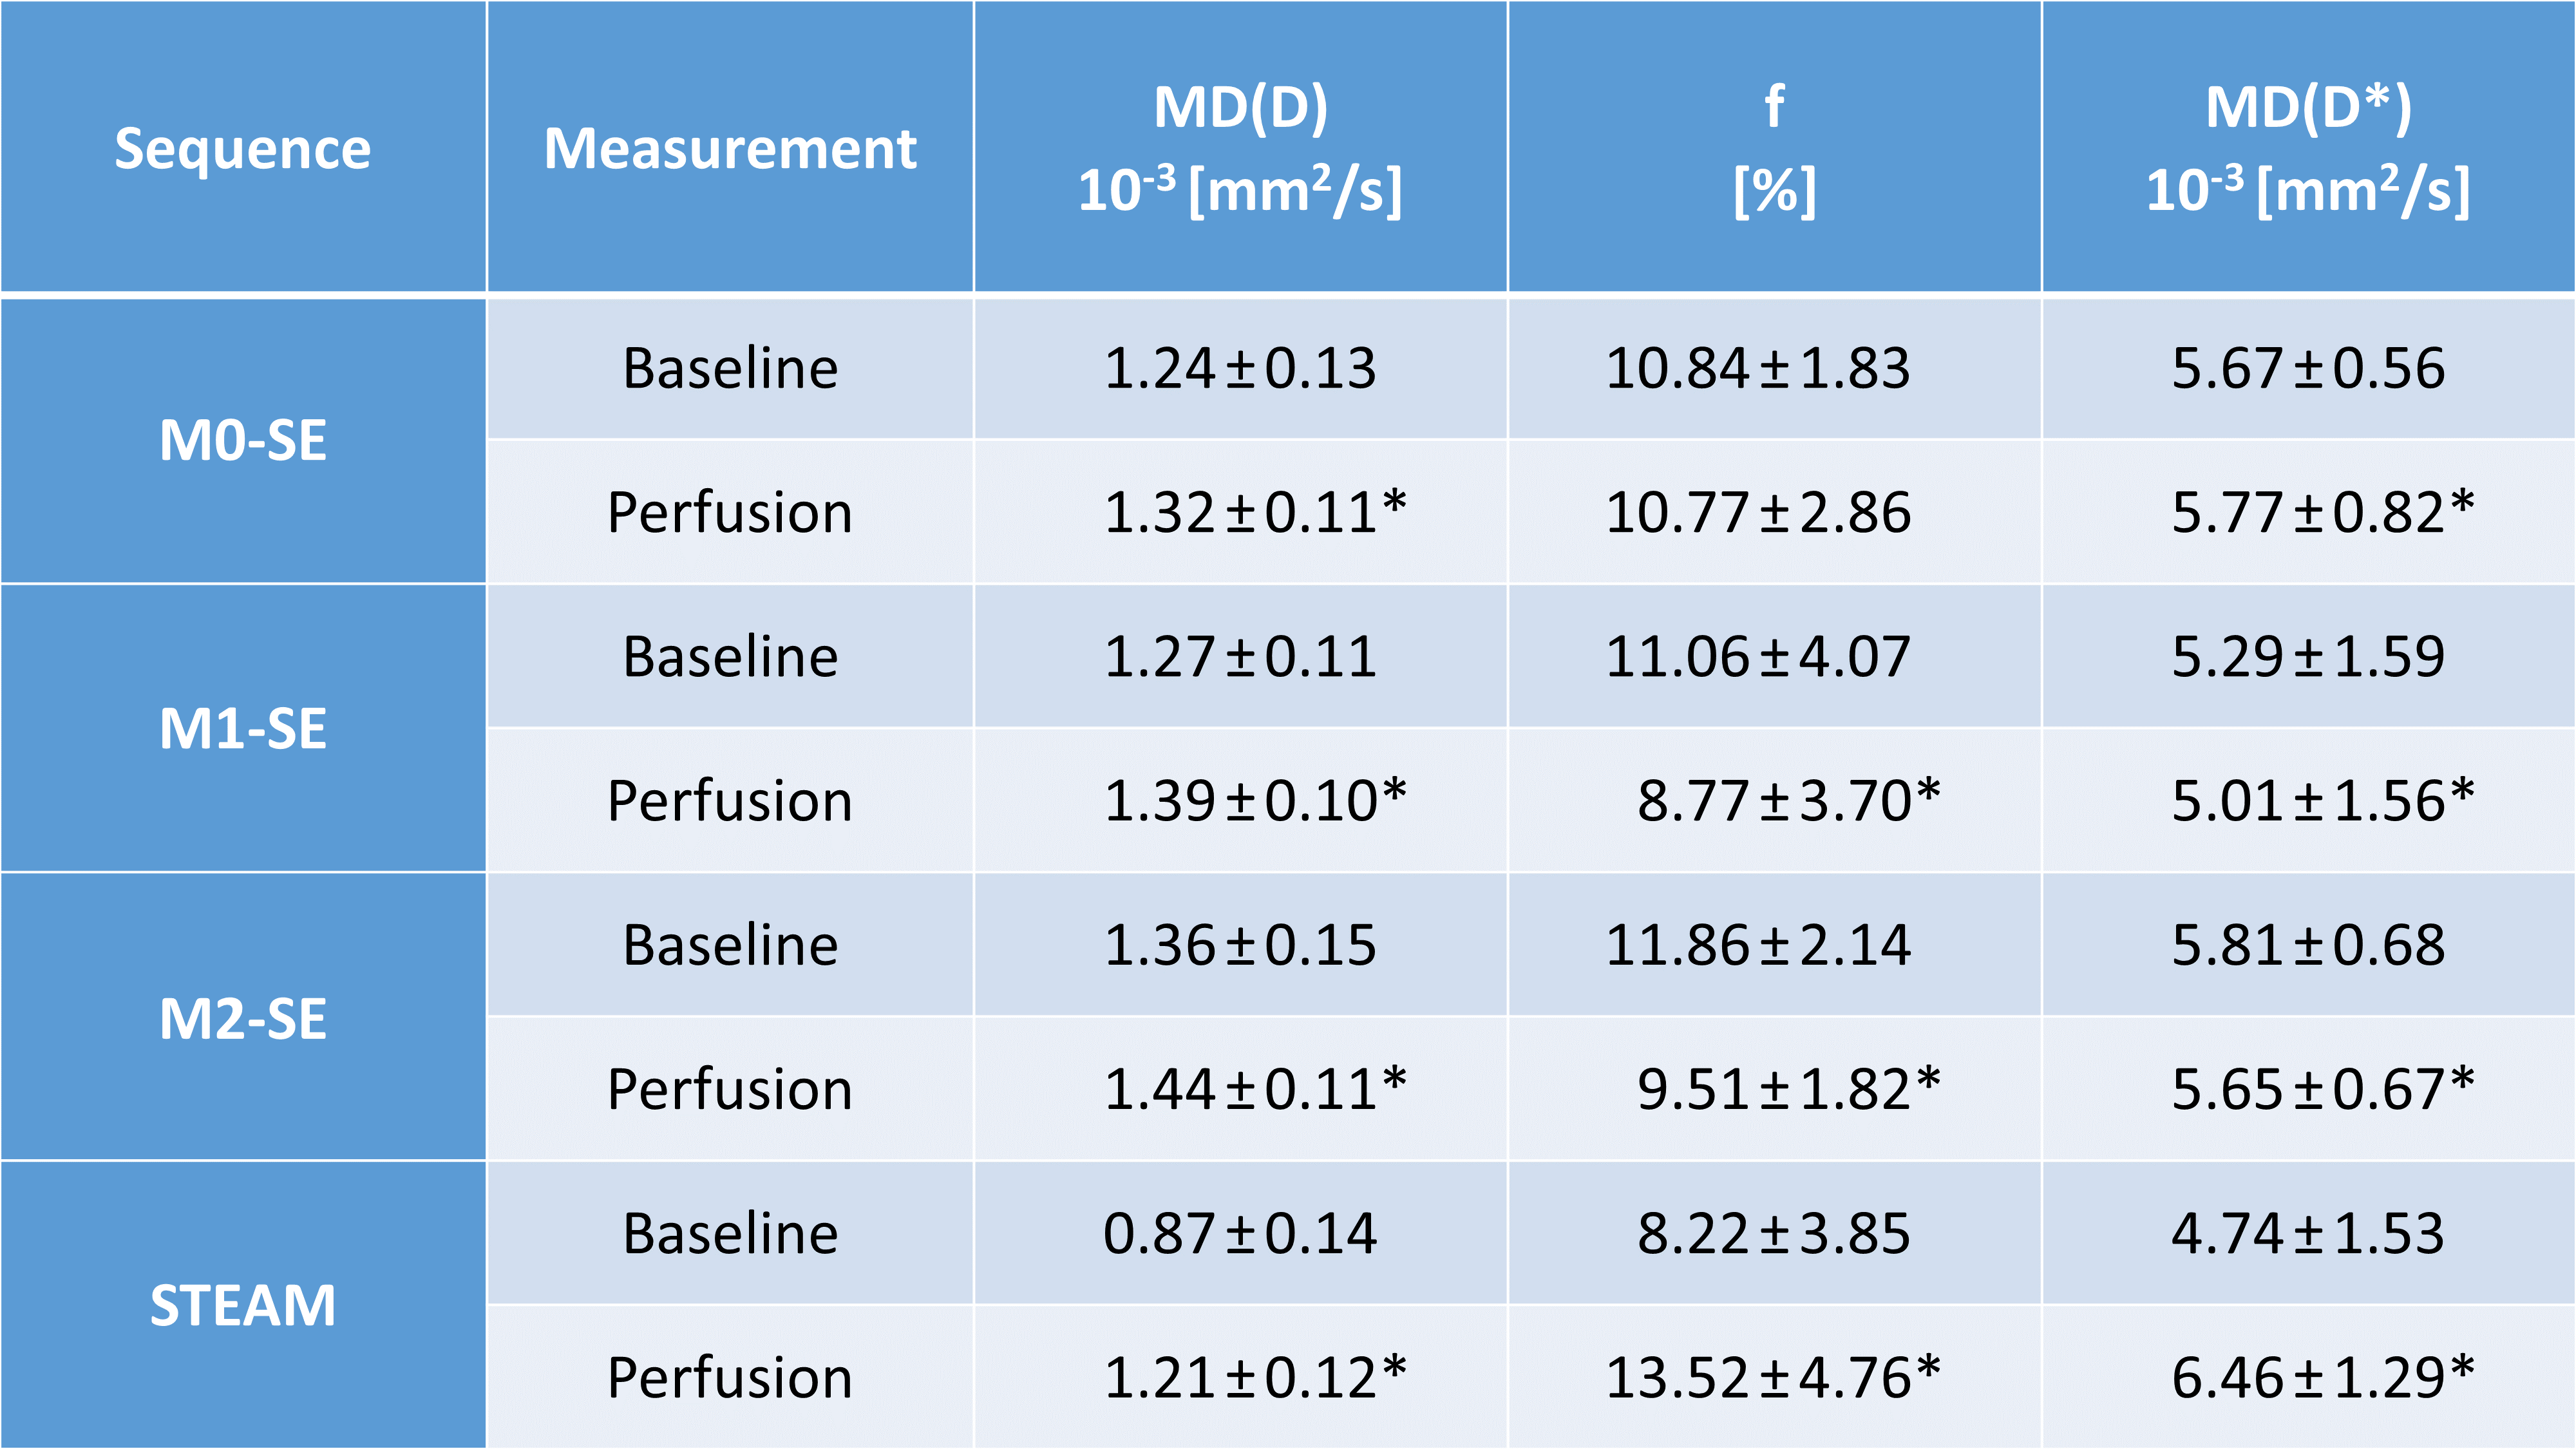
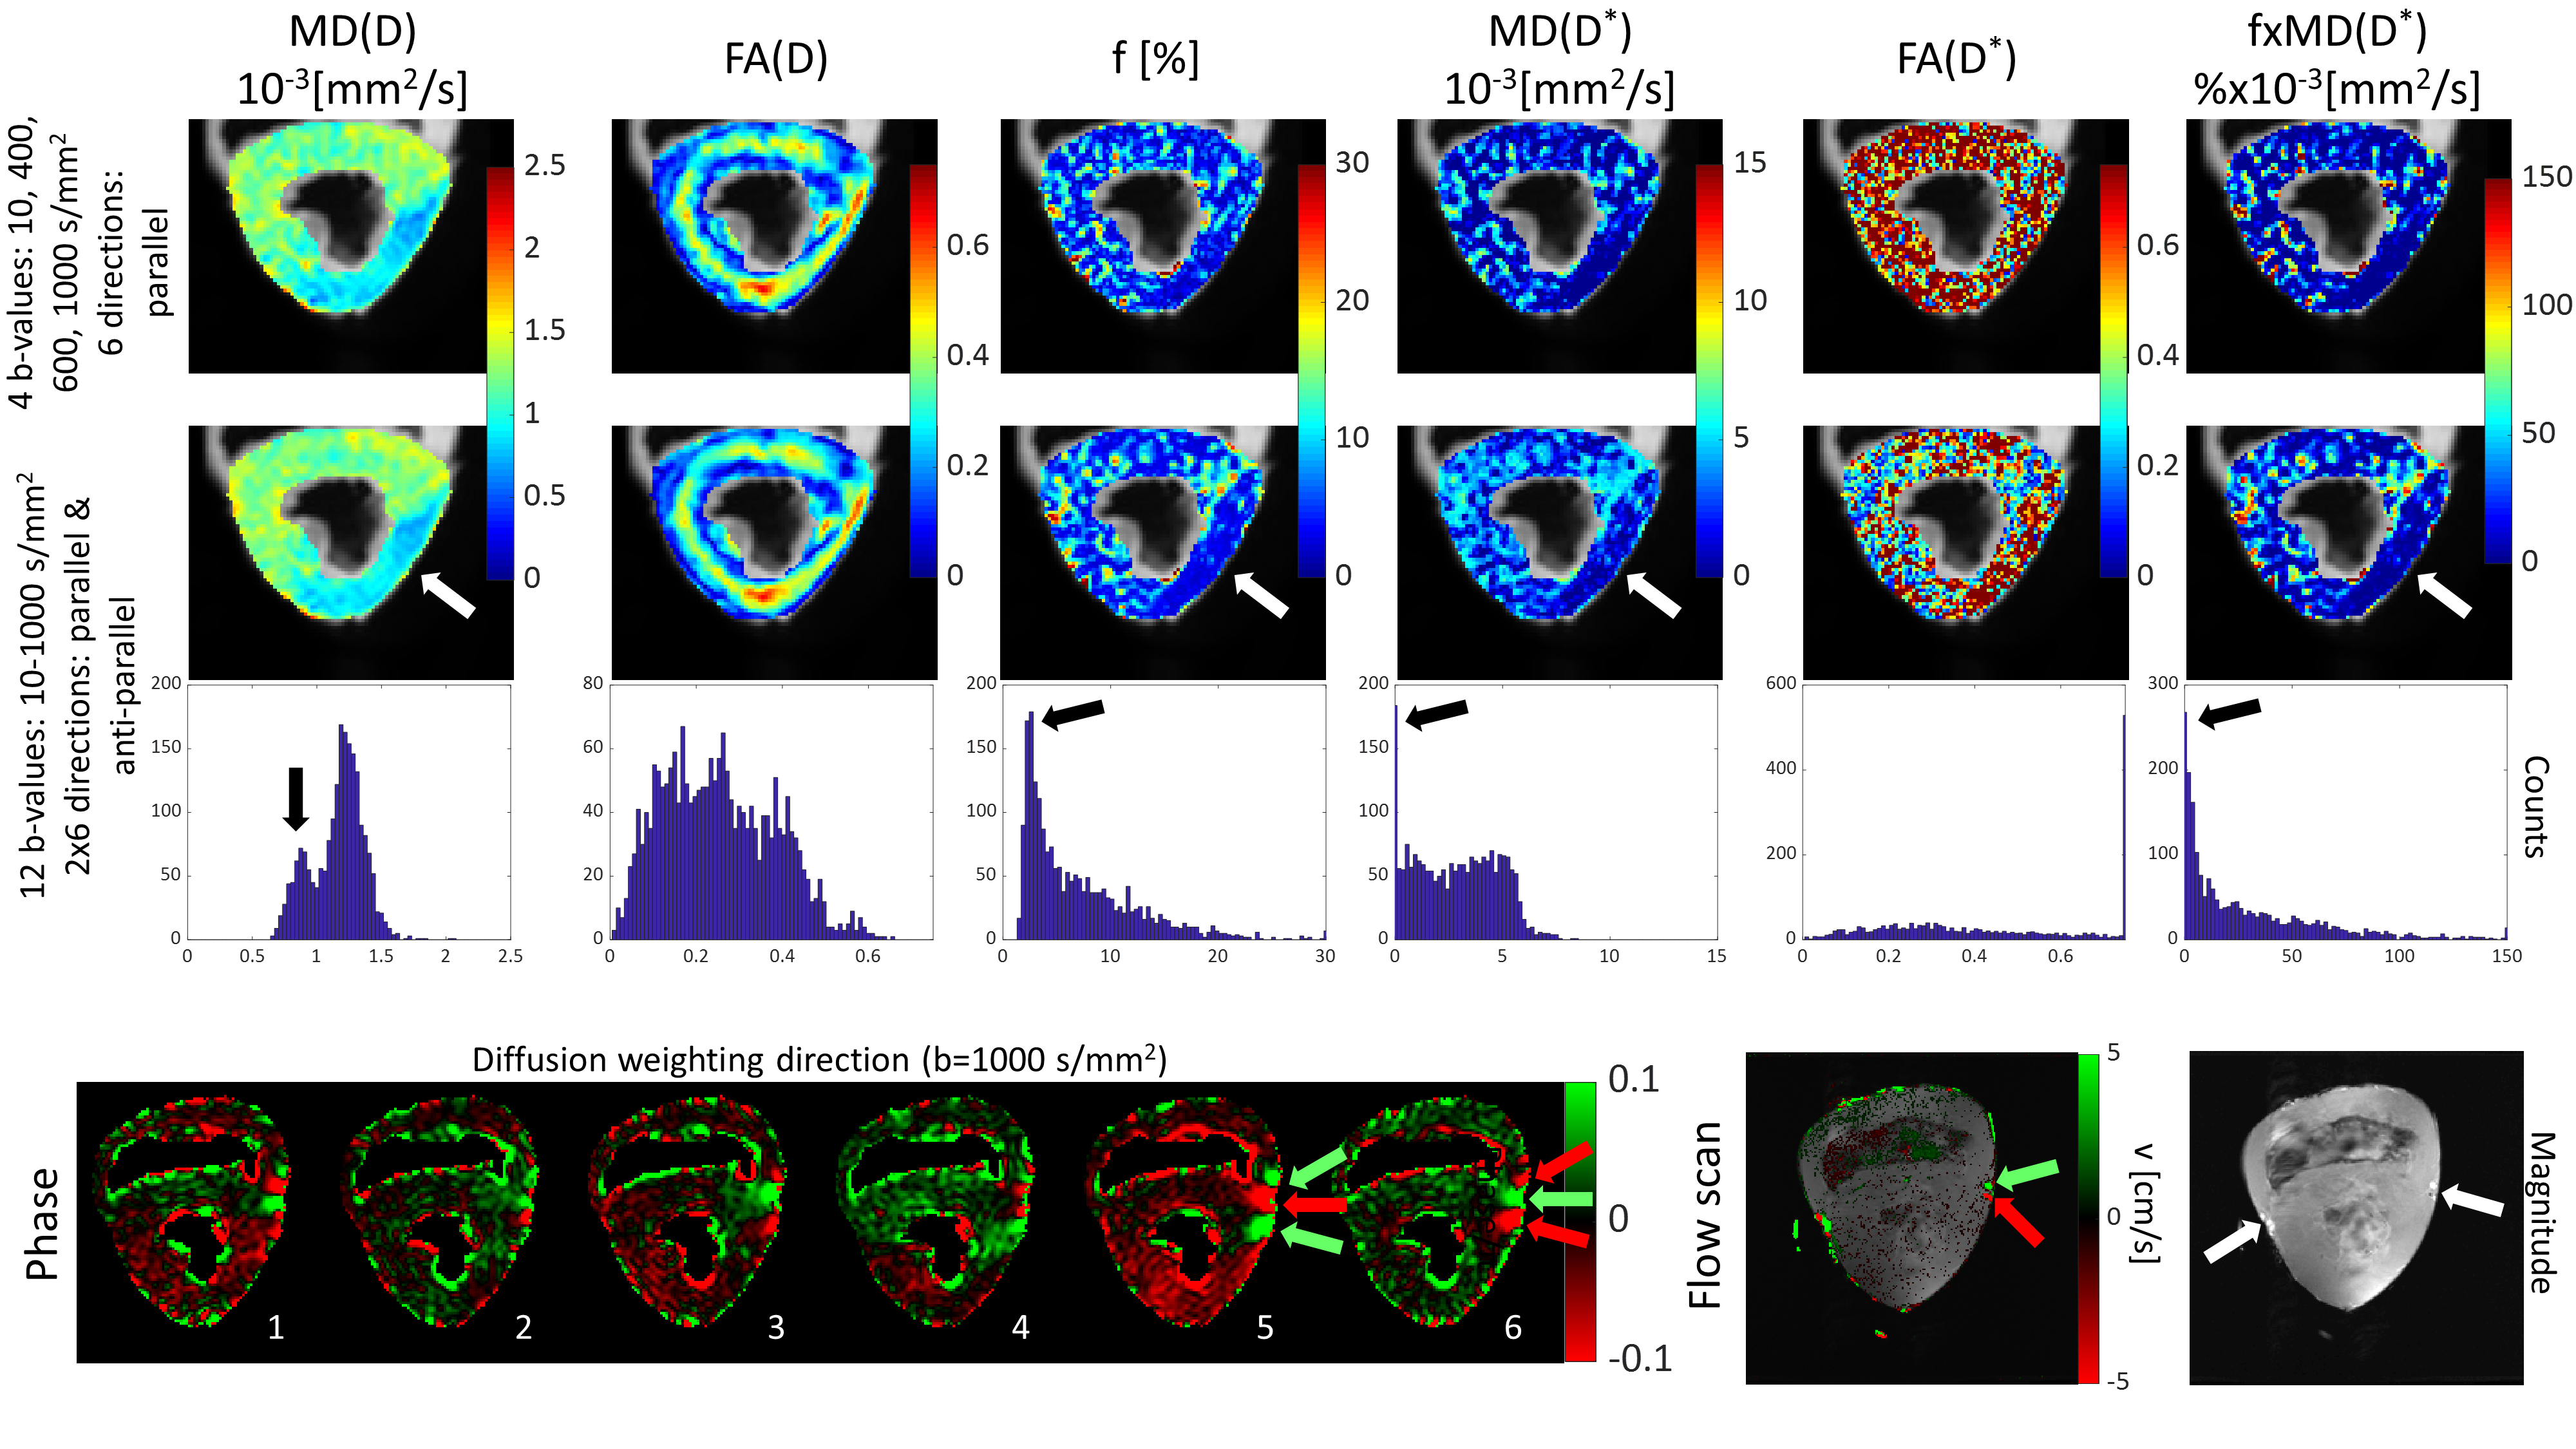
The perfused heart experiments show only minute differences between baseline and perfusion for SE magnitudes (Figure 3) and parameter estimates (Figure 4). In contrast, STEAM yields noticeable differences between baseline and perfusion including a detectable net phase (Figure 3). Using STEAM the area affected by blocking the LCX artery is successfully delineated (Figure 5).
Discussion & Conclusion
Simulations and experimental data presented here demonstrate insufficient IVIM sensitivity of first- and second-order moment compensated (M1, M2) SE sequences while STEAM provides sufficient perfusion sensitivity allowing to delineate ischemic tissue territories even with reduced number of sampled b-values and directions.
It is therefore concluded, that studies of IVIM of in-vivo myocardium shall deploy STEAM based diffusion encoding approaches along with using an extended IVIM model to account for specific myocardial characteristics.
Acknowledgements
The authors would like to thank Dr. Andreas Wetscherek for the helpful discussions about IVIM simulations and Stephen Wheeler for help in pump maintenance. We would also like to thank the team of veterinary doctors for providing the porcine hearts: Dr. Nikola Cesarovic, Dr. Marko Canic, Dr. Miriam Lipiski, Dr. Thea Fleischmann and Dr. Mareike Sauer.References
1. Le Bihan D, Breton E, Lallemand D, Grenier P, Cabanis E, Laval-Jeantet M. MR imaging of intravoxel incoherent motions: application to diffusion and perfusion in neurologic disorders. Radiology. 1986;161(2):401-407. doi:10.1148/radiology.161.2.3763909.
2. Moulin KK, Croisille P, Feiweier T, et al. In vivo free-breathing DTI and IVIM of the whole human heart using a real-time slice-followed SE-EPI navigator-based sequence: A reproducibility study in healthy volunteers. Magn Reson Med. 2016;76(1):70-82. doi:10.1002/mrm.25852.
3. Spinner GR, von Deuster C, Tezcan KC, Stoeck CT, Kozerke S. Bayesian intravoxel incoherent motion parameter mapping in the human heart. J Cardiovasc Magn Reson. 2017;19(1):85. doi:10.1186/s12968-017-0391-1.
4. Xiang S, Zhang X, Yang S-J, et al. STROBE-A preliminary investigation of IVIM-DWI in cardiac imaging. Medicine (Baltimore). 2018;97(36):e11902. doi:10.1097/MD.0000000000011902.
5. Mou A, Zhang C, Li M, et al. Evaluation of myocardial microcirculation using intravoxel incoherent motion imaging. J Magn Reson Imaging. 2017;46(6):1818-1828. doi:10.1002/jmri.25706.
6. Spinner G, Deuster C Von, Oebel S, Stoeck CT, Manka R. Intravoxel Incoherent Motion Model in the Heart of Patients under Adenosine Induced Stress In order to validate previous IVIM animal studies , patients where measured both during rest and under adenosine induced stress using a slice following second-order. 2016:2016-2018.
7. Deuster C Von, Stoeck CT, Wissmann L, et al. Verification of the intra-voxel incoherent motion (IVIM) model in the porcine heart. In: Proc. Intl. Soc. Mag. Reson. Med. Vol 23. ; 2015:2612.
8. Callot V, Bennett E, Decking UKM, Balaban RS, Wen H. In vivo study of microcirculation in canine myocardium using the IVIM method. Magn Reson Med. 2003;50(3):531-540. doi:10.1002/mrm.10568.
9. Stoeck CT, von Deuster C, Genet M, Atkinson D, Kozerke S. Second-order motion-compensated spin echo diffusion tensor imaging of the human heart. Magn Reson Med. 2016;75(4):1669-1676. doi:10.1002/mrm.25784.
10. Scott AD, Nielles-Vallespin S, Ferreira PF, et al. An in-vivo comparison of stimulated-echo and motion compensated spin-echo sequences for 3 T diffusion tensor cardiovascular magnetic resonance at multiple cardiac phases. J Cardiovasc Magn Reson. 2018;20(1):1-15. doi:10.1186/s12968-017-0425-8.
11. Nguyen C, Fan Z, Sharif B, et al. In vivo three-dimensional high resolution cardiac diffusion-weighted MRI: a motion compensated diffusion-prepared balanced steady-state free precession approach. Magn Reson Med. 2014;72(5):1257-1267. doi:10.1002/mrm.25038.
12. Gamper U, Boesiger P, Kozerke S. Diffusion imaging of the in vivo heart using spin echoes--considerations on bulk motion sensitivity. Magn Reson Med. 2007;57(2):331-337. doi:10.1002/mrm.21127.
13. Stejskal EO, Tanner JE. Spin Diffusion Measurements: Spin Echoes in the Presence of a Time‐Dependent Field Gradient. J Chem Phys. 1965;42(1):288-292. doi:10.1063/1.1695690.
14. Wetscherek A, Stieltjes B, Laun FB. Flow-compensated intravoxel incoherent motion diffusion imaging. Magn Reson Med. 2015;74(2):410-419. doi:10.1002/mrm.25410.
15. Le Bihan D, Turner R. The capillary network: a link between IVIM and classical perfusion. Magn Reson Med. 1992;27(1):171-178.
16. Kaneko N, Matsuda R, Toda M, Shimamoto K. Three-dimensional reconstruction of the human capillary network and the intramyocardial micronecrosis. Am J Physiol Heart Circ Physiol. 2011;300(3):H754-H761. doi:10.1152/ajpheart.00486.2010.
17. Kassab GS, Fung YC. Topology and dimensions of pig coronary capillary network. Am J Physiol. 1994;267(1 Pt 2):H319-25. doi:10.1152/ajpheart.1994.267.1.H319.
18. Karampinos DC, King KF, Sutton BP, Georgiadis JG. Intravoxel partially coherent motion technique: Characterization of the anisotropy of skeletal muscle microvasculature. J Magn Reson Imaging. 2010;31(4):942-953. doi:10.1002/jmri.22100.
19. Fibich G, Lanir Y, Liron N. Mathematical model of blood flow in a coronary capillary. Am J Physiol Hear Circ Physiol. 1993;265(5):H1829-1840. doi:10.1021/ic0616434.
20. Poole DC, Mathieu-Costello O. Analysis of capillary geometry in rat subepicardium and subendocardium. Am J Physiol - Hear Circ Physiol. 1990;259(1):H204-H210.
21. Mathieu O, Cruz‐Orive L ‐M, Hoppeler H, Weibel ER. Estimating length density and quantifying anisotropy in skeletal muscle capillaries. J Microsc. 1983;131(2):131-146. doi:10.1111/j.1365-2818.1983.tb04240.x.
22. Buecker A, Adam G, Neuerburg JM, Vaals JJ Van, Guenther RW. MR-guided biopsy using a T2- weighted single-shot zoom imaging sequence (local look technique ). J Magn Reson Imaging. 1998;8:955-959.
23. Jones DK, Horsfield M a, Simmons a. Optimal strategies for measuring diffusion in anisotropic systems by magnetic resonance imaging. Magn Reson Med. 1999;42(3):515-525.
Figures