1228
Magnetic resonance temperature imaging in activated brown adipose tissue of rat1Shenzhen Institutes of Advanced Technology, Chinese Academy of Sciences, Shenzhen, GuangDong, China, 2University of Chinese Academy of Sciences, Beijing, China, 3Shenzhen Hospital of Guangzhou University of Chinese Medicine, Shenzhen, GuangDong, China
Synopsis
Brown adipose tissue (BAT) is a special adipose tissue which burns fat and dissipates energy in heat. As a result, it is considered to be the next potential therapeutic target for treating obesity and other metabolic diseases. The ability of heat dissipation of BAT is thought to be highly related to the BAT activity. In this study, we intended to use MR thermometry to map the temperature change distribution in BAT after activated by Norepinephrine. The preliminary results show the PRFS based thermometry can observe the temperature change in BAT after activation, implying that MR thermometry might be a useful tool to characterize the BAT activity.
Introduction
Various studies have demonstrated that the brown adipose tissue (BAT) in mammal is an important energy modulation organ which can produce heat by burning fat after activated1. MR is able to identify BAT noninvasively by various contrasts based on specific physiological characteristics of BAT, such as fat fraction (FF), T2, T2* and so on. Since heat is also the production of activated BAT, and it is highly related to the BAT activity, some studies have attempted to measure the temperature change in the activated BAT, by using hydrogen or hyperpolarized xenon spectroscopy2,3, to characterize the activity of BAT. Although obvious temperature changes have been observed in activated BAT, these studies only performed a spectral analysis in the total volume of BAT with no the temperature distribution information. Nevertheless, the experiments were all conducted at the ultra-high field MR with B0=7T or 9.4T. In this study, a feasibility study was carried out to map the temperature distribution in the interscapular BAT (iBAT) of rat using a fat referenced PRFS temperature mapping method4 on a clinical 3.0T MR.Methods:
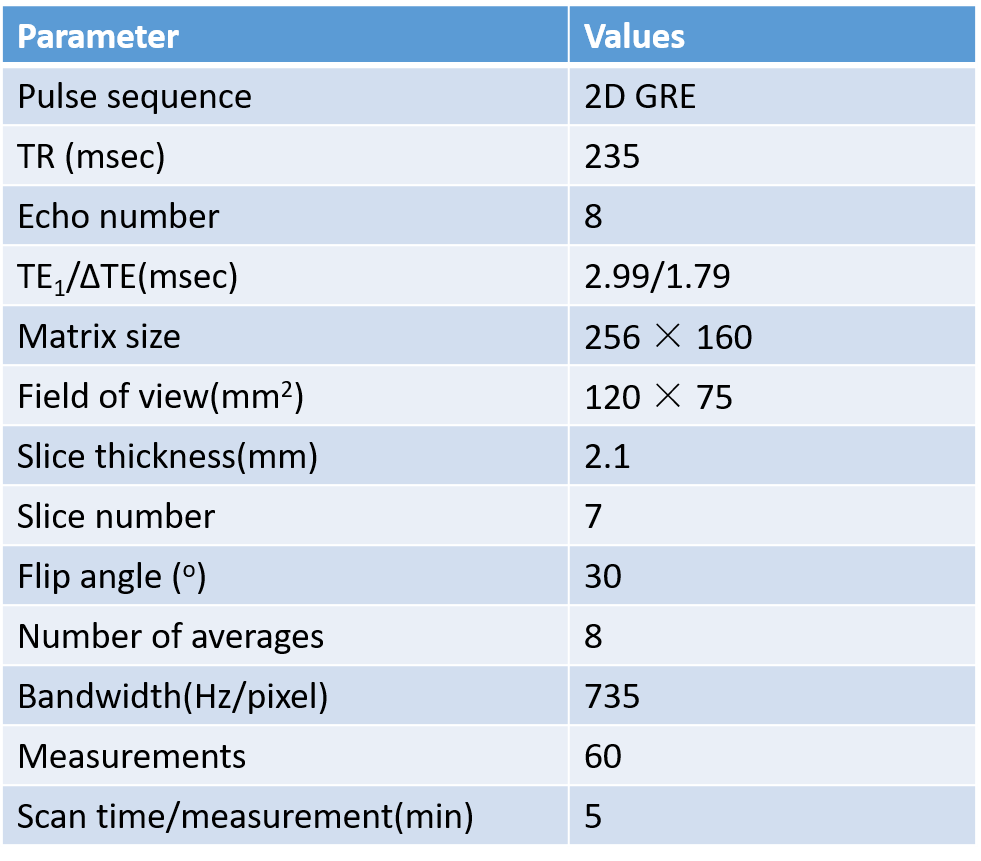
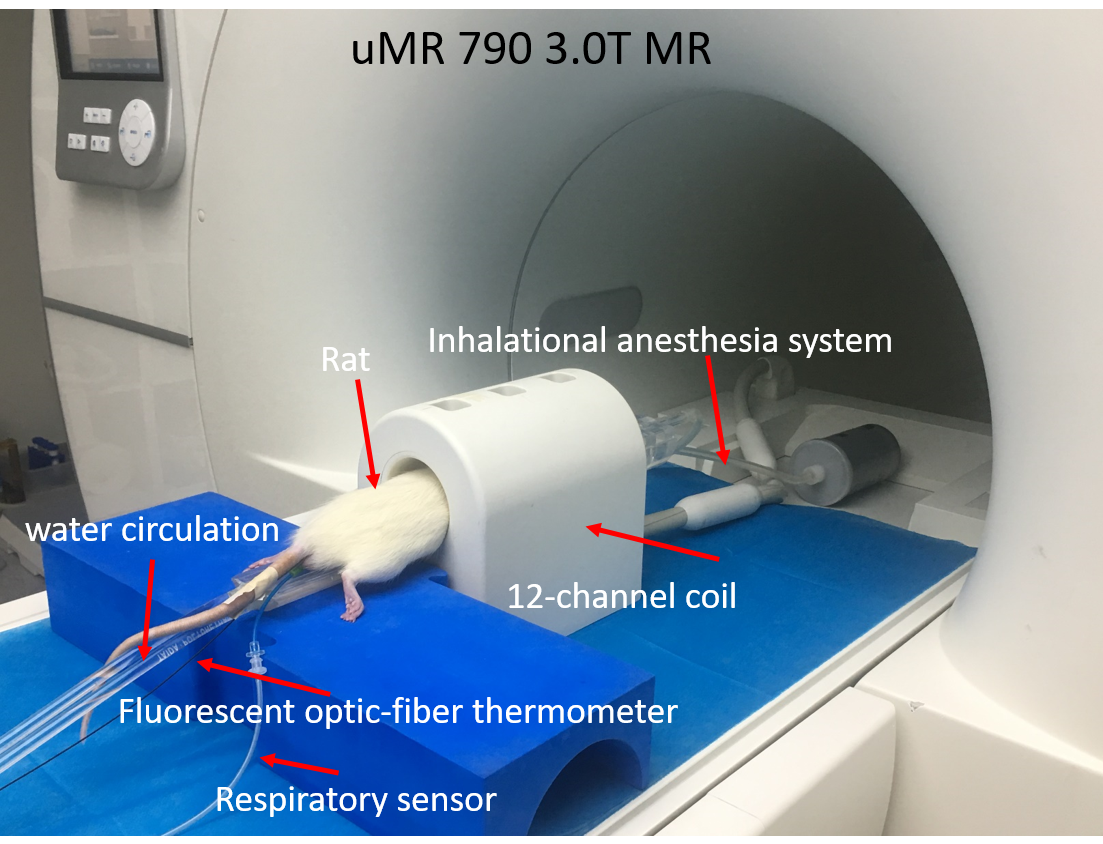
Four SD rats with age of 11 weeks were used in this study with IRB approval. During the experiments, the rats were anesthetized by isoflurane and the rectal temperature was monitored by using an MR-compatible fluorescent optic-fiber thermometer. Before the experiment, the rat was placed in the MR room over 1 hour for acclimation. The MRI scans were completed using a 3.0T scanner with high performance gradient system (uMR 790, Shanghai United Imaging healthcare, Shanghai, China). A 12-channel rat/mouse coil was used to acquire images. MRI parameters are summarized in Table1. The imaging slices were located in the interscapular area. A total of 60 successive measurements (total time 300 minutes) were acquired. BAT was activated by injecting NE in a dose of 1 mg/kg through intraperitoneal injection immediately after 12th measurement (60 minutes).
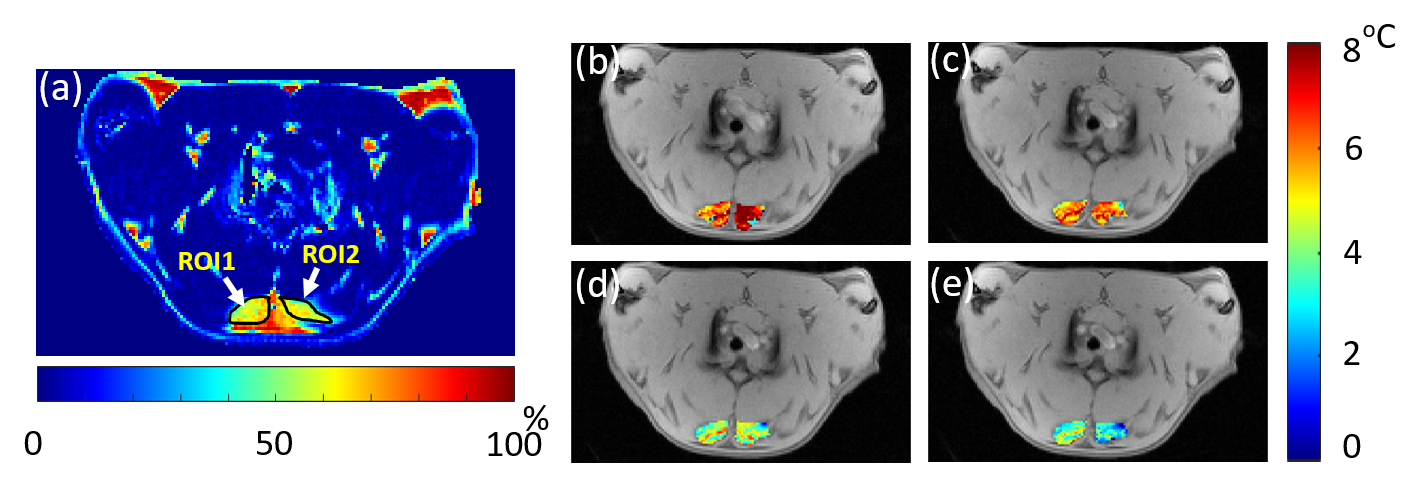
A fat-referenced dual-step iterative temperature estimation (DITE) proton resonance frequency shift (PRFS) method4 was adopted to calculate the temperature map of each measurement in the iBAT area identified in the FF image ranging from 20% to 80%. The accuracy and precision performance of this method had been demonstrated using ex vivo BAT experiment4. For each measurement, fat fraction (FF) map could be also generated by DITE method from the separated water and fat images, which was used to monitor the change of fat content in BAT.
Results
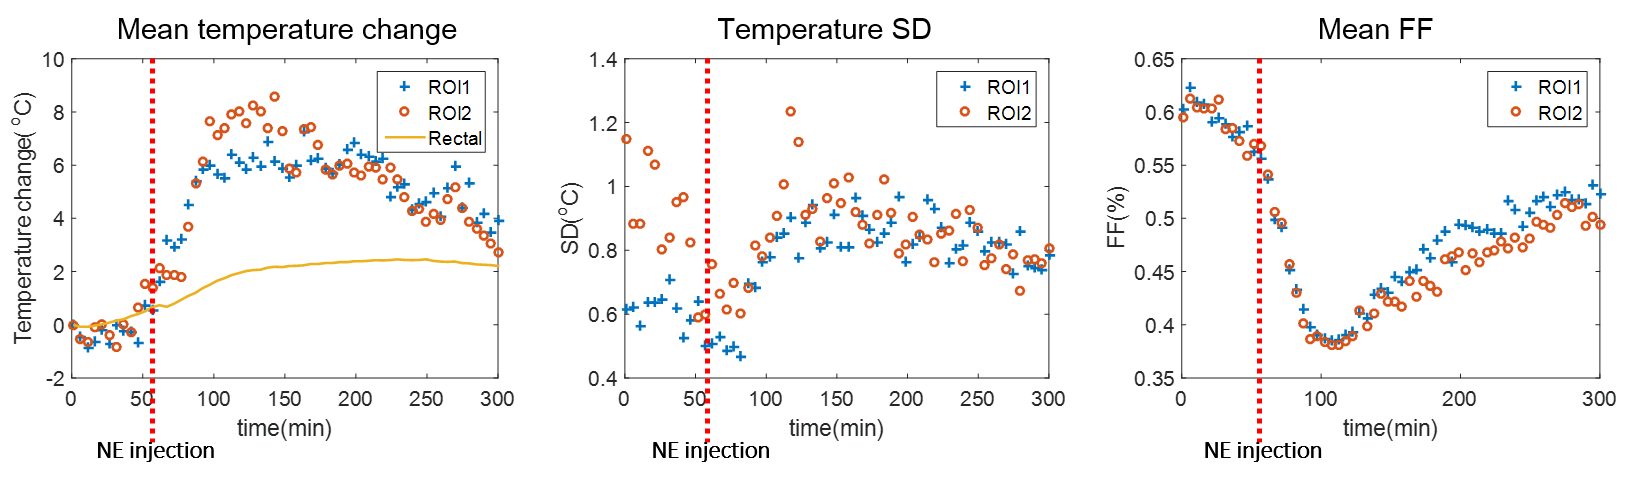
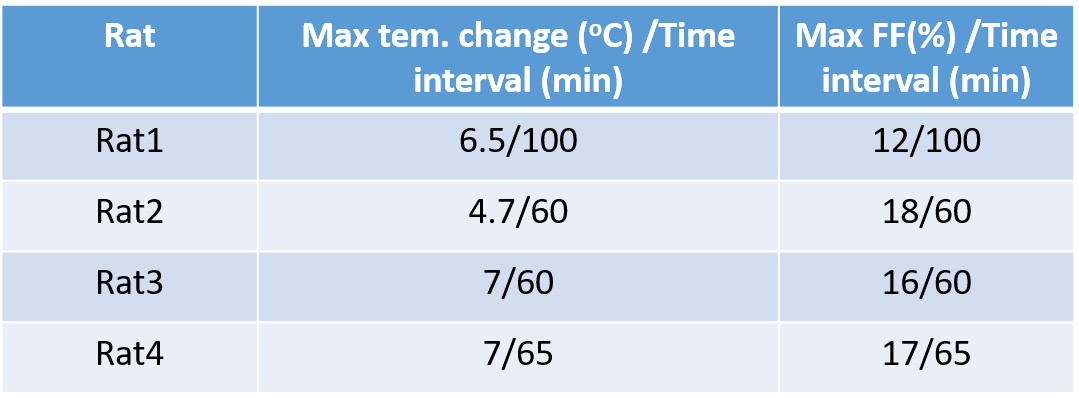
Figure 1 shows the experimental setup of this study. The temperature/FF change patterns of all four rats are similar. The FF map and temperature maps of one rat (Rat 3) are shown in Figure 2. Figure 3 shows the mean temperature change curve with SD and mean FF curve in the ROIs over all of the measurements. The mean temperature increased about 7oC with mean SD=0.8oC. A similar pattern of the temperature change in iBAT and rectum can be observed. The mean FFs decreased firstly and then started to increase about 60 minutes after injecting NE. A small increase in temperature before NE injecting was also observed. The reason might be that BAT was activated slightly by the exposure in the low-temperature environment. Table 2 shows the maximum temperature/FF change and the interval between the time point of these maximum changes and the time point of injecting NE for all four rats.Discussion and conclusions
Temperature map along with the FF change in iBAT after NE activation was successfully observed by DITE algorithm using a clinical 3.0T system. In contrast to previous studies using spectroscopy which only gave an overall temperature information at each time point, the temperature distribution maps obtained in this study provide the spatial information of the capacity of heat production in activated BAT. Beside, our work was implemented in a clinical 3.0T system rather than ultra-high field system, which might facilitate the translation of relevant studies to human.
In our study, temperature and FF change can be observed simultaneously. It is found that during the activation of BAT, the local temperature increases while the FF decreases, indicating that the fatty acid released from the triglycerides in brown adipocyte were initially the main source of mitochondria. As the local fatty acid is consumed continuously, the main substrates for the heat production were supplemented through the blood circulation, and it was observed that the FF recovered gradually after 60~70 minutes after NE injection.
For our future work, the relationship between the BAT activity and temperature change pattern will be explored, which can be used to assess the ability of activated BAT to resist obesity and other metabolic diseases and evaluate the therapeutic effect of the related drugs in vivo.
Acknowledgements
This research was supported by the Natural ScienceFoundation of China (Nos. 81327801, 81527901, 11504401 and 81801724) and the KeyLaboratory for Magnetic Resonance and Multimodality Imaging of GuangdongProvince (No. 2014B030301013).References
1. Cannon B, Nedergaard J A N. Brown adipose tissue: function and physiological significance[J]. Physiological reviews, 2004, 84(1): 277-359.
2. Branca R T, He T, Zhang L, et al. Detection of brown adipose tissue and thermogenic activity in mice by hyperpolarized xenon MRI[J]. Proceedings of the National Academy of Sciences, 2014, 111(50): 18001-18006.
3. Diwoky C, Schreiber R, and Zechner R. Measuring temperature in brown adipose tissue using the proton chemical shift. Proc. Intl. Soc. Mag. Reson. Med. 25(2017). P0114.
4. Cheng C, Zou C, Wan Q, et al. Dual-step iterative temperature estimation method for accurate and precise fat‐referenced PRFS temperature imaging[J]. Magnetic resonance in medicine, 2018.
Figures