1227
Multi-Parametric MRI of Liver Fibrosis and Treatment Response in a Rat Model of Nonalcoholic Steatohepatitis (NASH)1Athinoula A. Martinos Center for Biomedical Imaging, Institute for Innovation in Imaging (i3), Department of Radiology, Massachusetts General Hospital and Harvard Medical School, Charlestown, MA, United States, 2Division of Surgical Oncology, Massachusetts General Hospital and Harvard Medical School, Boston, MA, United States
Synopsis
Noninvasive MR quantification of
Introduction
Nonalcoholic steatohepatitis (NASH), a type of nonalcoholic fatty liver disease (NAFLD), afflicts 5% of the general population [1]. NASH promotes liver fibrosis, which can lead to cirrhosis, liver failure, and/or hepatocellular carcinoma [2]. Many newly developed anti-fibrotic therapies have entered clinical trials, but there remains a major unmet clinical challenge to detect disease at an early stage, and to noninvasively monitor disease progression or treatment response. Here, we used two complementary techniques, 1) molecular MRI with EP-3533, a type-I collagen probe [3] to directly measure fibrosis, and 2) MR elastography (MRE) of tissue stiffness [4, 5] to noninvasively characterize disease progression and to assess treatment response in a choline-deficient high-fat diet rat model of NASH. The treatment effect of the dual peroxisome proliferator-activated receptor (PPAR-α/δ) agonist elafibranor was studied as was the effect of diet change.Methods
Animal model: Male Wistar rats were fed a choline-deficient, L-amino acid-defined, high-fat diet consisting of 60kcal% fat and 0.1% methionine by weight (CDAHFD) for 6 or 9 weeks (N = 8 per group) to induce NASH. Age- and weight-matched animals receiving normal chow were used as controls (N = 16). In the treated groups, animals that received 6 weeks of CDAHFD subsequently underwent either (1) 3 weeks of daily oral gavage of elafibranor (30 mg/kg) while continuing on CDAHFD (N=8); or (2) switch to normal diet for 3 weeks (N=8). in-vivo MRI: Animals were anesthetized with isoflurane (1%-2%) and imaged with a 1.5T Siemens MRI scanner. Respiratory-gated, three-dimensional inversion recovery images (TI= 50, 100, 200, 250, 300, 400, 1000 and 1500 ms) were acquired prior to and 45 minutes following intravenous administration of EP-3533 (10 µmol/kg). For MRE, low-frequency mechanical waves (200 Hz) were coupled to the liver with a disposable silver acupuncture needle and wave images were acquired using a gradient-echo sequence with motion-encoding gradients that were synchronized to the mechanical excitation. Image analysis: Longitudinal relaxation time (T1) was quantified from a three-parameter nonlinear least squares fit of the dependence of liver signal intensity (S) on inversion time (TI) with a custom written MATLAB program. ROI analysis of liver tissue was performed on the longitudinal relaxation rate (R1=1/T1) maps before and after EP-3533 injection to obtain ∆R1 values. For MRE, tissue displacement maps were generated from the phase images and local shear wave speed was calculated and converted into a stiffness estimate. ex-vivo tissue analyses: After MRI, the livers were collected, fixed, and stained with Sirius Red. The percentage of slides stained red, collagen proportionate area (CPA) was measured using imageJ. Another portion of liver was assayed for hydroxyproline (Hyp) content. Differences among groups were tested with one-way ANOVA followed by Tukey’s post hoc test. Correlation between in vivo MR measurements and ex vivo tissue quantification was assessed by Spearman's rank correlation coefficient.
Results
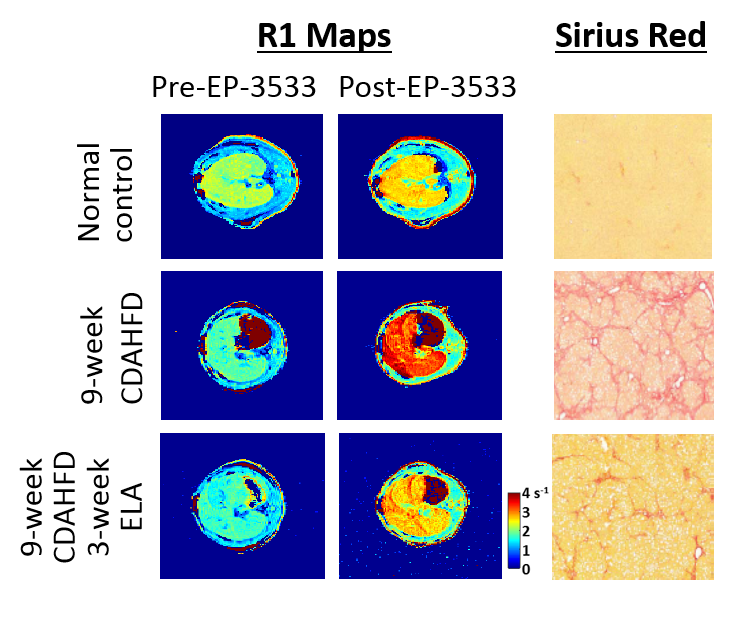
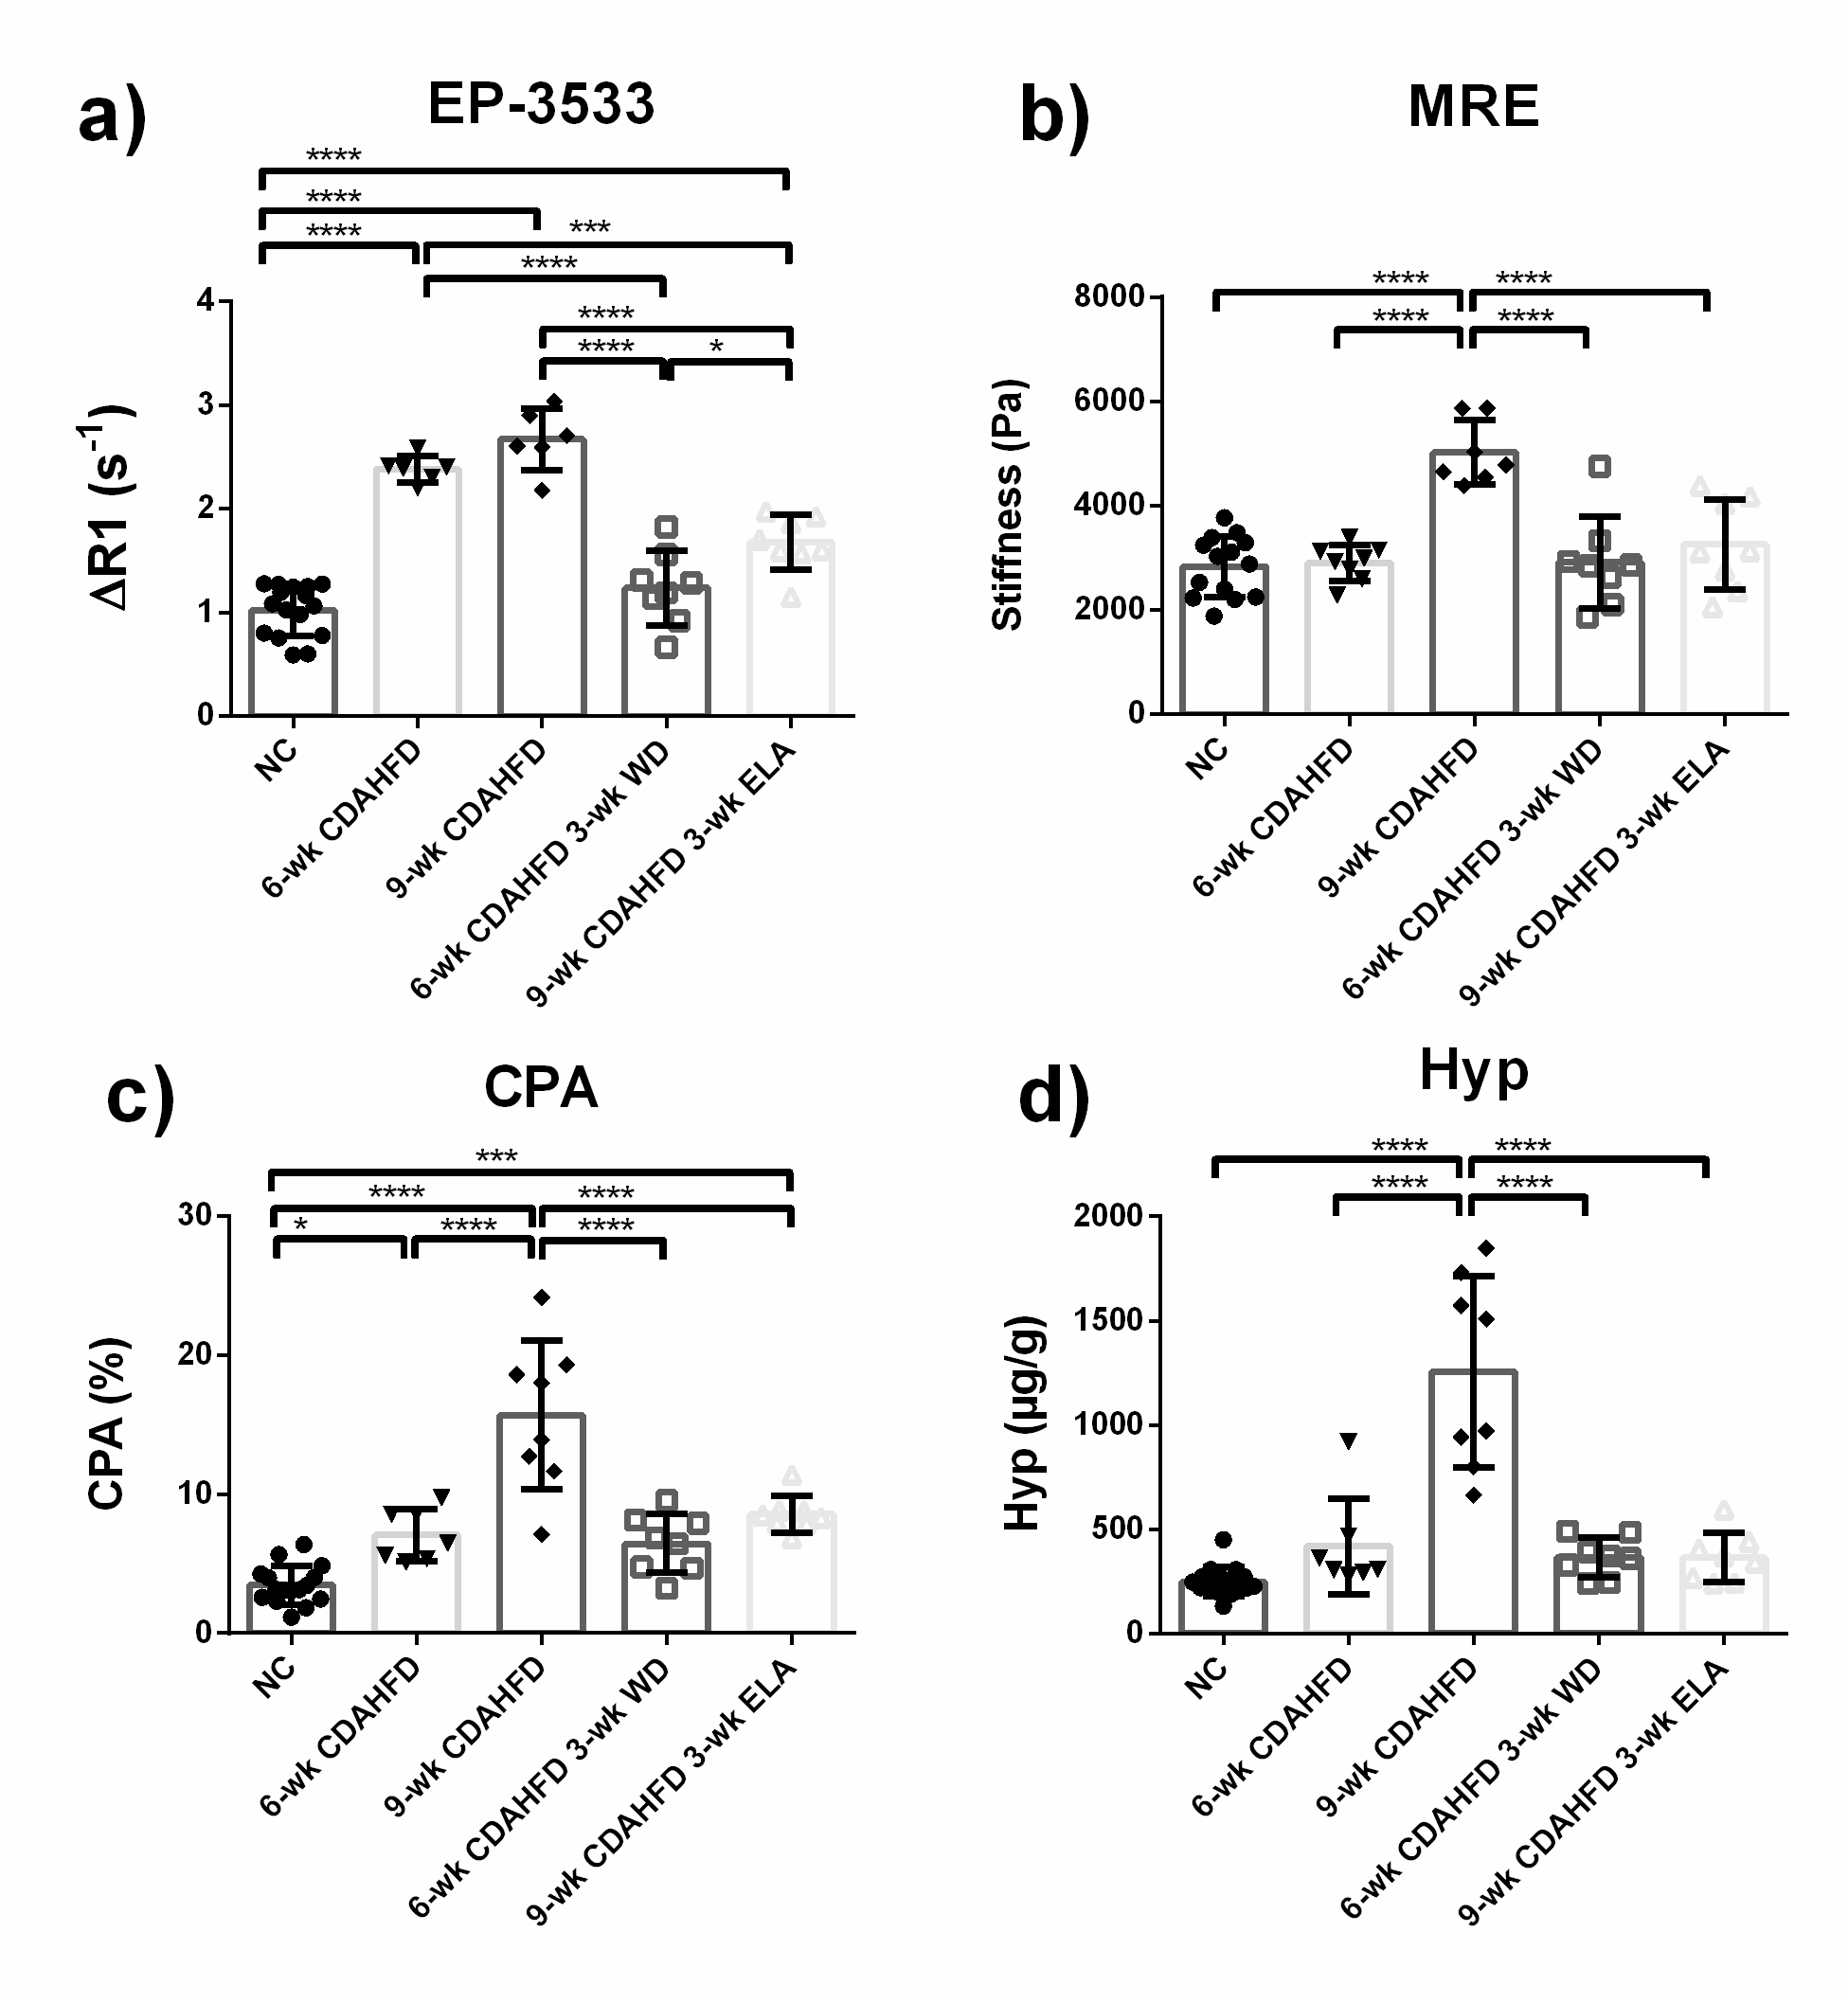
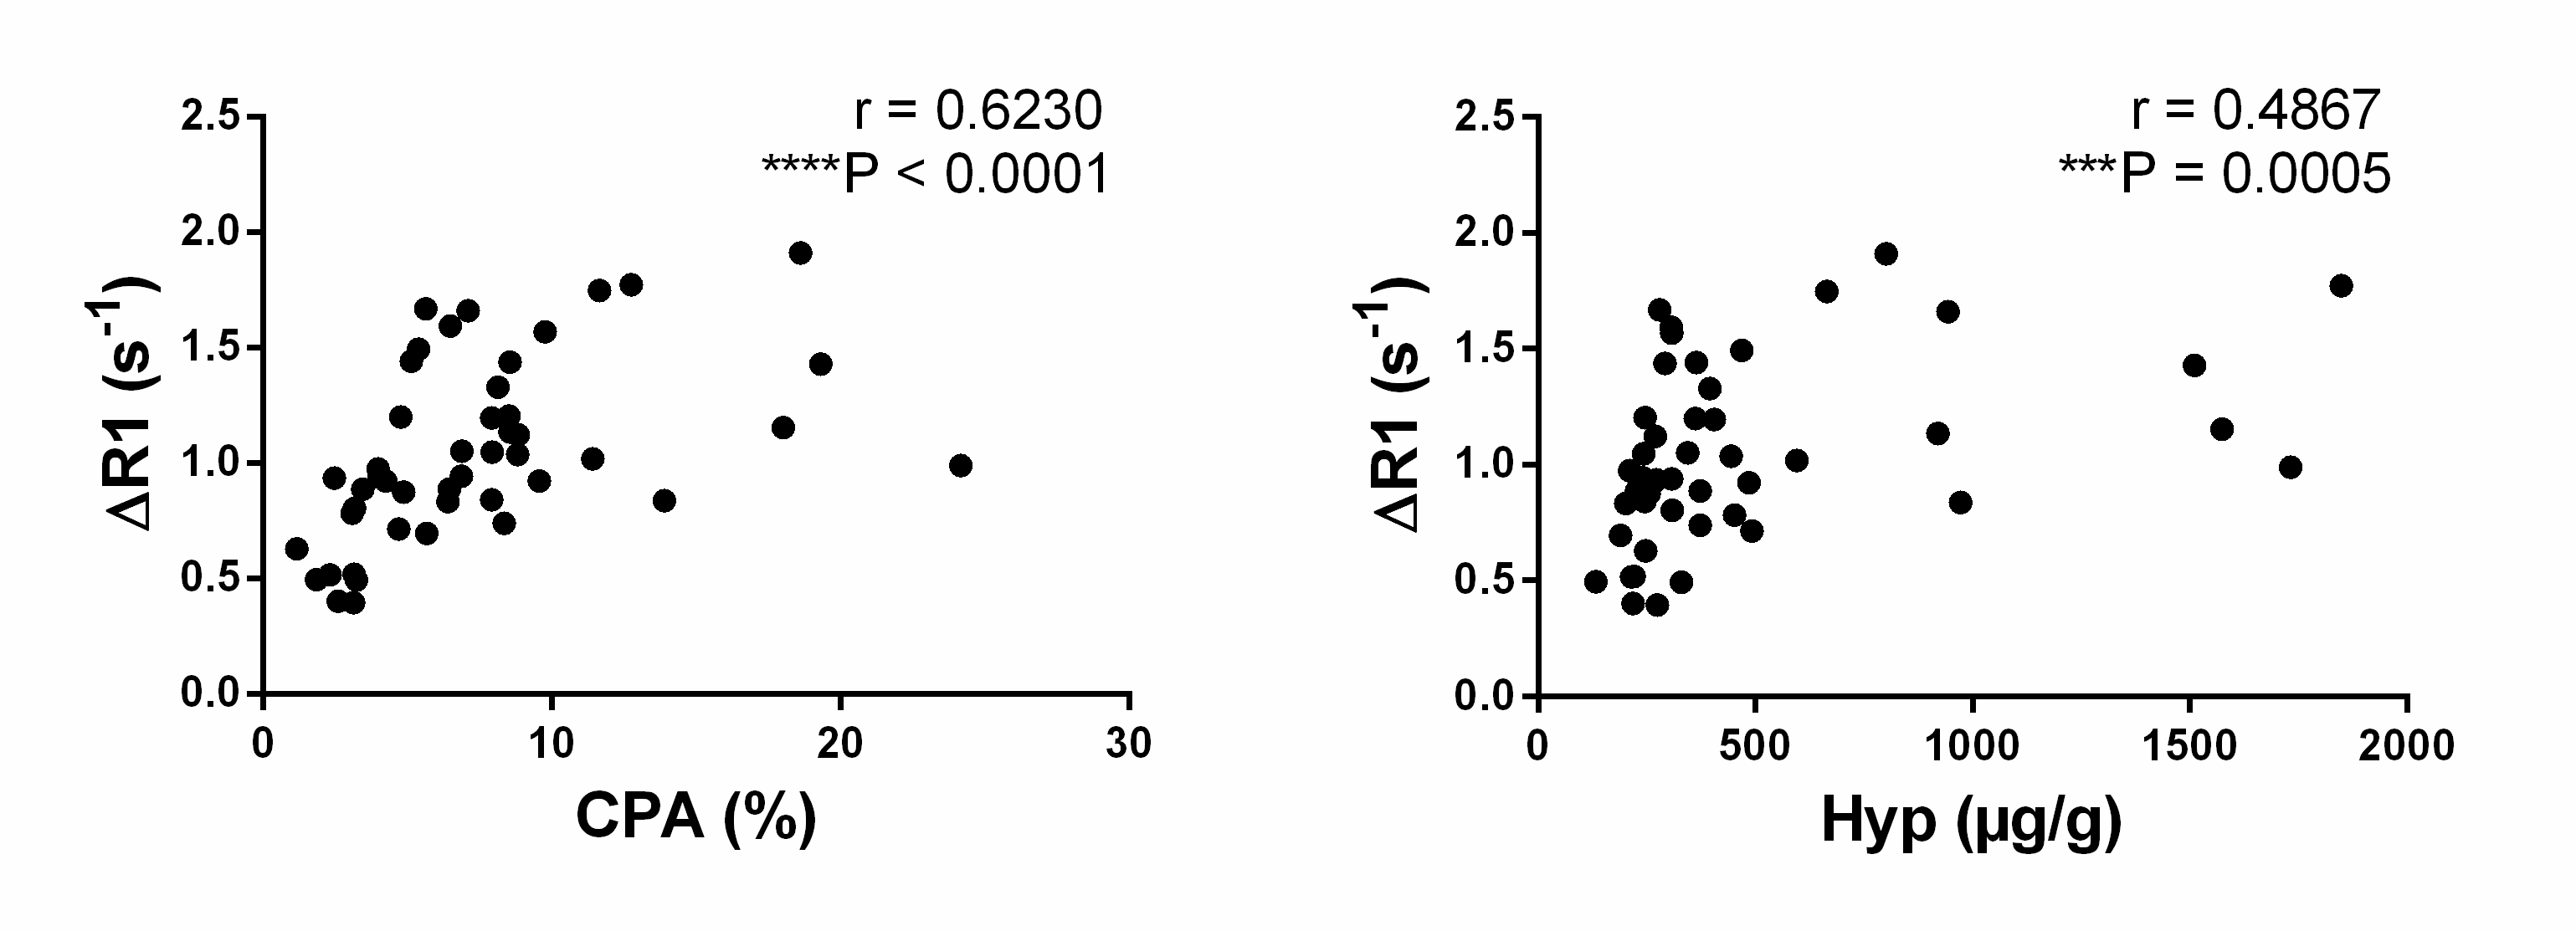
CDAHFD results in liver fibrosis after 6 weeks of diet and fibrosis is severe after 9 weeks on diet as assessed by CPA and Hyp. Treatment with elafibranor or diet change markedly attenuated fibrosis. Representative R1 images acquired before and after EP-3533 and corresponding Sirius Red staining are shown in Fig. 1. Compared to normal controls, ∆R1 was significantly increased at both 6 and 9 weeks after CDAHFD, indicating greater uptake of EP-3533 (Fig. 2a). Compared to normal controls, increased tissue stiffness was only observed after 9 weeks of CDAHFD (Fig. 2b). Both EP-3533 induced ∆R1 and stiffness were significantly decreased in the elafibranor group and the diet switch group compared to the 9 week CDAHFD animals demonstrating noninvasive measurement of treatment response. Fig. 3 shows significant correlation of ∆R1 with CPA and Hyp.Discussion
MRE of tissue stiffness as a function of fibrotic disease progression allows good detection of advanced fibrosis but less discrimination for earlier stages. Previous molecular imaging studies with EP-3533 in different animal models of liver fibrosis also showed this probe to be sensitive in detecting early stages of fibrosis [6-8]. This high sensitivity of EP-3533 imaging for fibrosis can be traced to its high correlation to direct measures of collagen from extracted tissue, such as CPA and Hyp. More importantly, collagen imaging shows potential for not only detecting but also for monitoring treatment responses. In the future, we will use this multi-parametric MRI to formulate a composite metric that accounted for the complementary staging abilities of collagen molecular imaging and MRE for enhanced diagnostic sensitivity.Conclusion
Molecular MRI combined with MRE can assess liver fibrosis and tissue stiffness in rats with NAFLD/NASH. The EP-3533 probe raises new possibilities for clinical imaging of NASH in combination with other advanced MR techniques to accurately characterize disease progression and serve as sensitive tool for evaluating treatment response.Acknowledgements
No acknowledgement found.References
[1] Vernon G, et al. Aliment. Pharmacol. Ther. 2011;34:274-85.
[2] Bataller R, et al. J. Clin. Invest. 2005;115:209-18.
[3] Caravan P, et al. Angew. Chem. Int. Ed. Engl. 2007;46:8171-3.
[4] Huwart L, et al. NMR Biomed. 2006;19:173-9.
[5] Rouviere O, et al. Radiology 2006;240:440-8.
[6] Farrar CT, et al. J. Hepatol. 2015;63:689-96.
[7] Polasek M, et al. J. Hepatol. 2012;57:549-55.
[8] Fuchs BC, et al. J. Hepatol. 2013;59:992-8.
Figures