1226
Metabolic Imaging of Pancreas in a High Fat Diet Fed Obese Rodent Model1Laboratory of Molecular Imaging, Singapore Bioimaging Consortium, Singapore, Singapore
Synopsis
Onset of hyperglycemia and lipotoxicity are associated with reduced β-cell mass and function compromising insulin secretion leading to insulin resistance. It is technically challenging to image pancreas in rodents by conventional imaging approaches. In this study we have utilized GdDOTA-diBPEN to image the pancreas in control and high fat diet (HFD) fed rat model. HFD fed rodent model shows increase in pancreatic fat and functional βcell volume during compensatory phase which is due to the adaptive response to HFD. Longitudinal assessment of pancreatic fat accumulation and βcell mass and function will provide better insights associated with β-cell dysfunction.
Introduction
Onset of hyperglycemia is due to reduced β-cell mass and function compromising insulin secretion leading to insulin resistance. Insulin secretion declines when there is 65% or more loss of β-cells1-3. There are attempts to develop PET tracers to target β-cells4 and are not suitable for longitudinal assessment and pediatric population. Alternatively, MRI based contrast agents are more suitable for longitudinal studies. Recently, MRI based GdDOTA-diBPEN which is sensitive to Zn+2 ions released from β-cells has been developed and evaluated in mice and patients5. In addition to hyperglycemia, the lipotoxicity due to prolonged accumulation of fat in pancreas may also lead to compromised β-cell function by down regulating the insulin secreting genes6. In this study, we investigated the fat accumulation and functional β-cell volume in the pancreas of high fat diet fed rodent model.Methods
Eight weeks old, male Wister rats were randomized into two groups. Group1 (n=5) animals were fed with chow diet (CD) and Group2 (n=5) animals were fed with 60 % high fat diet (HFD) for 4 weeks. Prior to imaging, animals were fasted for 17-19 hours and catheterized for injecting the MR contrast agent GdDOTA-diBPEN. MRI measurements were carried out using 11.7T Bruker scanner. Before contrast injection, 3D-mGRE Multi-point Dixon imaging was performed in abdomen with FOV-65x65mm2, resolution-0.254x0.254mm, ST-35mm, TR-15ms, TE-1.28,1.47,1.66,185,2.04 and 2.23ms, average-1, FA-4°. Insulin secretion in pancreas was stimulated by Glucose (2 gm/Kg) and pre-contrast imaging was performed by using T1 weighted 2D-FLASH sequence with imaging parameters: FOV-65x65 mm2, ST-1mm, slices-35, TR-350ms, TE-2.139ms, FA-35°. After glucose administration, GdDOTA-diBPEN was injected (25mM/Kg B.W.) and imaging was initiated after 10 mts to allow the contrast agent to bind to Zn+2 ions released by β-cells. 2D-FLASH sequence (35 slices) was repeatedly acquired for 1 hour with an interval of 10 mts. Multi-point Dixon data was processed for quantification of fat fraction (FF) by fitting to 6-peak fat model using ISMRM fat-water tool box7-8. Enhancement of image contrast in pancreas was analyzed by computing the image intensity difference between pre- and post-contrast images. Assuming bimodal histogram distribution of difference image intermodes thresholding method was utilized to find the enhancement in pancreas, which was then overlaid on contrast enhanced anatomical images9.Results and Discussion
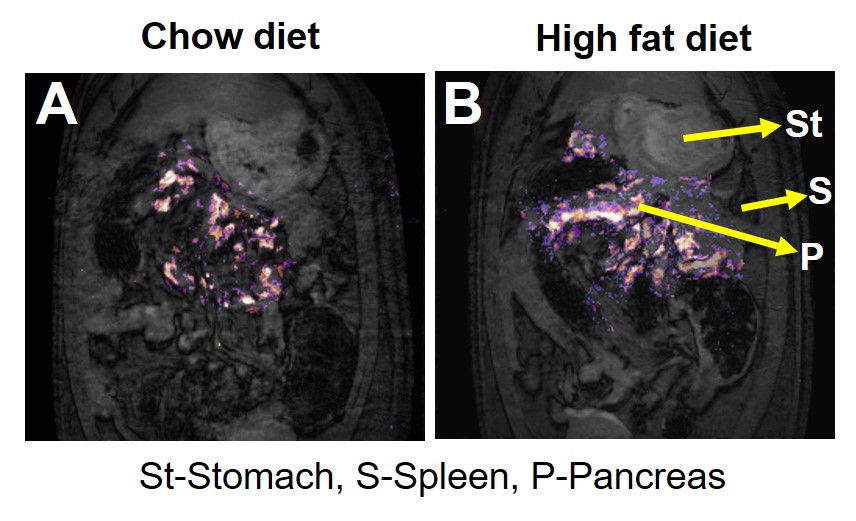
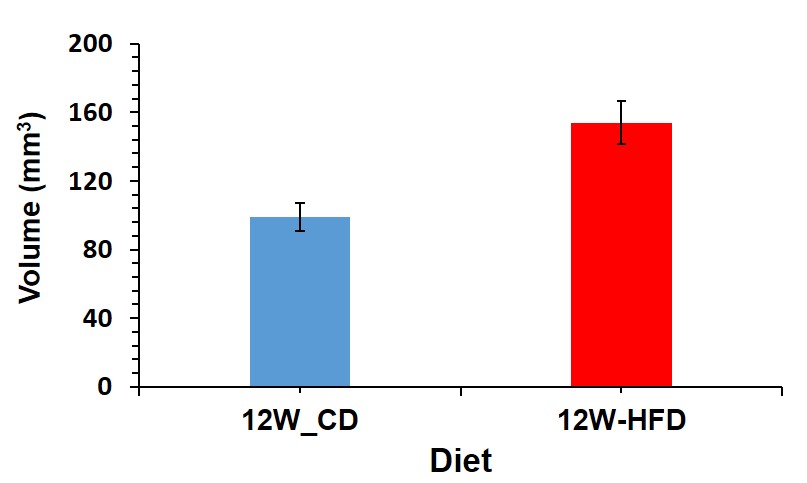
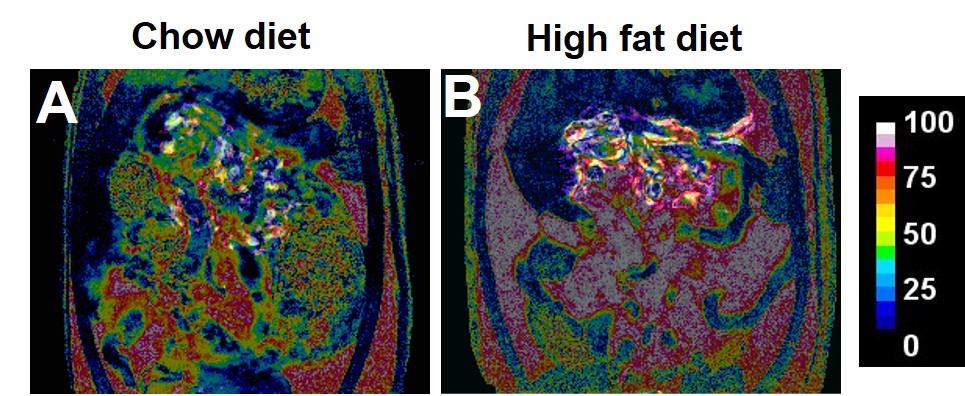
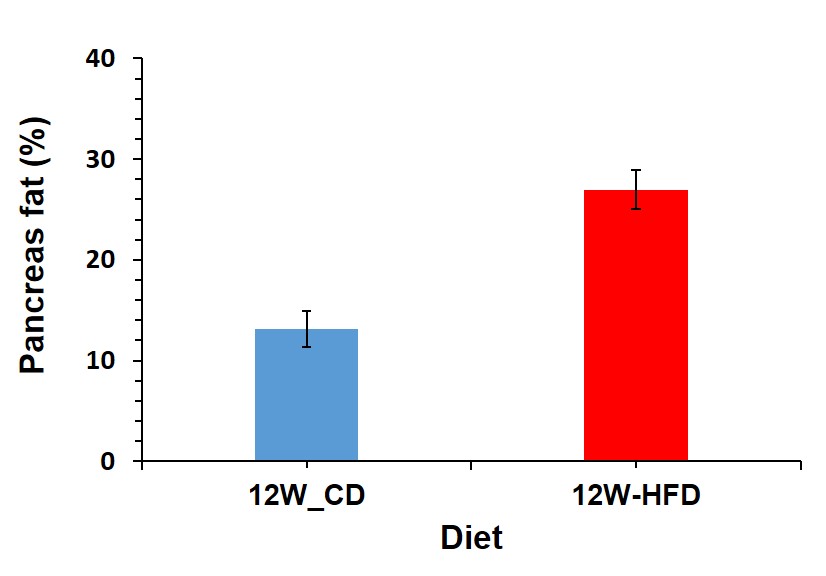
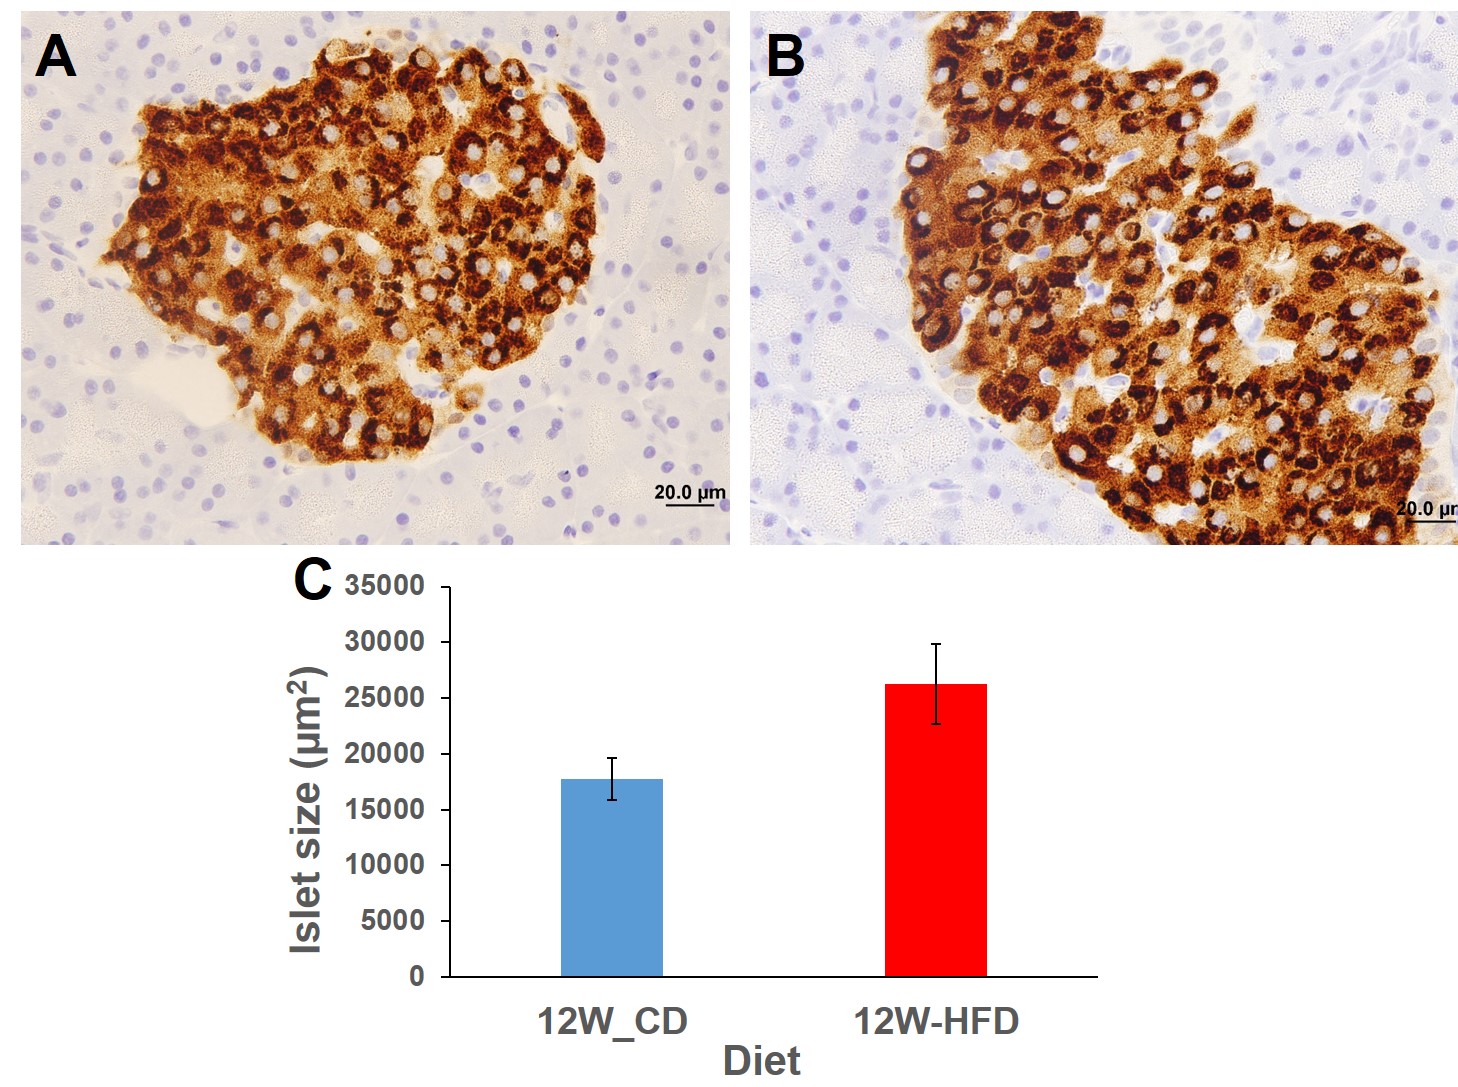
In vivo characterization of pancreas by MR imaging methods is very challenging in rodents due to its size and indefinite structure. Figure 1A,B show the uptake of contrast in pancreas from CD and HFD fed animals. During glucose stimulated insulin secretion, the Zn+2 ions co-released along with insulin from β-cells. Concentration of Zn+2 ions and insulin concentration in the extracellular matrix gradually increase due to glucose response. Enhanced image intensity difference between pre- and post-contrast images indicate the uptake of contrast agent by Zn+2 ions and directly proportional to insulin release and β-cell function. The Zn+2 based MR contrast agent GdDOTA-diBPEN is sensitive to image the functional β-cells in pancreas5. Figure 2 shows quantitative changes in volume of β-cells in CD and HFD animals. Functional β-cell volumes in CD and HFD fed animals were 98 ± 9.08 mm3 and 153 ± 12.06 mm3. β-cell volume in HFD fed animals was 1.58 times (P<0.05) higher compared to CD group. Increase in β-cell volume indicates the compensatory response of pancreas to release increased insulin due to high fat dietary overload. During β-cell compensation phase, it undergoes adoptive response and balances the glucose homeostasis. Figure 3A,B show FF images from CD and HFD animals, where contrast enhanced region generated by taking difference in image intensities between pre- and post-contrast images was overlaid on FF image as described in methods. In Figures 4A,B, the FF in pancreas from HFD fed animal was significantly (P<0.05) higher compared to CD group. Figure 5A, B show the representative immunohistochemistry (IHC) insulin stained sections showing islet morphology from CD and HFD animals. Average area computed from insulin positive islet from HFD fed animals was significantly higher than CD group (Figure 5C). Increase in islet area of HFD animals is consistent with increase in contrast uptake volumes as observed in MR imaging, indicating the increase in functional β-cell volume in response to high fat diet.Conclusions
It is technically challenging to image pancreas in rodents by conventional imaging approaches. In this study we have imaged pancreatic functional β-cells using Zn+2 sensitive MRI contrast agent in CD and HFD fed animals and demonstrated the increase in pancreatic fat and functional b-cell volume during β-cell compensatory phase in response to HFD. Immunohistochemistry results are in agreement with MR results. Our results show potential for longitudinal assessment of pancreatic fat, β-cell mass and function during the progression of diabetes.Acknowledgements
No acknowledgement found.References
1. Dhawan S, Georgia S, Bhushan A, Formation and regeneration of the endocrine Pancreas. Curr Opin Cell Biol. 2007;19:634–645.
2. Klöppel G, Löhr M, Habich K, et al. Islet pathology and the pathogenesis of type 1 and type 2 diabetes mellitus revisited. Surv Synth Pathol Res. 1985;4:110–125
3. Matveyenko AV, Butler P C. Relationship between beta-cell mass and diabetes onset. Diabetes Obes Metab. 2008;10(4):23-31.
4. Singhal T, Ding YS, Weinzimmer D, et al. Pancreatic beta cell mass PET imaging and quantification with [11C]DTBZ and [18F]FP-(+)-DTBZ in rodent models of diabetes. Mol Imaging Biol. 2010;13(5):973-84.
5. Angelo JM. Lubaga, Luis M. et al. Noninvasive MRI of β-cell function using a Zn2+-responsive contrast agent. Proc Natl Acad Sci. 2011; 108:18400-18405.
6. Trevor J.B, Darren R, Damien C, et. al. Chronic Effects of Fatty Acids on Pancreatic β-Cell Function- New Insights From Functional Genomics. Diabetes. 2004;53:S159-S165.
7. Hu HH, Börnert P, Hernando D, et al. ISMRM workshop on fat-water separation: insights, applications and progress in MRI. Magn Reson Med. 2012;68(2):378-88.
8. Hernando, D. et al. 2010. Robust water/fat separation in the presence of large field inhomogeneities using a graph cut algorithm. Magn Reson Med. 2010; 63(1): 79–90.
9. Schneider, C. et al. 2012. NIH Image to ImageJ: 25 years of image analysis. Nature Methods. 2012;9:671.
Figures