1223
Magnetization Transfer Imaging is Insensitive to Decrease in Renal Perfusion: A Graded Ischemia Study on Swine1Division of Nephrology and Hypertension, Mayo Clinic, Rochester, MN, United States
Synopsis
The impact of renal perfusion on magnetization transfer imaging (MTI) was evaluated on seven pigs that underwent consecutive MRI at baseline, 50%, 75%, and 100% acute renal artery stenosis as well as reperfusion. Renal perfusion, R2*, apparent diffusion coefficient (ADC), stiffness, and MT ratio (MTR) were measured. During graded ischemia, decline in renal perfusion was accompanied with elevated R2*, decreased ADC and stiffness. In contrast, no change was observed in the MTR. In conclusion, MTI is insensitive to decrease in renal perfusion and may offer a relatively reliable technique for measurement of renal structural changes.
Introduction
Magnetization transfer imaging (MTI) is an emerging technique for measurement of renal fibrosis.1,2 However, decrease in renal perfusion has been shown to be a confounding factor for fibrosis measurement using magnetic resonance imaging (MRI) techniques including diffusion weighted imaging (DWI) and MR elastography (MRE). However, whether decrease in renal perfusion also affects MTI remains unclear. In this study, we aimed to investigate the sensitivity of MTI to renal perfusion in swine with graded ischemia.Methods
Animal Preparation. Seven 3-month-old female domestic pigs were used in this study. Endotracheal intubation was performed for mechanical ventilation. An inflatable silicone cuff (DOCXS Biomedical Products & Accessories, Ukiah, CA) was placed around the right renal artery to induce graded ischemia.
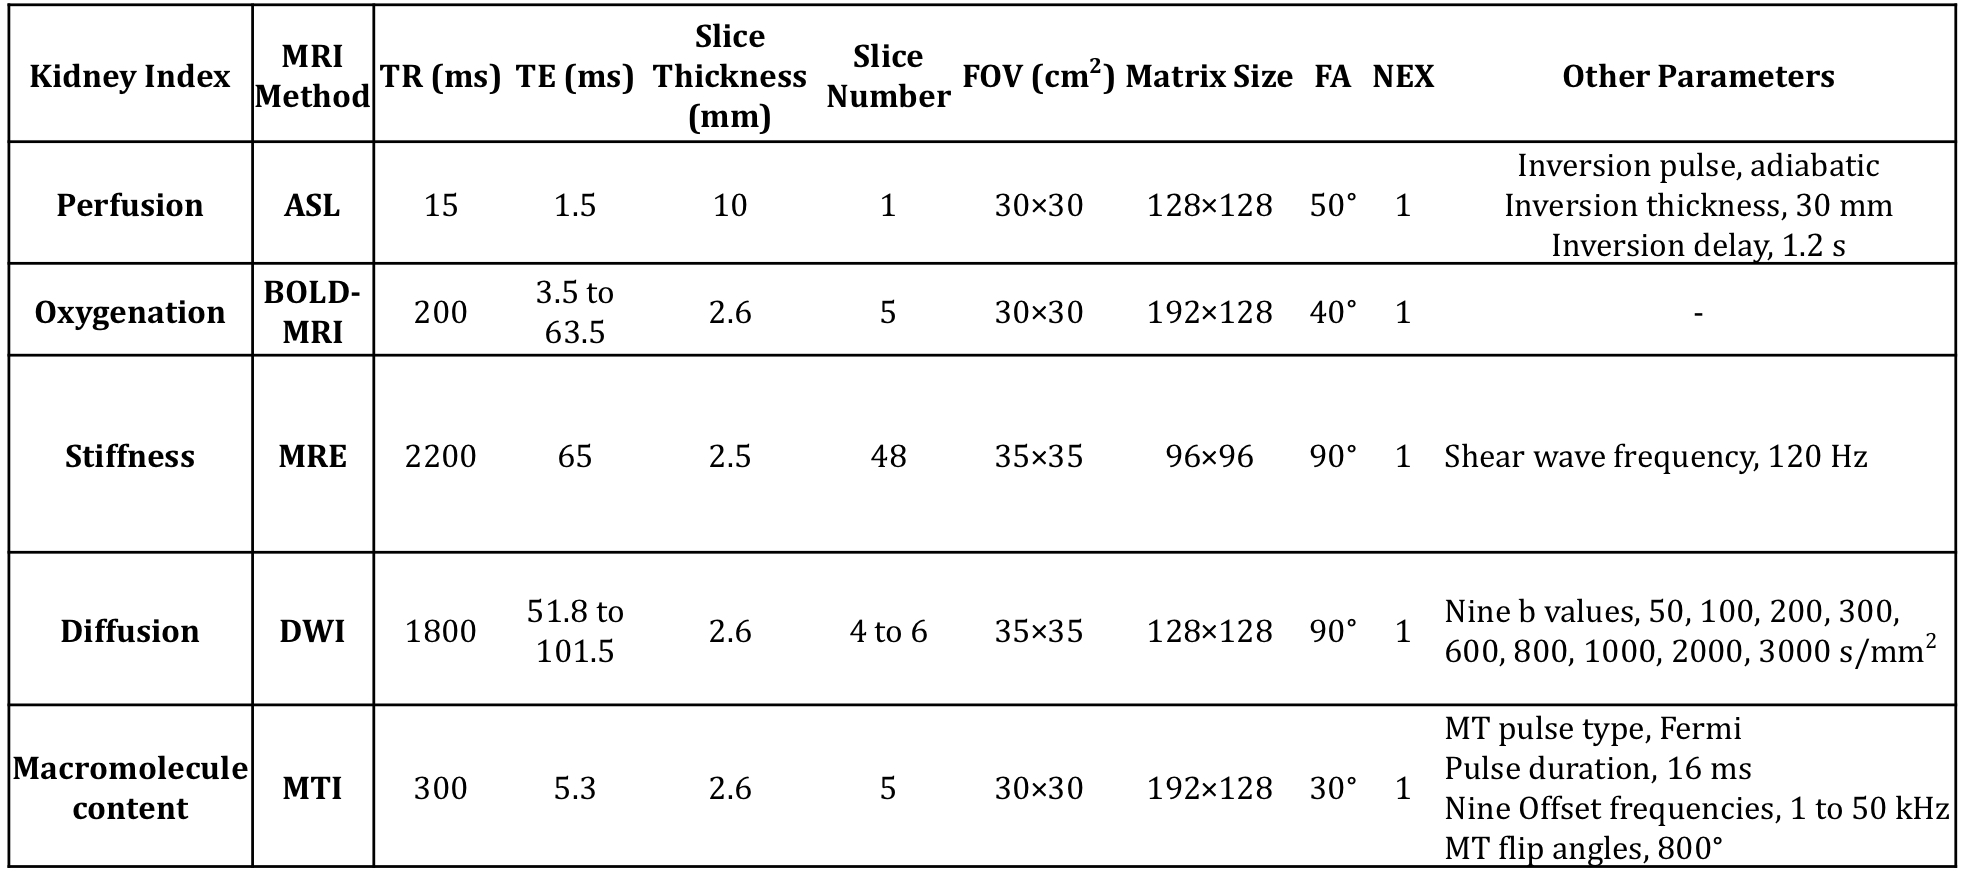
MRI. All animals underwent sequential MRI at baseline, graded ischemia with 50%, 75%, and 100% renal artery stenosis (RAS), and recovery after releasing the cuff, using a GE Signa HDxt 3.0 T scanner (GE Healthcare, Waukeshau, WI). A 5-min rest period between sessions was used for renal hemodynamics to stabilize. Multi-parametric MRI was used to measure renal perfusion using arterial spin labeling, R2* using blood oxygenation level dependent MRI (BOLD-MRI), stiffness using MRE, apparent diffusion coefficient (ADC) using DWI, and the magnetization transfer ratio (MTR) using MTI. Imaging sequences and corresponding parameters are shown in Fig. 1.
Image Analysis. Renal cortical perfusion map was generated from the difference image of the tagged and non-tagged images, as described previously.3 Kidney T2* was calculated by mono-exponential fitting of the BOLD images with different echo times and R2* as 1/T2*. The MTR was calculated as the percentage signal decrease from baseline to MT-weighted images, and then normalized by MTR of the ipsilateral psoas muscle major to correct for B1 variations.2 Cortical and medullary regions-of-interest (ROIs) for BOLD-MRI and MTI were selected on T2*-weighted images using a semi-automated image segmentation algorithm.2 Renal elastograms were obtained by post-processing wave images using a multi-model direct inversion algorithm.4 The cortical and medullary ROIs for MRE were defined on T1-weighted images. Kidney ADC maps were generated by pixel-wise mono-exponential fitting of the diffusion-weighted images at all b-values. The whole kidney parenchyma was used for calculation of the averaged ADC.
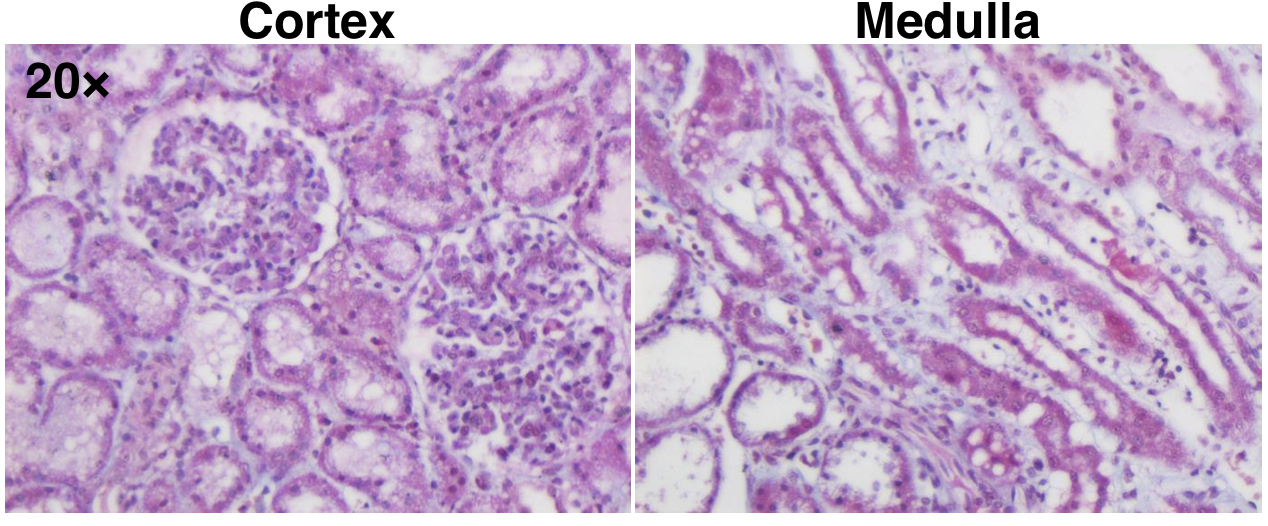
Histology. After MRI, all pigs were euthanized with kidney harvested for Masson’s trichrome staining.
Results
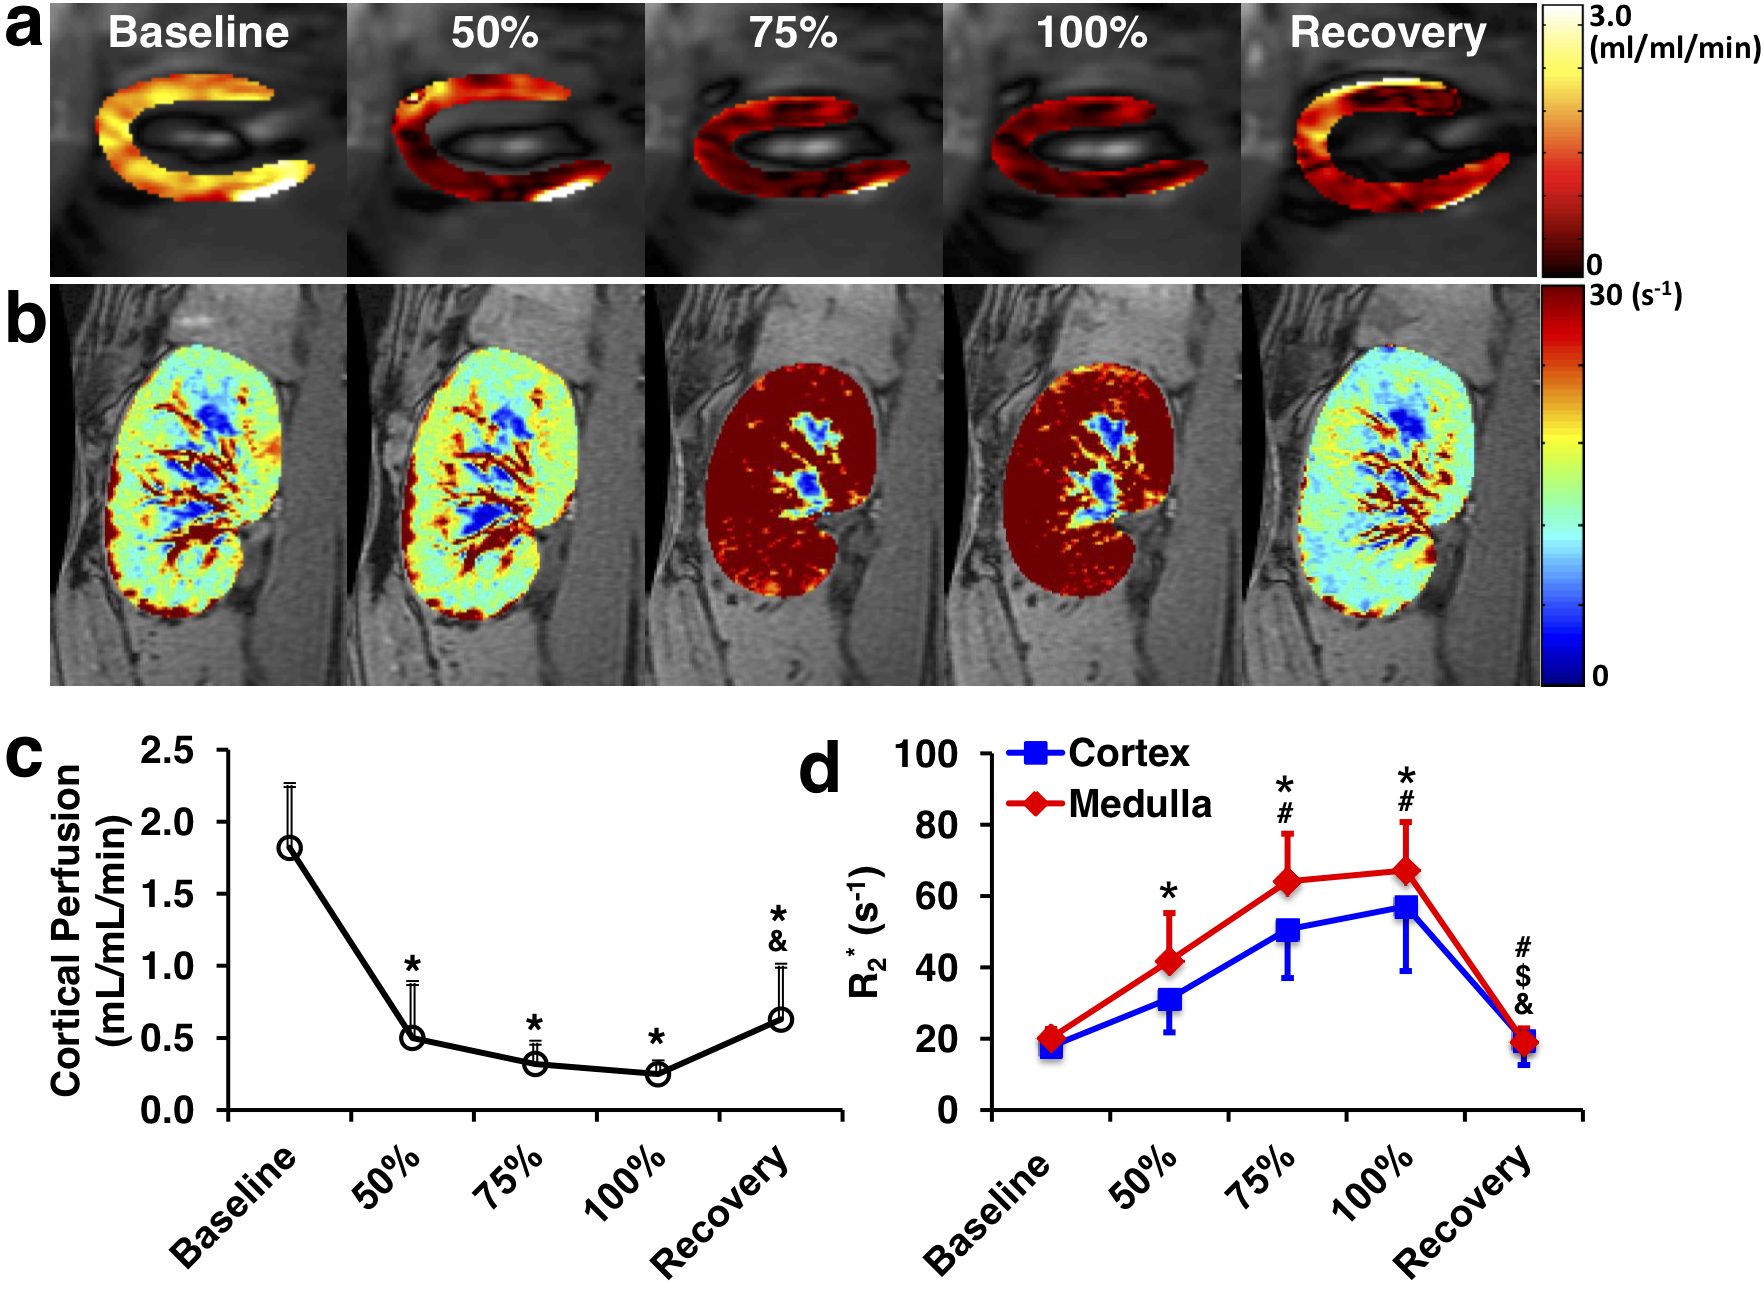
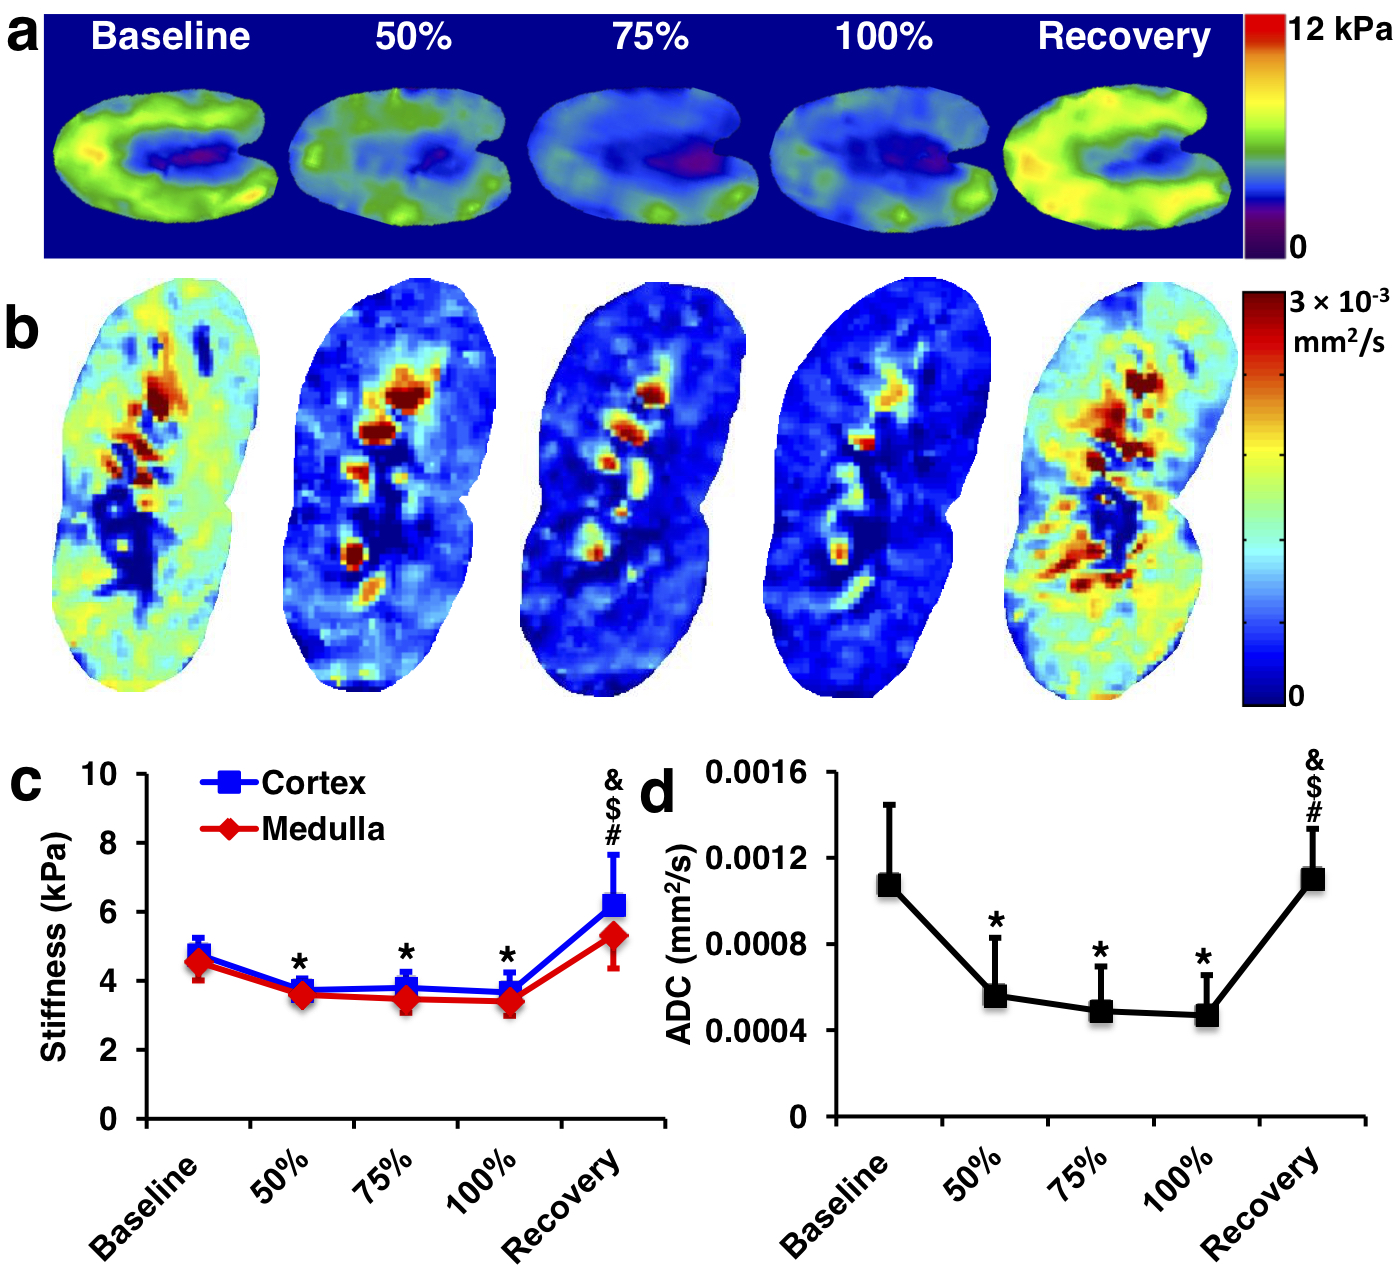
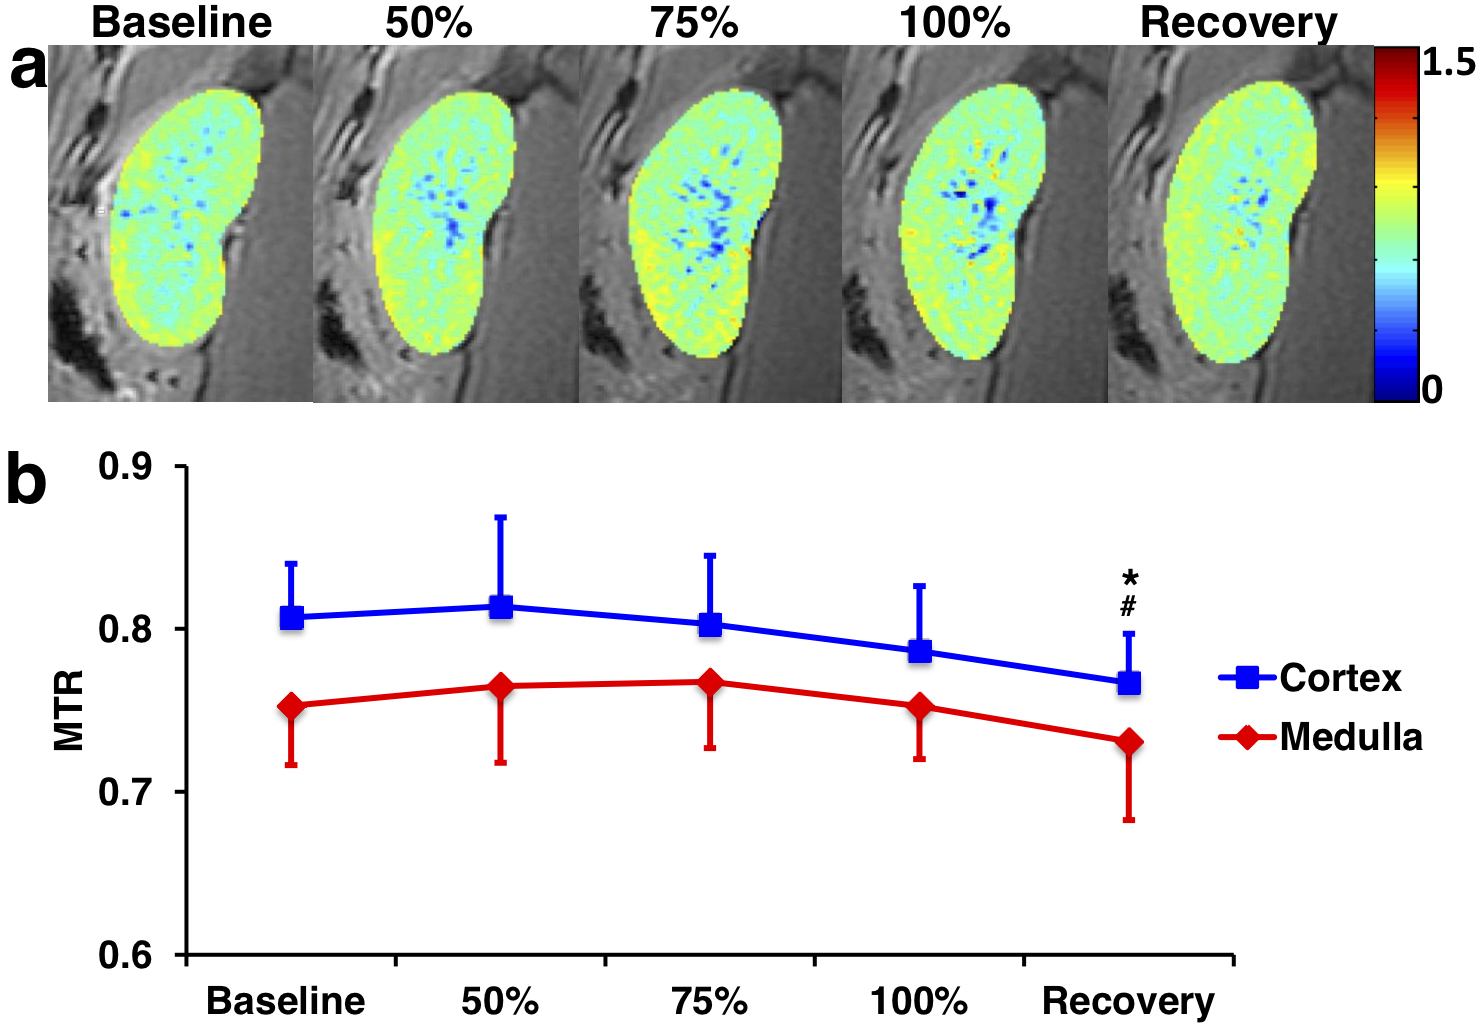
Representative cortical perfusion and kidney R2* maps at baseline, graded ischemia, and recovery are shown in Fig. 2a and b, respectively. The cortical perfusion decreased sharply at all degrees of RAS, and slightly recovered but remained lower than baseline after releasing the cuff. Renal cortical and medullary hypoxia extensively increased from baseline to 75% stenosis, remained stable at 100% stenosis, and returned to basal level after reperfusion (Fig. 2d). Shown in Fig. 3a and b are representative renal stiffness and ADC maps at all time points. The calculated cortical and medullary stiffness was lower at all grades of ischemia, and fully recovered after reperfusion. Similar changes were also observed in the ADC of the kidney parenchyma. In comparison, cortical and medullary MTR remained unchanged from baseline to all degrees of RAS, but a slight drop in cortical MTR was observed at recovery. No signs of renal fibrosis were observed in trichrome-stained kidney tissues (Fig. 5).Discussion
MRI techniques such as DWI and MRE offer new possibilities for noninvasive assessment of renal fibrosis. Nevertheless, concurrent decline in renal perfusion has been shown to jeopardize the capability of these MRI techniques in reliably detecting renal fibrosis. Whereas ADC reflects also renal function and tubular flow rather than merely fibrosis,5 a decrease in renal perfusion reduces the cortical turgor and negates cortical stiffness as a measure of renal fibrosis.6 In our study, such effects were also observed in swine with graded ischemia and without renal fibrosis. In contrast, the MTR, which has been recently shown to be a useful biomarker of renal fibrosis,1,2 was found insensitive to decrease in renal perfusion during graded ischemia. The slight drop in cortical MTR at recovery may be attributed to edema as a result of ischemia-reperfusion injury.7Conclusion
Magnetization transfer imaging is insensitive to decrease in renal perfusion and may offer a relatively reliable MRI technique for measurement of renal structural changes.Acknowledgements
NAReferences
1. Jiang K, Ferguson CM, Ebrahimi B, et al. Noninvasive Assessment of Renal Fibrosis with Magnetization Transfer MR Imaging: Validation and Evaluation in Murine Renal Artery Stenosis. Radiology. 2017;283(1):77-86.
2. Jiang K, Ferguson CM, Woollard JR, Zhu X, Lerman LO. Magnetization Transfer Magnetic Resonance Imaging Noninvasively Detects Renal Fibrosis in Swine Atherosclerotic Renal Artery Stenosis at 3.0 T. Invest Radiol. 2017;52(11):686-692.
3. Zun Z, Wong EC, Nayak KS. Assessment of myocardial blood flow (MBF) in humans using arterial spin labeling (ASL): feasibility and noise analysis. Magn Reson Med. 2009;62(4):975-983.
4. Yin M, Glaser KJ, Talwalkar JA, Chen J, Manduca A, Ehman RL. Hepatic MR Elastography: Clinical Performance in a Series of 1377 Consecutive Examinations. Radiology. 2016;278(1):114-124.
5. Boor P, Perkuhn M, Weibrecht M, et al. Diffusion-weighted MRI does not reflect kidney fibrosis in a rat model of fibrosis. J Magn Reson Imaging. 2015;42(4):990-998.
6. Korsmo MJ, Ebrahimi B, Eirin A, et al. Magnetic resonance elastography noninvasively detects in vivo renal medullary fibrosis secondary to swine renal artery stenosis. Invest Radiol. 2013;48(2):61-68.
7. Kosieradzki M, Rowinski W. Ischemia/reperfusion injury in kidney transplantation: mechanisms and prevention. Transplant Proc. 2008;40(10):3279-3288.
Figures