1222
Spin-lock Relaxation Rate Dispersion Reveals Spatiotemporal Changes Associated with Tubulointerstitial Fibrosis in Murine Kidney1Vanderbilt University Institute of Imaging Science, Vanderbilt University Medical Center, Nashville, TN, United States, 2Division of Nephrology and Hypertension, Vanderbilt University Medical Center, Nashville, TN, United States
Synopsis
Currently there are no reliable non-invasive means for assessing the severity and progression of fibrosis in kidneys. Here we evaluate spin-lock MR imaging with different locking fields for detecting progressive renal fibrosis in an hHB-EGFTg/Tg mouse model. We fit the dispersion of spin-lock relaxation rates R1ρ at different locking fields (frequencies) to a model of exchanging water pools and assessed the value of the derived quantities for detecting tubulointerstitial fibrosis in kidney, including the transverse relaxation rate (R2), the asymptotic value of R1ρ at high locking frequency (R1ρinf), an exchange rate-weighted parameter Sρ, and the inflection frequencies ωinfl in the dispersion.
Purpose
Renal fibrosis is a hallmark of chronic kidney disease, which drives further kidney injury and leads to renal failure. Excessive tissue scarring or fibrosis is a critical contributor to chronic kidney disease; however, current clinical tests are insufficient for assessing renal fibrosis non-invasively. At high fields, the spin-lock relaxation rate R1ρ varies with the locking field amplitude (frequency) and analysis of this dispersion provides information related to exchange processes between water pools in tissues, such as free water and labile side groups on macromolecules, and their characteristic mobilities and relaxation rates. In this study, we evaluated the ability of parameters derived from spin-lock relaxation dispersion imaging for detecting tubulointerstitial fibrosis in a murine renal fibrosis model with selective activation of epidermal growth factor receptor in renal proximal tubule.1Methods
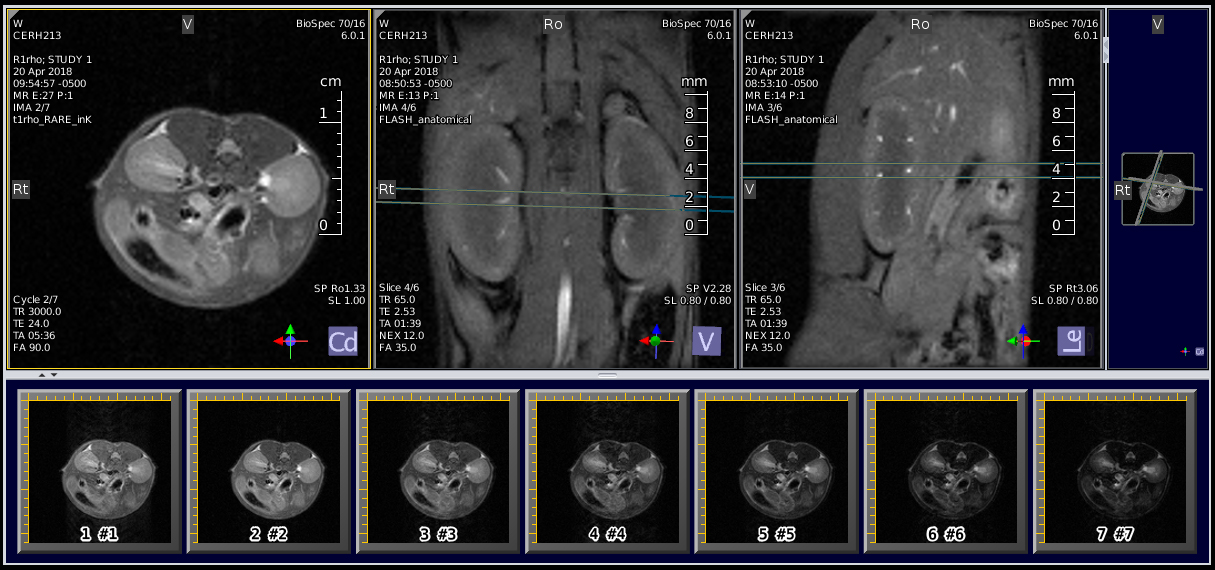
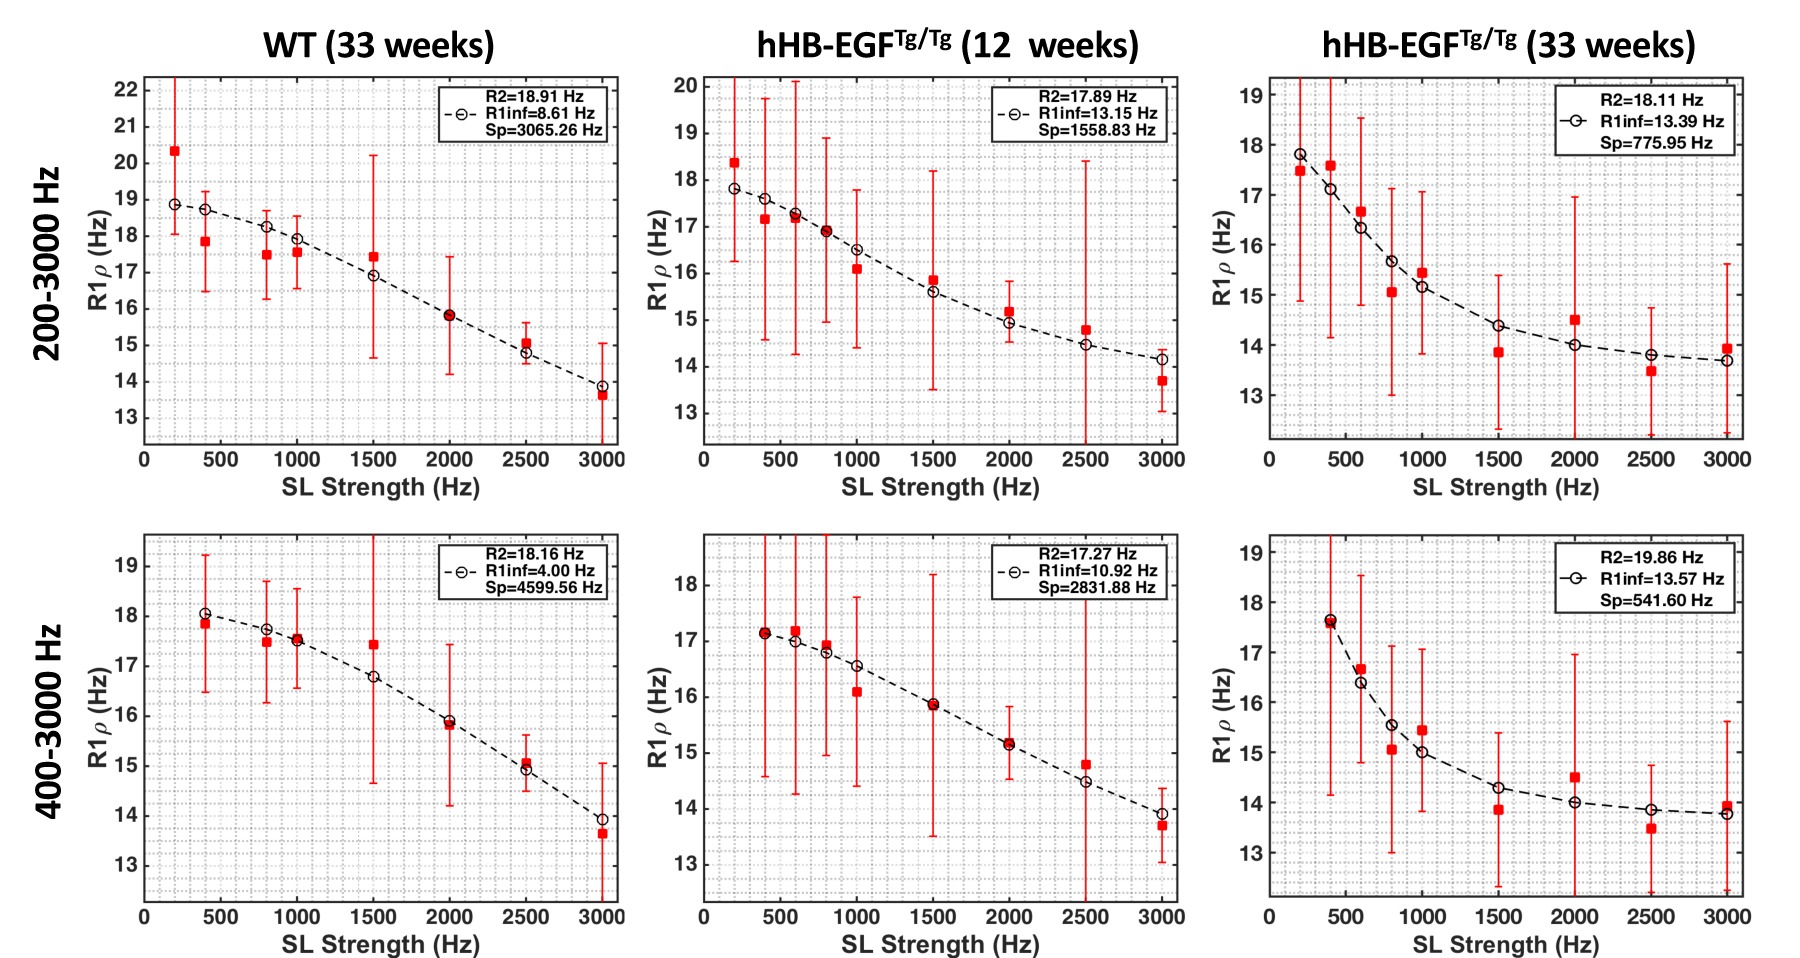
The hHB-EGFTg/Tg mice, a well-established model of progressive fibrosis1, at ages 9-12 and 30-33 weeks old, and normal wild type (WT) mice of similar age, were imaged at 7T. Spin-lock images were acquired in a transverse plane (Fig. 1) using a fast spin echo sequence preceded by a preparatory spin-lock cluster. Imaging parameters were TR/TE = 3000/24 msec, RARE factor = 8, resolution = 0.25 x 0.25 x 1 mm3, number of excitations NEX = 12. Sets of images were acquired with different spin-lock amplitudes ω1 (200, 400, 600, 800, 1000, 1500, 2000, 2500 and 3000 Hz). Spin-lock times were varied as 1, 5, 15, 25, 35, 55, 75 msec (Fig. 1). R1ρ values were obtained for each locking field by fitting signals to a single exponential decay with locking time. The dispersion of R1ρ with ω1 was fit to a model proposed by Chopra et al.2 as in previous studies3. The fits provided transverse relaxation rate R2, R1ρ at infinite spin-lock frequency (R1ρinf), and an exchange rate-weighted parameter Sρ. In realistic cases, Sρ2 ≈ ksw2 + Δωs2, where ksw is the chemical exchange rate of protons with resonance frequency offset from water Δωs. The inflection frequencies ωinfl of the dispersion curves were also calculated4. The significances of differences in derived parameters between groups were evaluated using Student’s t-tests. Paraffin tissue sections were stained with Masson trichrome using standard procedures for histological confirmation.Results
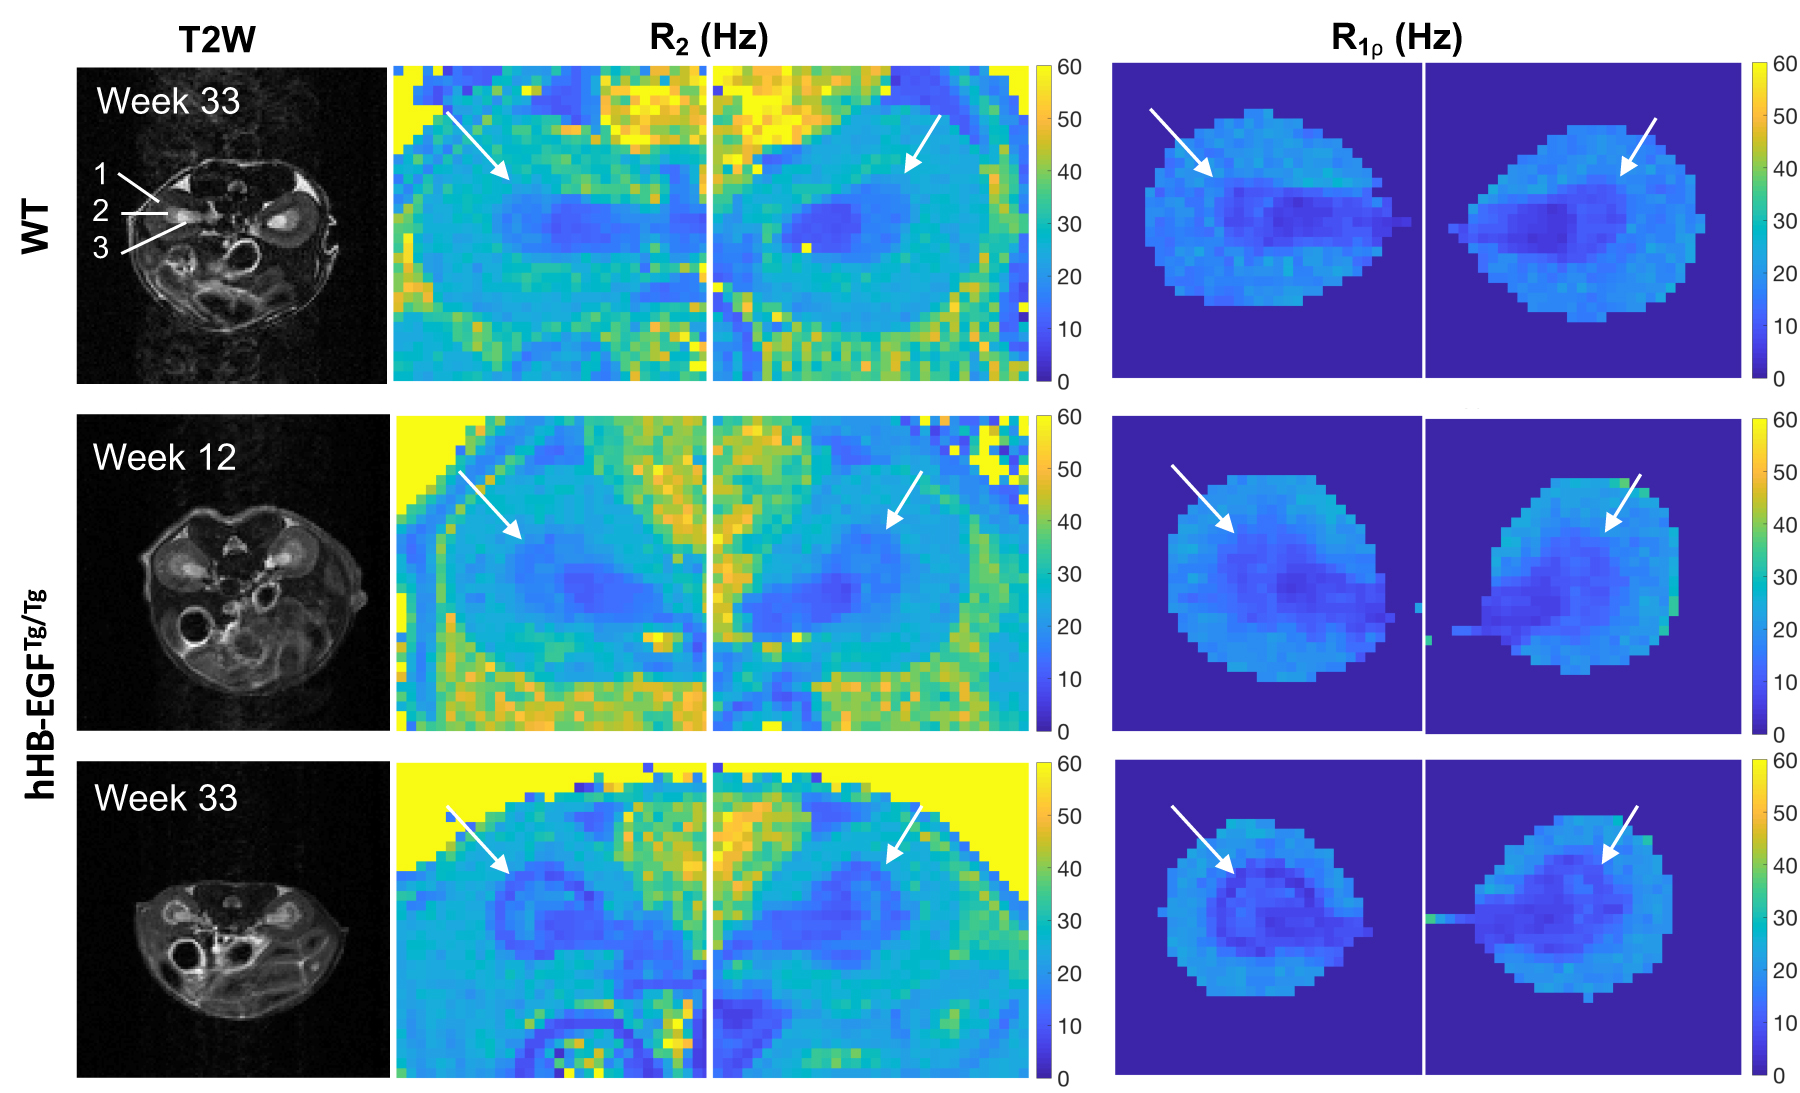
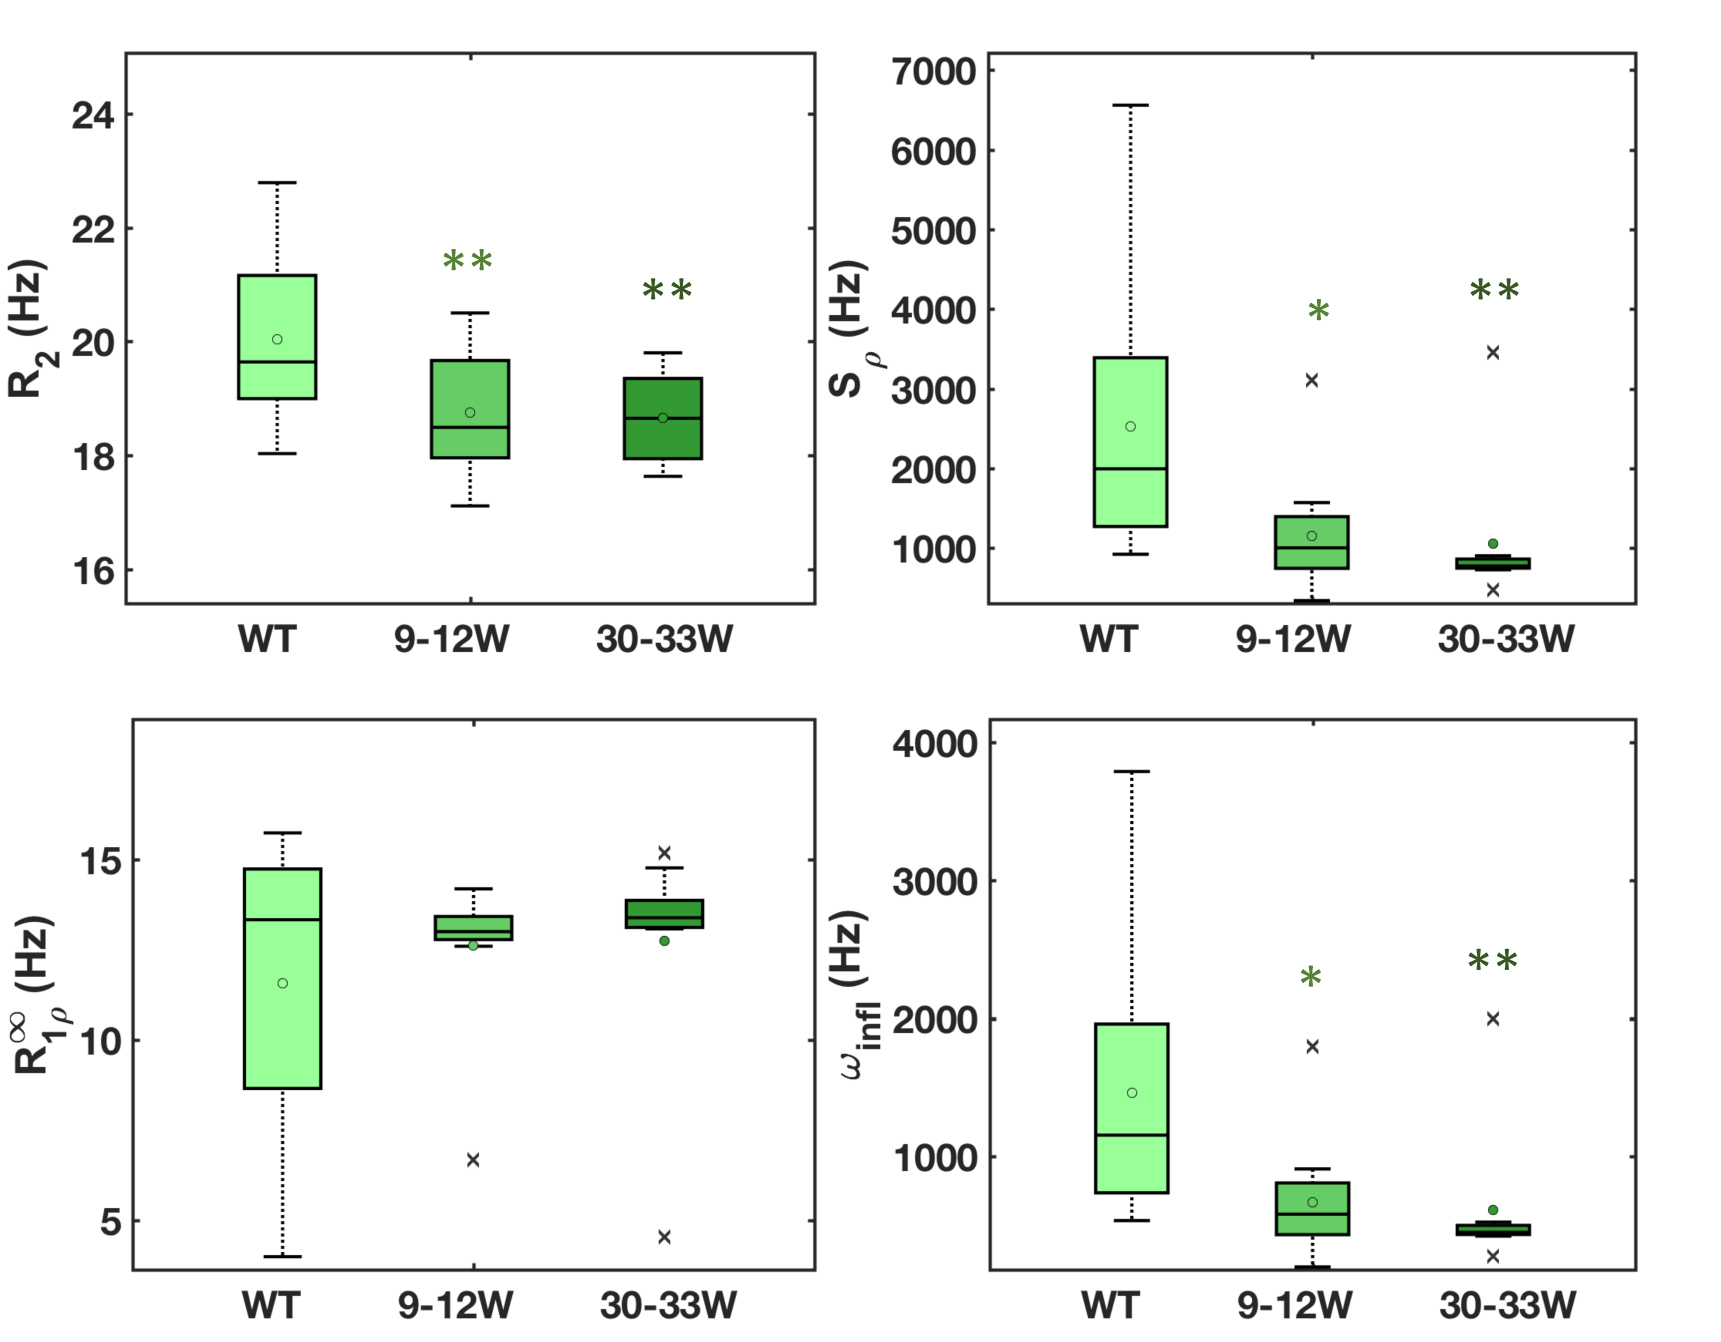
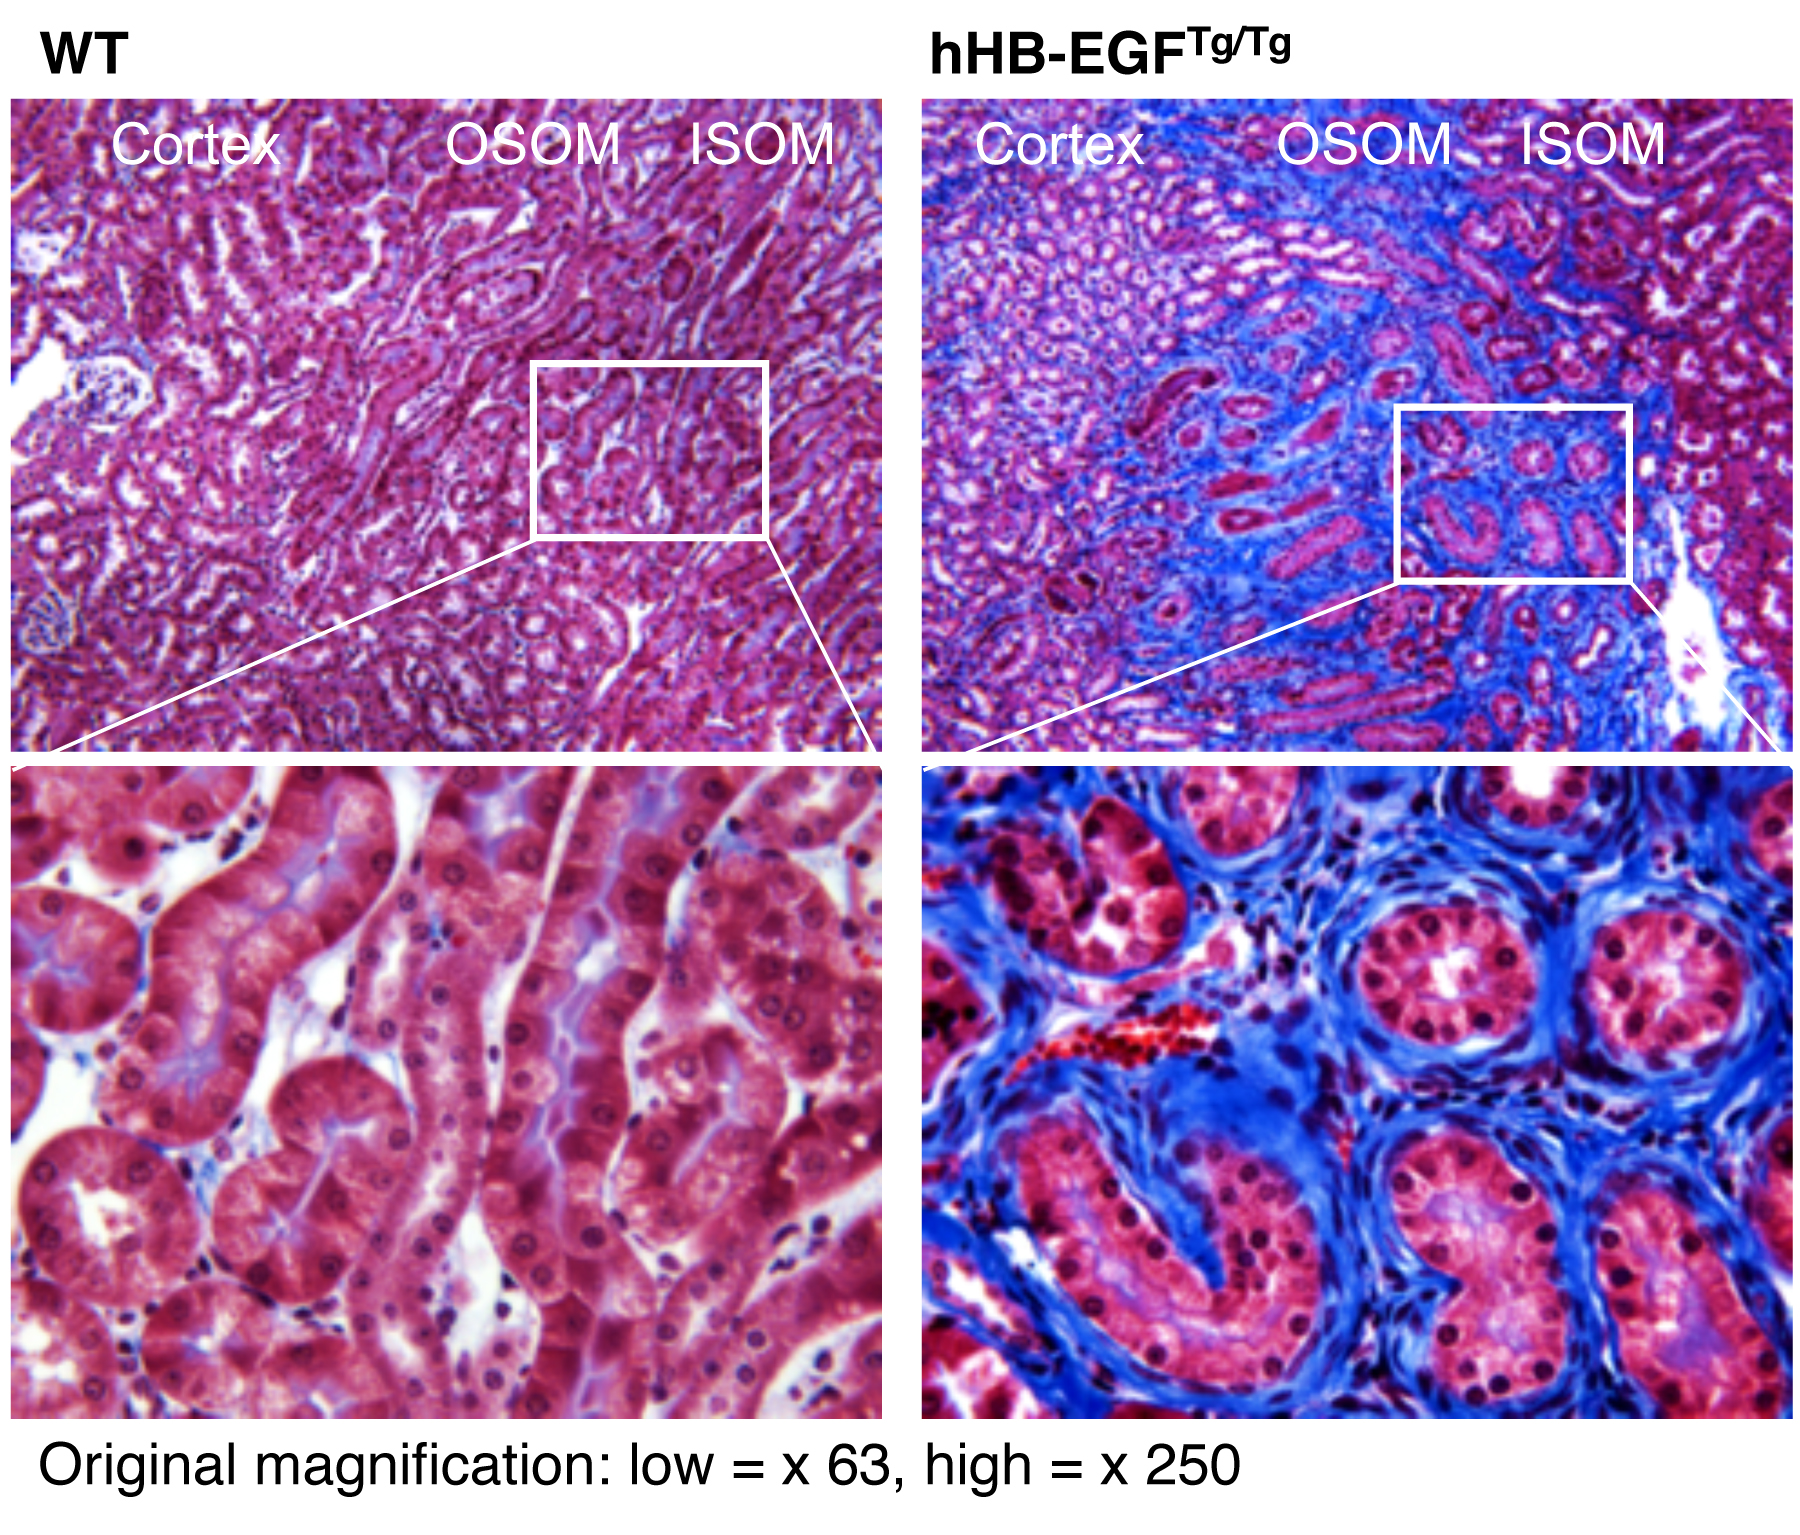
MR images differentiated cortex from medulla with good contrast (Fig. 1). To simplify comparisons between groups, we integrated values over ROIs corresponding to the cortex and outer medulla (Fig. 2). At 7T all kidneys showed considerable dispersion in R1ρ with locking field, deceasing about 25% over the range 400 – 3000 Hz (Fig. 3). Figure 4 summarizes the values of the derived parameters for WT and diseased animals at different ages. R2 values clearly dropped slightly as fibrosis progressed. There was less variation in the asymptotic value of R1ρinf between the groups. These small changes suggest that R1 and R2 relaxation rates are not changed much during fibrosis as total protein and water content are not changed drastically. However, the exchange parameter Sρ and the inflection frequencies changed by much larger factors. To good approximation, both Sρ and the inflection frequency depend primarily on the exchange rate between water and other chemically shifted resonances such as hydroxyls and amides2. This average exchange rate is sensitive to changes in pH and other physico-chemical aspects of the tissue microenvironment such as increases in fractions of proteins with slower exchanging or smaller chemically shifted protons. Histology detected extensive fibrosis in the hHB-EGFTg/Tg mice (Fig. 5), in which collagen deposition and capillary density reduction were observed in the fibrotic regions of kidneys.Conclusion
Renal tubulointerstitial fibrosis in kidneys can be assessed by spin-locking MRI and measures from R1ρ dispersion. This technique provides exchange rate information in addition to relaxation rates, which may be used as a novel imaging biomarker to assess chronic renal diseases.Acknowledgements
We thank Mr. Fuxue Xin, Mr. Ken Wilkens, Mr. Jarrod True, and Dr. Mark D. Does in the Center for Small Animal Imaging at Vanderbilt University Institute of Imaging Science. This work was supported by National Institutes of Health grants EB024525 and DK114809. This work was also supported by grant 1S10OD019993-01 for the Advance III HD Console, housed in the Vanderbilt Center for Small Animal Imaging.References
1. Overstreet JM, Wang YQ, Wang X, et al. Selective activation of epidermal growth factor receptor in renal proximal tubule induces tubulointerstitial fibrosis. Faseb J. 2017;31:4407-4421.
2. Chopra S, Mcclung RED, Jordan RB. Rotating-Frame Relaxation Rates of Solvent Molecules in Solutions of Paramagnetic-Ions Undergoing Solvent Exchange. J Magn Reson. 1984;59:361-372.
3. Spear JT, Gore JC. Effects of diffusion in magnetically inhomogeneous media on rotating frame spin-lattice relaxation. J Magn Reson. 2014;249: 80-87.
4. Spear JT, Zu ZL, Gore JC. Dispersion of Relaxation Rates in the Rotating Frame Under the Action of Spin-Locking Pulses and Diffusion in Inhomogeneous Magnetic Fields. Magn Reson Med. 2014;71:1906-1911.
Figures