1221
Dynamic BOLD Responses of Renal Tissues to interleaved Hypoxia and Hyperoxia in Healthy Rats as Measured by MRI at 7T1School of Biomedical Engineering, Guangdong Provincial Key Laborary of Medical Image Processing, Southern Medical University, Guang Zhou, China, 2Philips Healthcare, Guang Zhou, China, 3State Key Laboratory of Organ Failure Research, National Clinical Research Center of Kidney Disease, Nanfang Hospital, Southern Medical University, Guangzhou, China, Guang Zhou, China, 4Laboratory of Biomedical Imaging and Signal Processing, The University of Hong Kong,Pokfulam,Hong Kong SAR,China, Hong Kong, China
Synopsis
Renal oxygen status is tightly correlated with renal (patho)physiology. How the renal oxygen is regulated in response to interleaved hypoxia and hyperoxia has not been well investigated. In this work we utilized dynamic BOLD MRI with temporal resolution of 9 seconds to track the renal tissues oxygen responses in healthy rats, thereafter, characterizing the renal oxygen changes by a mathematic model. In the experiment, significant T2* overshot was observed in outer medulla at the initial stage of re-oxygenation. Significant difference of model parameters compared among renal cortex, outer medulla and inner medulla was observed.
INTRODUCTION:
Blood oxygen level dependent (BOLD) MRI is a promising technique for noninvasively monitoring renal oxygen1. Recently, several works2,3 utilized continuous BOLD MRI (temporal resolution > 2 minutes) to track renal oxygen changes under the circumstance of external gas stimuli, and only the T2* difference (ΔT2*) between before and after gas challenge was reported. To our knowledge, the variations of tissue oxygen during the transient stage of gas alterations is also important and tightly correlated with renal (patho)physiology4,5, and its tracking requires a fast BOLD MRI. The gas challenge schedule, interleaved hypoxia and hyperoxia6, has been utilized in in vitro experiments in investigating renal tissues oxidative stress and has not been investigated in in vivo BOLD MRI.
METHODS:
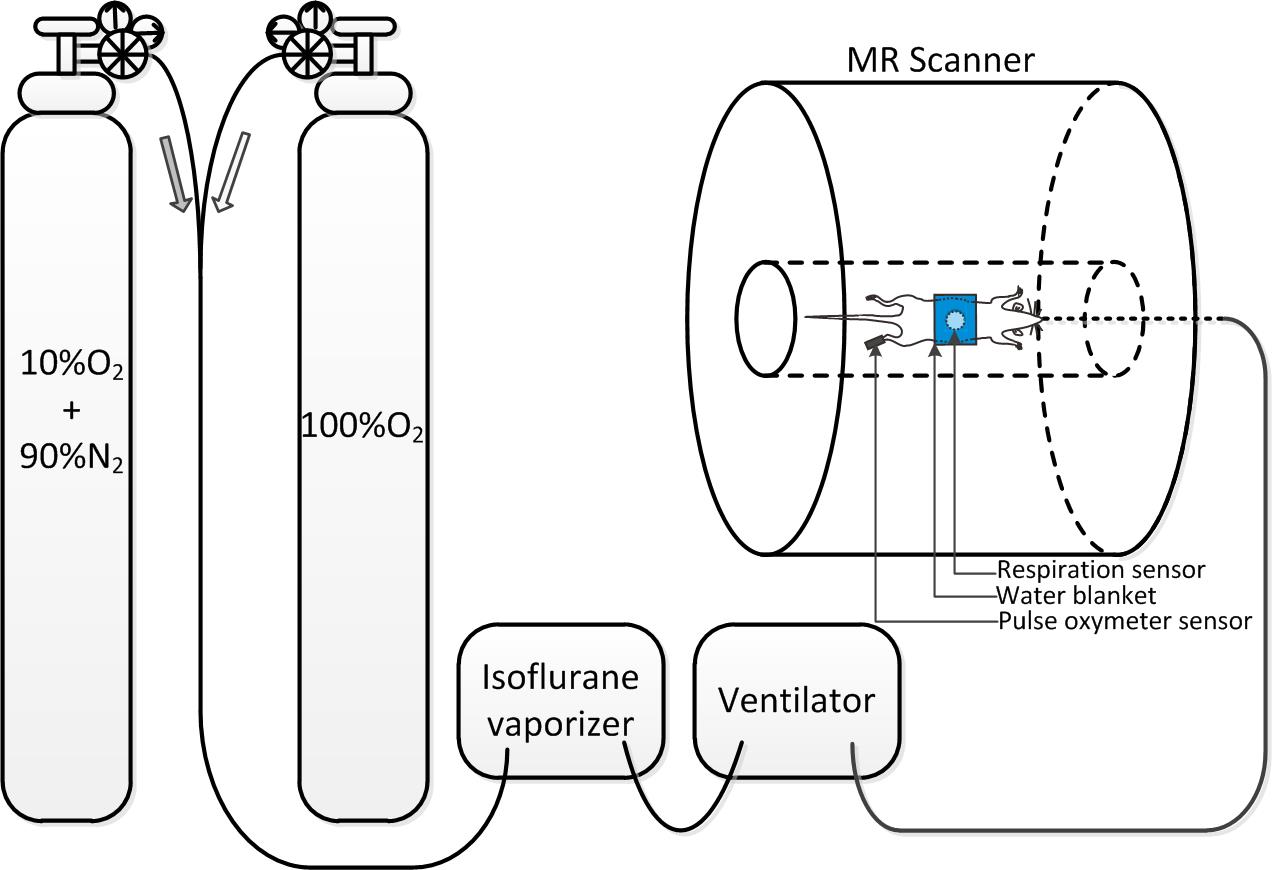
This study was approved by local Ethics Review Board. Eleven healthy male SD rats (220~250g) were involved in the present study. All the experiments were performed on a Bruker 7T animal scanner with a volume coil for signal excitation and a cardiac coil for signal detection. Spoiled multi-echo gradient-echo(SPGE) sequence was used for dynamic BOLD(dBOLD) imaging with following parameters: TR = 40ms, TE/ΔTE/maxTE=2/2/32ms, flip angle = 15 degree, slice number = 1, slice thickness = 1 mm, FOV = 40×55 mm2,matrix size= 80×110. The rats were intubated and mechanical ventilated by a ventilator during the MR scan (Fig.1), the temporal resolution of dBOLD was maintained relatively constant approximately 9 seconds (triggered).
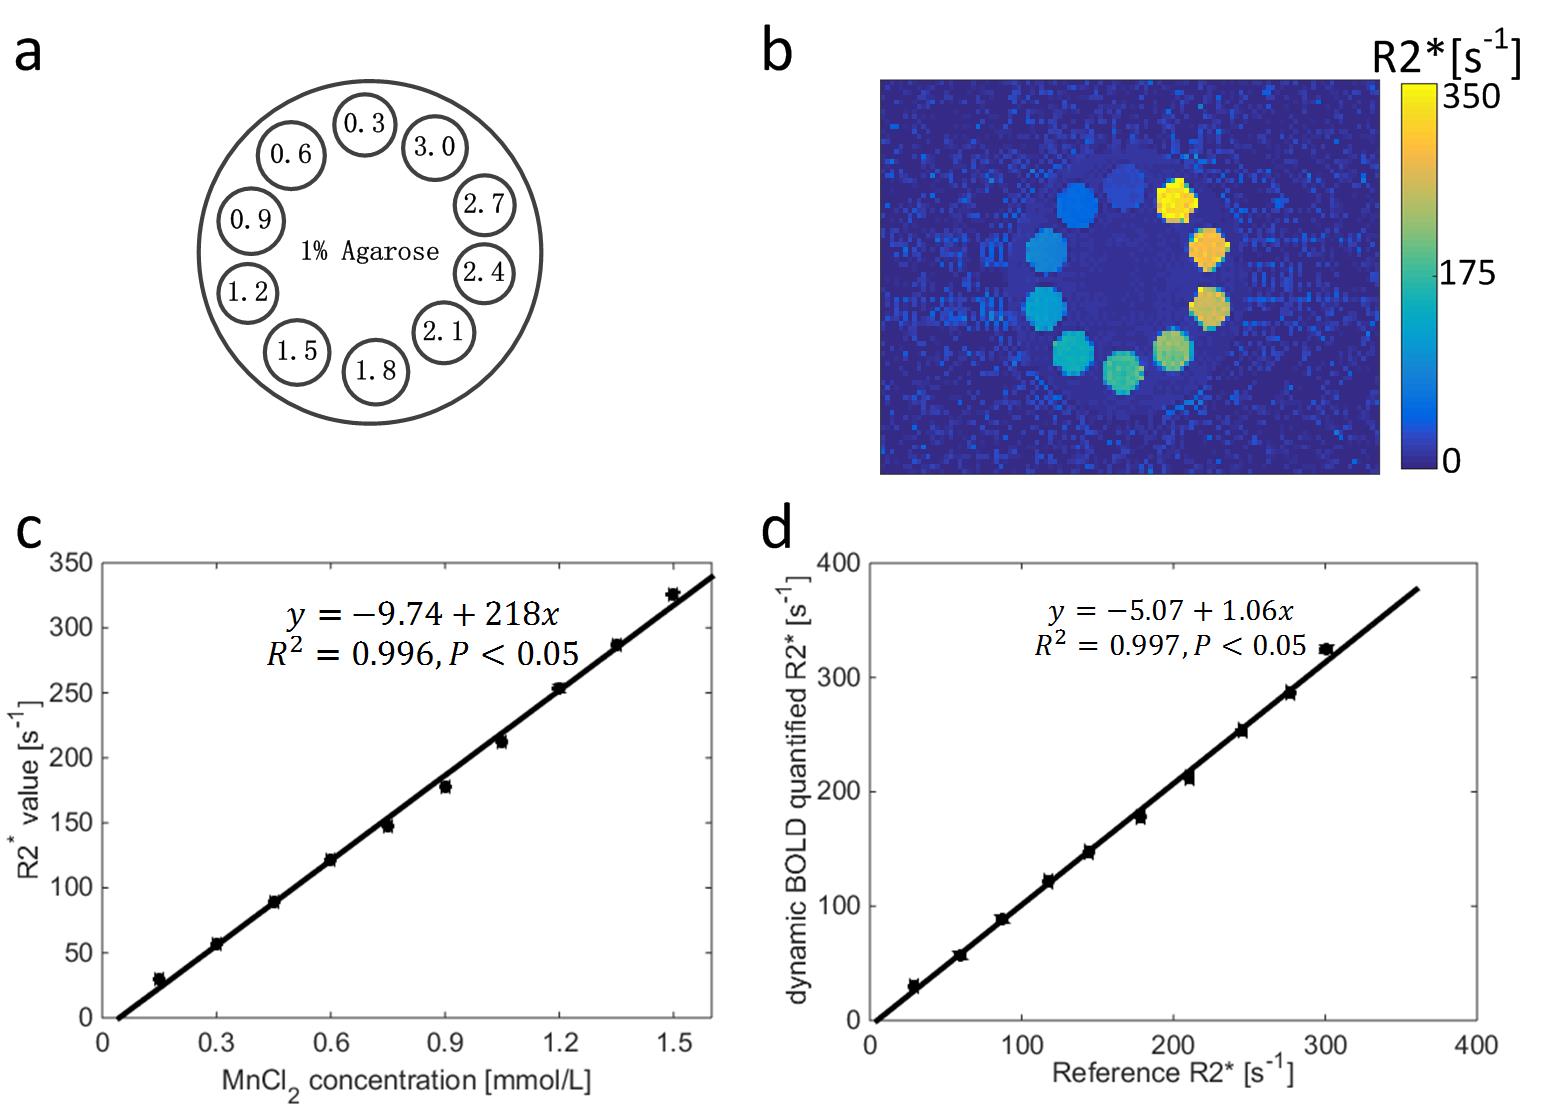
Phantom validation:
A phantom filled with different concentration of MnCl2 solution was scanned to validate the accuracy of dBOLD in T2* quantification. The concentration of MnCl2 solution linearly varied from 0.15 mmol/L to 1.5 mmol/L with increments of 0.15mmol/L. To mimic conventional renal MRI scan, the dBOLD scan on the phantom was triggered by respiratory signal from one intubated rat which was placed out of the MR bore, and 10 timeframes were obtained. A reference SPGE sequence which has longer TR, longer maxTE and without using respiration trigger, was also used for comparison.
Animal study:
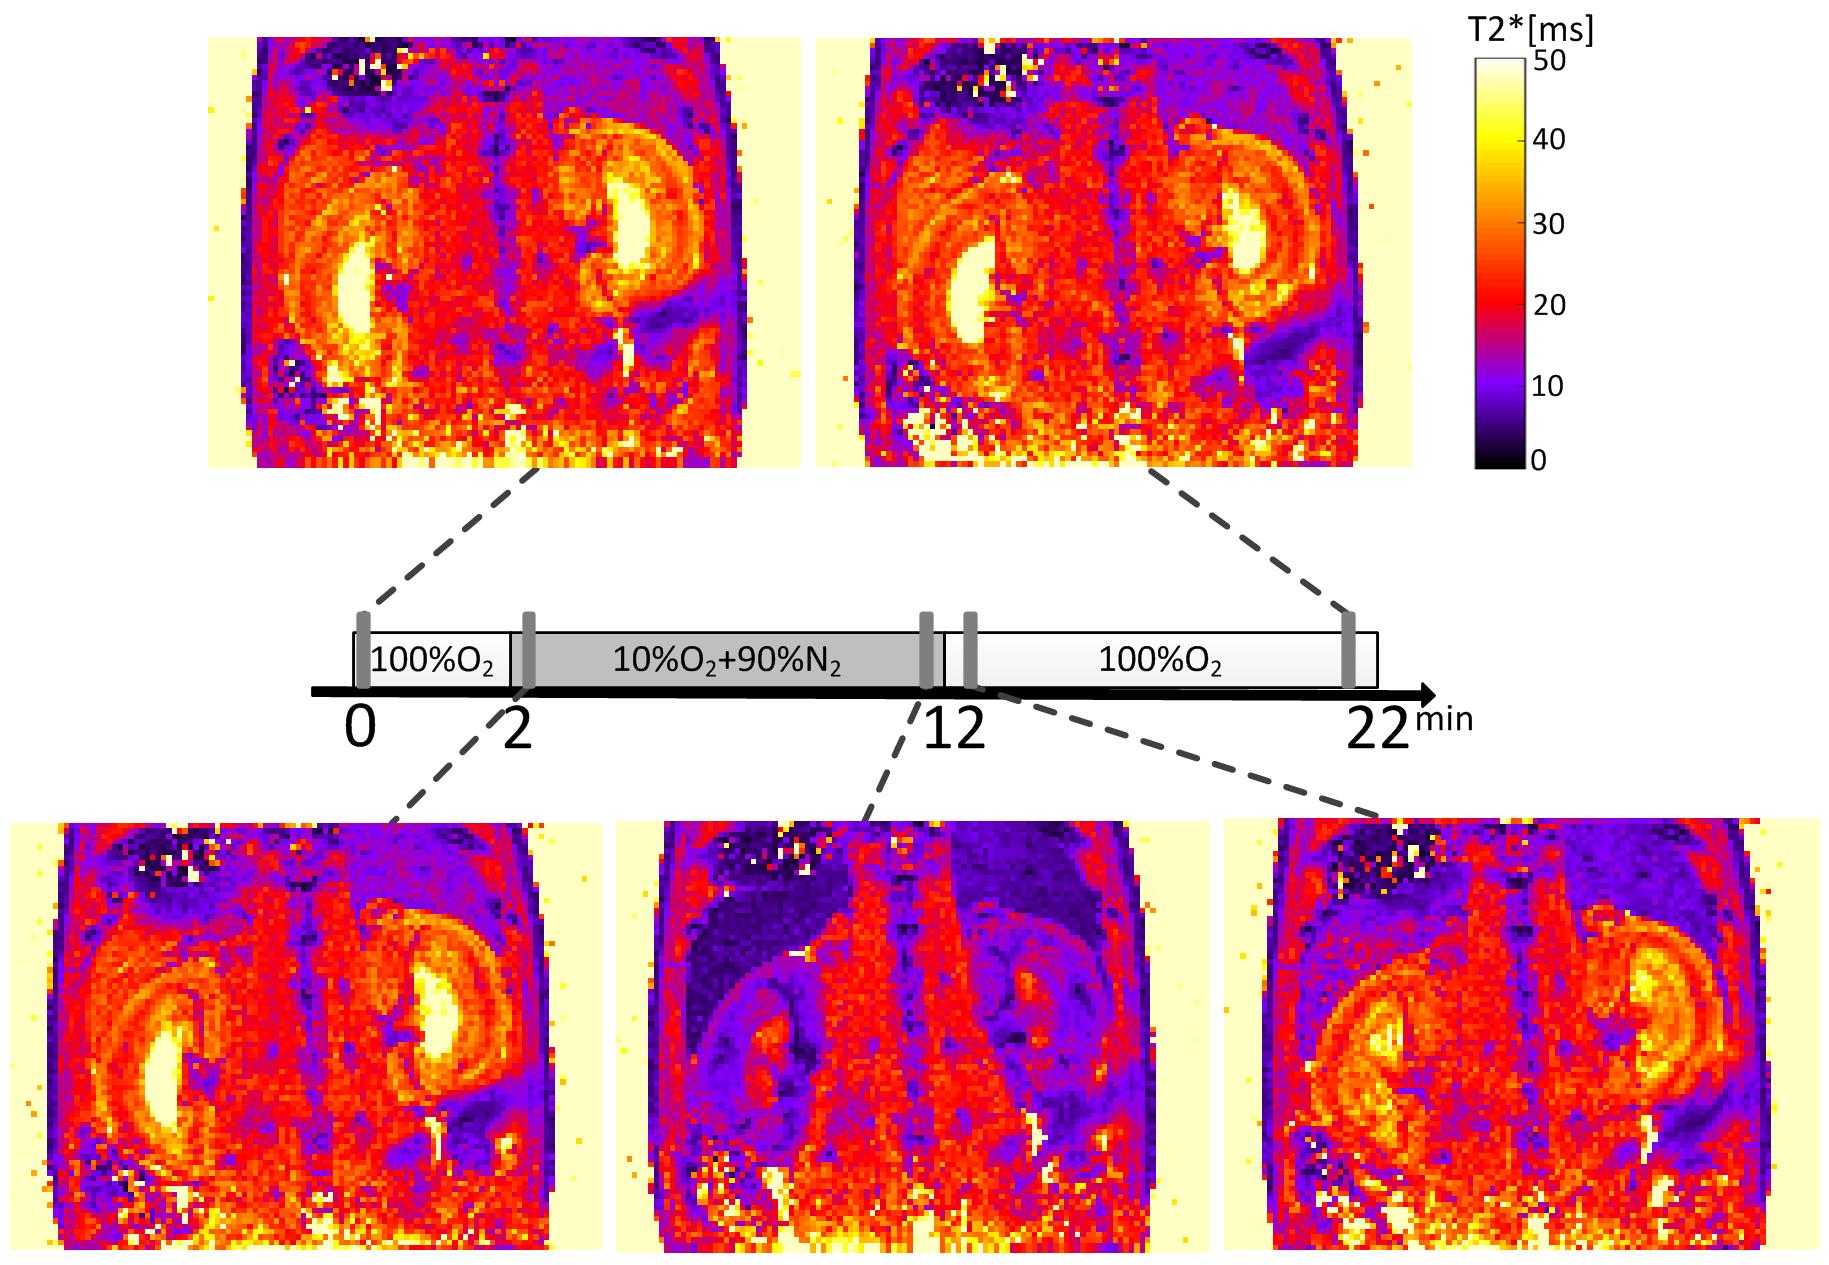
Ten rats were involved in the in vivo study. After the localization, the rat was delivered with 2 minutes hyperoxic gas, followed by 10 minutes hypoxic gas and finally by 10 minutes hyperoxic gas (Fig.3). dBOLD was simultaneously performed to track renal oxygen changes, and 140 timeframes were obtained.
Data analysis:
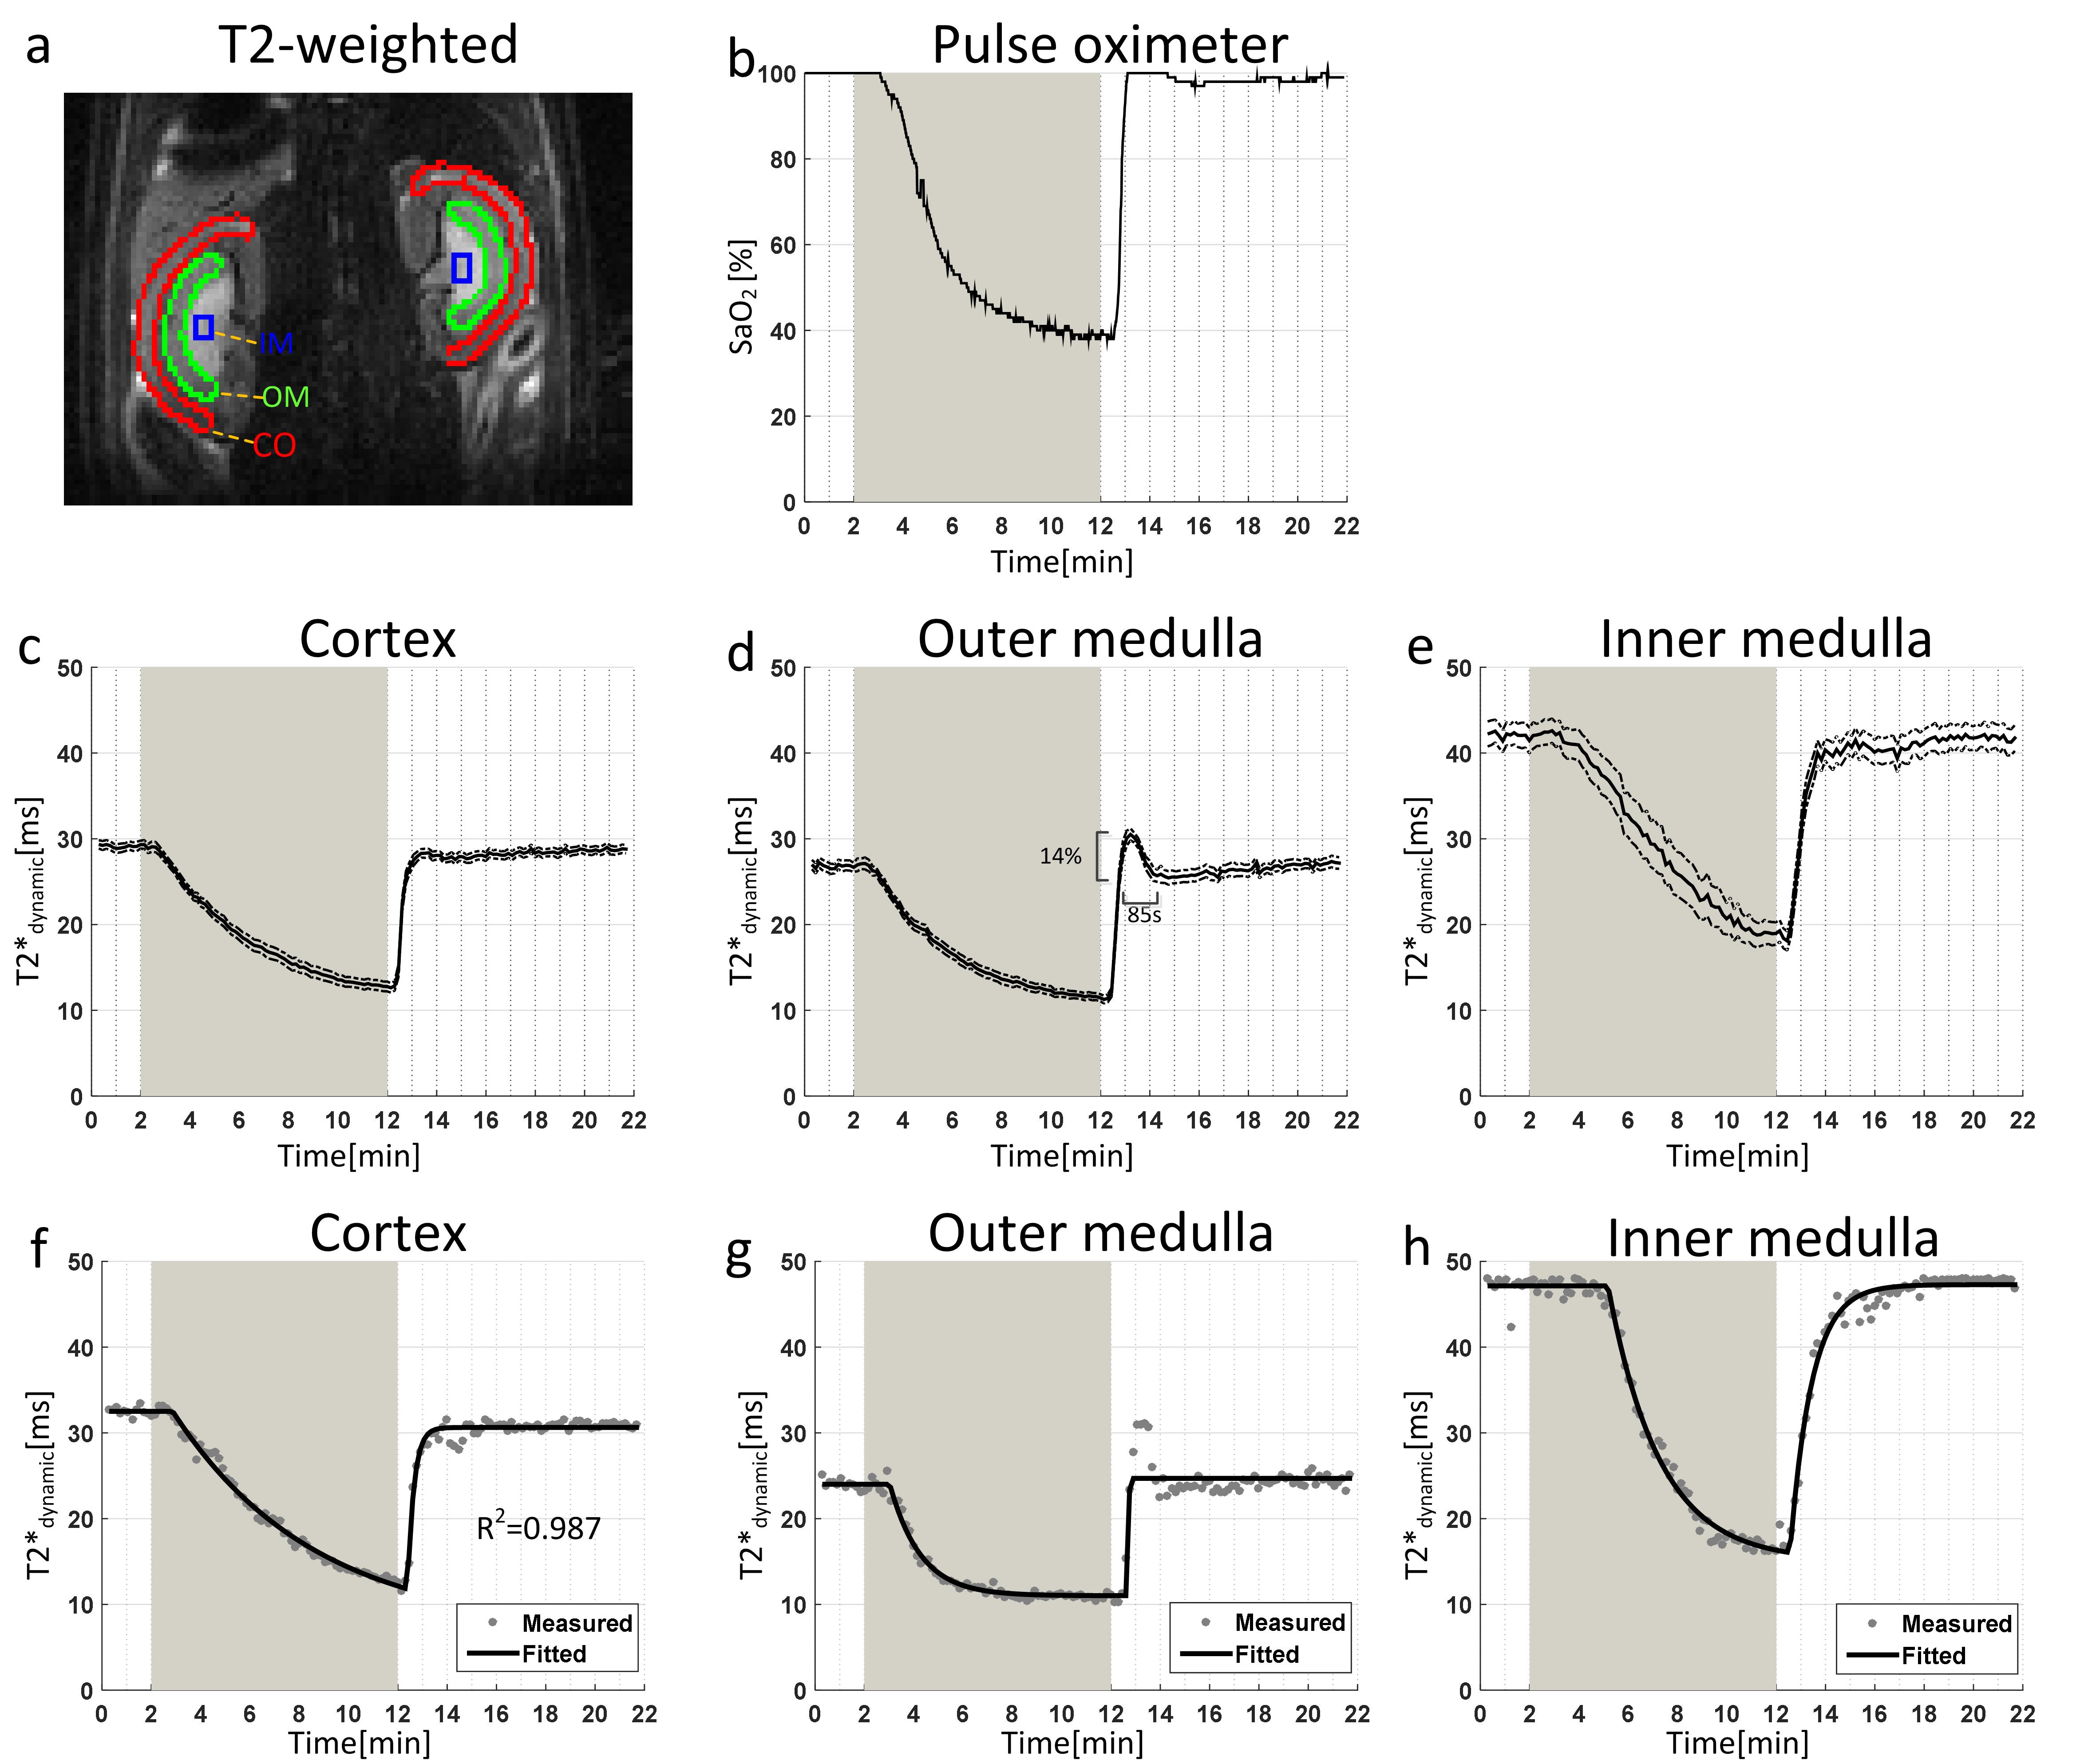
T2*(R2* = 1/T2*) maps were generated by mono-exponential fitting on signal intensity vs. echo time. The mean T2* within ROIs of renal cortex(CO), outer medulla(OM) and inner medulla(IM) were plotted along 140 timeframes separately. The T2* curve was characterized by piece-wise mono-exponential model as:
$$T2^{*}(t)=\left\{\begin{matrix}T2_{ref1}^{*},t<2+D_{dec}\\ A_{dec}(e^{-\frac{t-2-D_{dec}}{T _{dec}}}-1)+T2_{ref1}^{*},2+D_{dec}\leq t\leq 12+D_{rec}\\ -A_{rec}e^{-\frac{t-12-D_{rec}}{T _{ rec}}}+T2_{ref2}^{*},t> 12+D_{ rec}\end{matrix}\right.$$
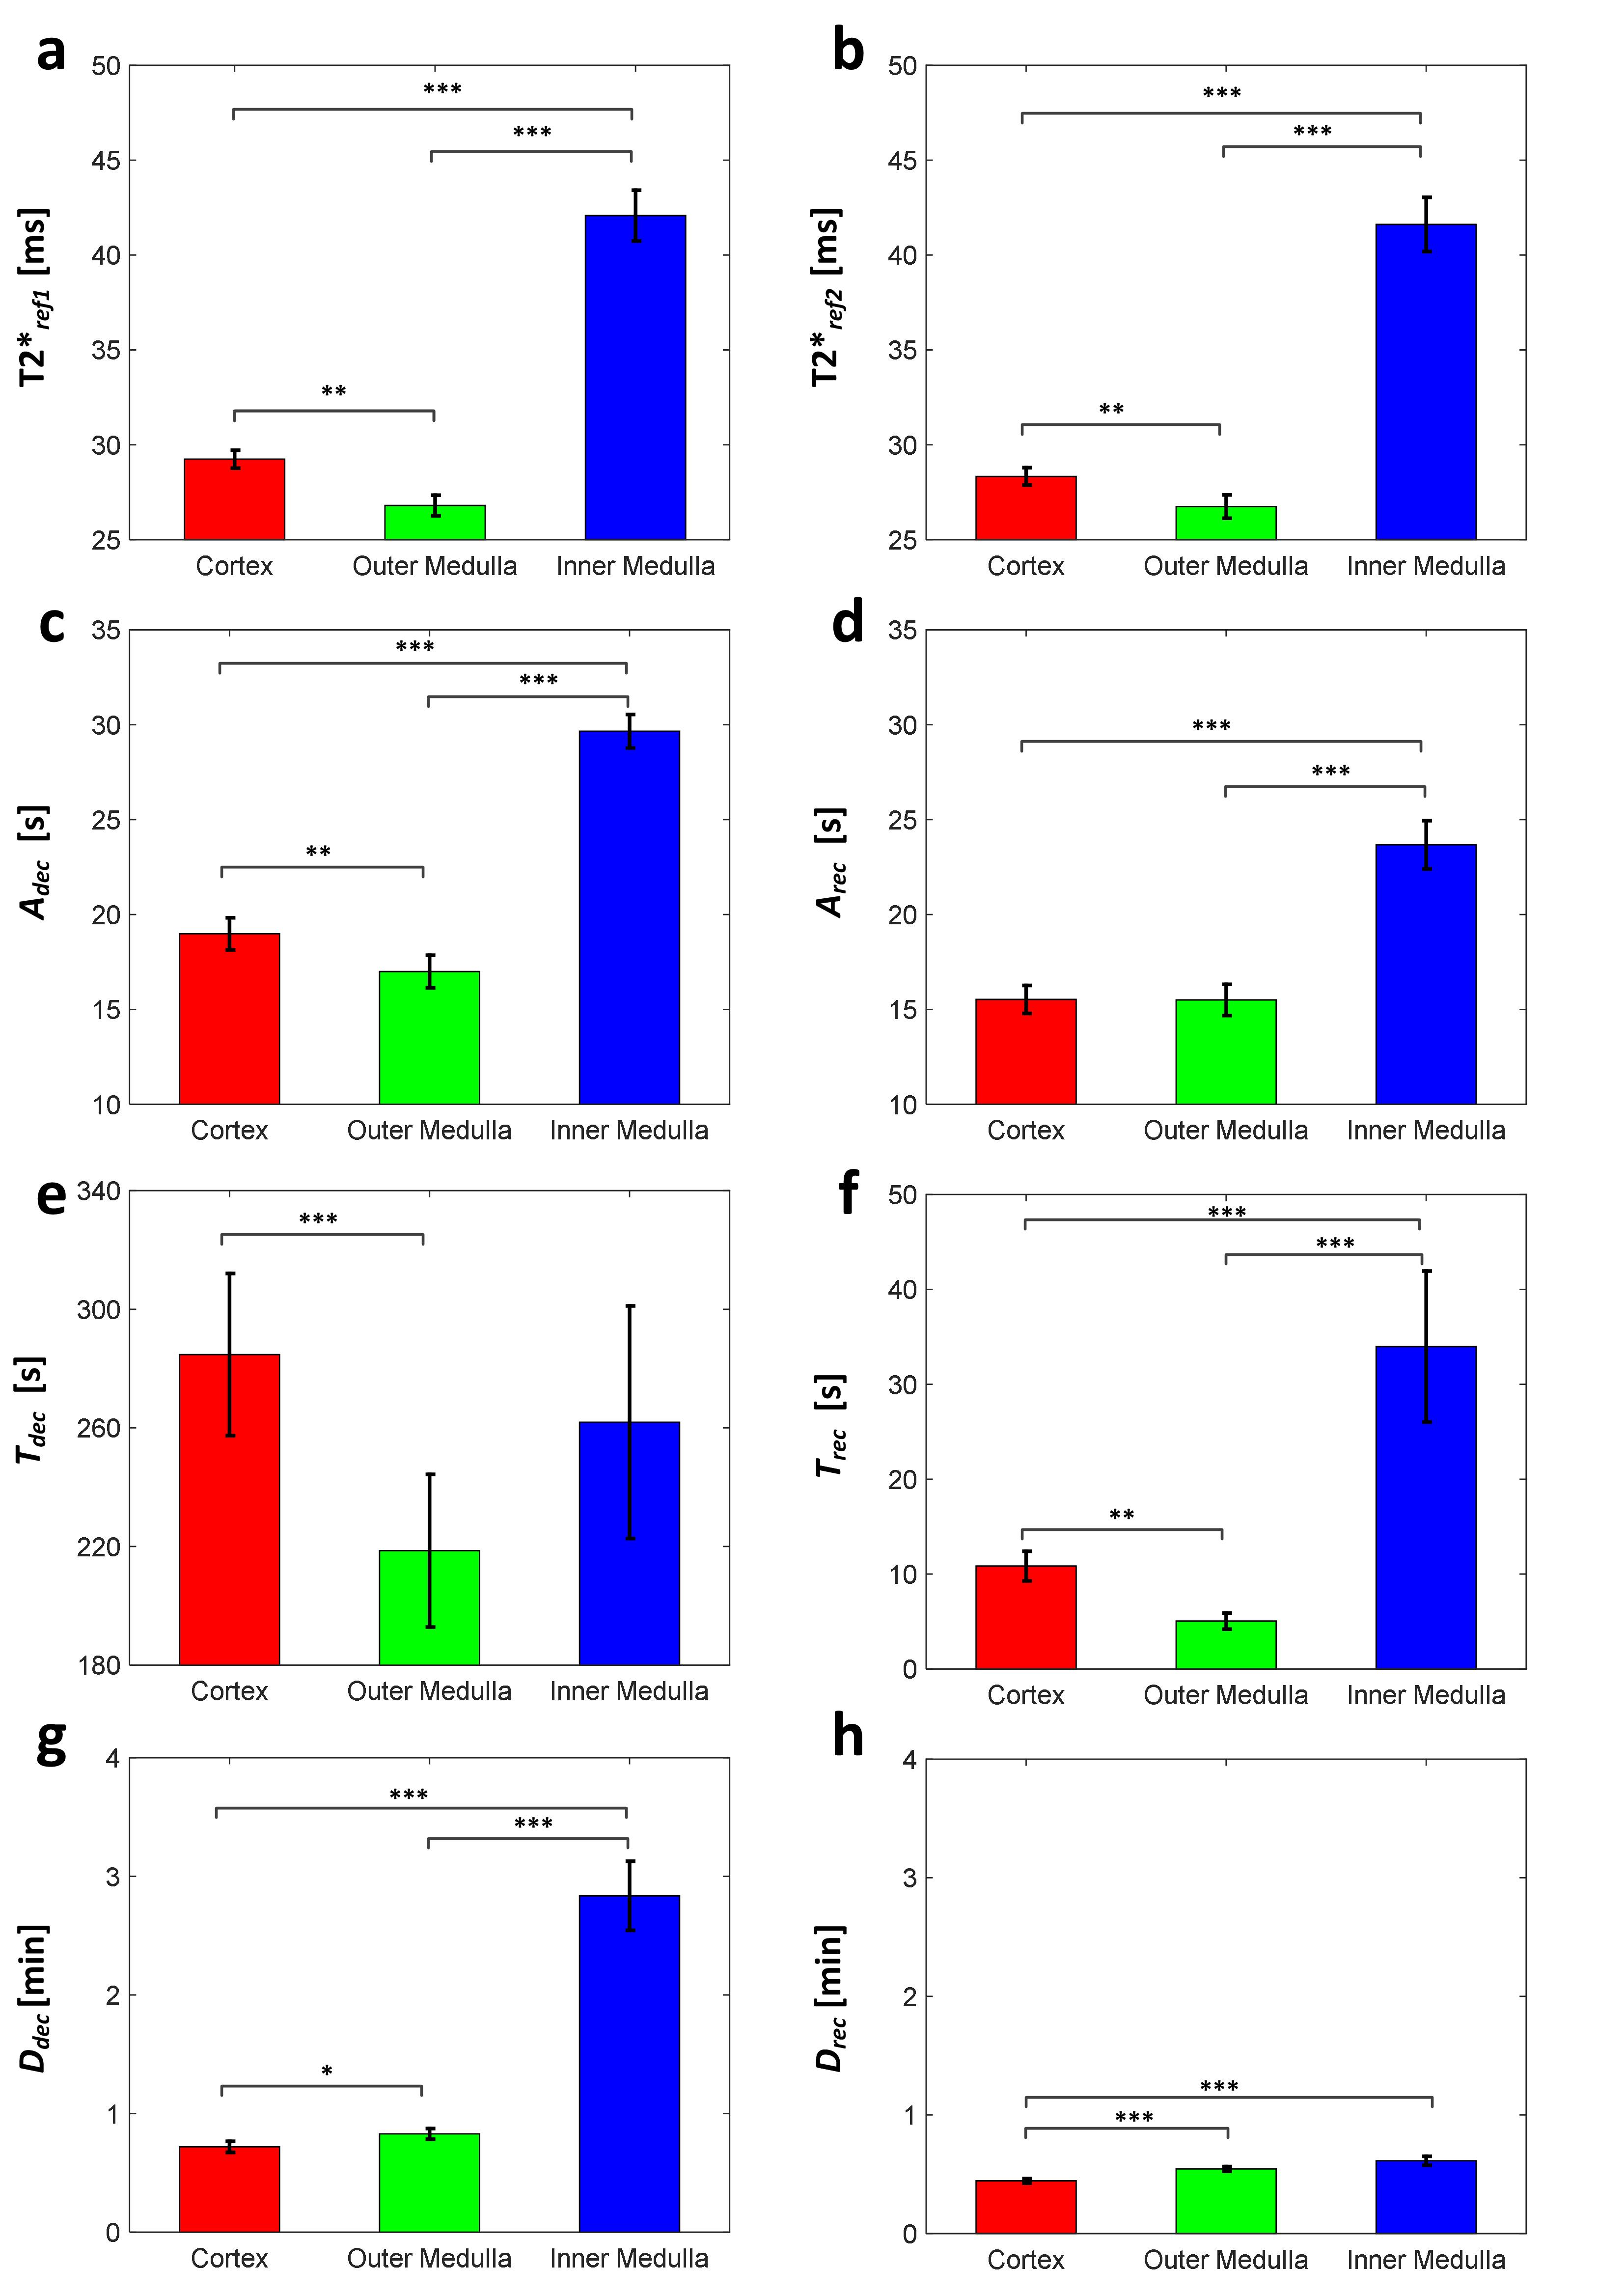
where T2*ref1 and T2*ref2 denote the steady state T2* at the initial and end stage of gas challenge respectively. Adec and Arec denote the amplitude of exponential decay and recovery curve respectively. Tdec and Trec denote the time constant of exponential decay and recovery curve respectively. Ddec and Drec denote the time delay of T2* decay and recovery respectively. Curve fitting was performed on Matlab by using Levenberg-Marquardt optimization7. Fitting quality was indicated by the coefficient of determination R2. Images with strong artifacts were excluded in post-analysis. The quantified model parameters were multiple compared among the CO, OM and IM by non-parametric Wilcoxon test on SPSS. P-value below 0.05 are considered statistically significant.
RESULTS:
Fig.2 shows the results of phantom experiments. The dBOLD quantified R2* is linearly correlated with MnCl2 concentration, with the R-square = 0.996. Fig.3 shows the gas challenge schedule and five representative T2* maps at typical time-point, including the initial steady state, initial stage of hypoxia, end stage of hypoxia, initial stage of re-oxygenation and end stage of re-oxygenation. In Fig.4, c-e show the summarized dynamic T2* curve(mean±SEM averaged over 10 rats). With the hypoxic gas inhalation, renal T2* gradually decreased to a steady state in all renal interlayers, thereafter, with the hyperoxic gas inhalation, renal T2* rapidly increased to a steady state in all renal interlayers. Significant overshoot in OM was observed at the initial stage of re-oxygenation. f-h show the representative curve fitting of proposed model on dynamic T2* curve. Fig.5 shows the comparison of quantified model parameters between CO, OM and IM.DISCUSSION&CONLUSION:
This work revealed dynamic BOLD response of renal tissues in response to interleaved hypoxia and hyperoxia in healthy rats. Distinct dynamic T2* curve and significantly difference of quantified model parameters among CO, OM and IM were observed. The results are consistent with clinical findings8. The interpretation of the overshoot in OM required further investigation.Acknowledgements
NoReferences
1.Prasad PV, Edelman RR, Epstein FH. Noninvasive evaluation of intrarenal oxygenation with BOLD MRI. Circulation 1996;94(12):3271-3275.
2.Pohlmann A, Hentschel J, Fechner M, Hoff U, Bubalo G, Arakelyan K, Cantow K, Seeliger E, Flemming B, Waiczies H, Waiczies S, Schunck WH, Dragun D, Niendorf T. High temporal resolution parametric MRI monitoring of the initial ischemia/reperfusion phase in experimental acute kidney injury. PloS one 2013;8(2):e57411.
3.Ganesh T, Estrada M, Duffin J, Cheng HL. T2* and T1 assessment of abdominal tissue response to graded hypoxia and hypercapnia using a controlled gas mixing circuit for small animals. Journal of magnetic resonance imaging : JMRI 2016;44(2):305-316.
4.Basile DP, Anderson MD, Sutton TA. Pathophysiology of acute kidney injury. Comprehensive Physiology 2012;2(2):1303-1353.
5.Verma SK, Molitoris BA. Renal endothelial injury and microvascular dysfunction in acute kidney injury. Seminars in nephrology 2015;35(1):96-107.
6.Paller MS, Neumann TV. Reactive oxygen species and rat renal epithelial cells during hypoxia and reoxygenation. Kidney Int 1991;40(6):1041-1049.
7.Marquardt DW. An Algorithm for Least-Squares Estimation of Nonlinear Parameters. Journal of the Society for Industrial and Applied Mathematics 1963;11(2):431-441.
8.Epstein FH. Oxygen and renal metabolism. Kidney Int 1997;51(2):381-385.
Figures