1214
Image contrast at 0.55T1Cardiovascular Branch, Division of Intramural Research, National Heart, Lung, and Blood Institute, National Institutes of Health, Bethesda, MD, United States, 2Systems Biology Center, Division of Intramural Research, National Heart, Lung, and Blood Institute, National Institutes of Health, Bethesda, MD, United States, 3Laboratory of Functional Molecular Imaging, Division of Intramural Research, National Institute of Neurological Disorders and Stroke, National Institutes of Health, Bethesda, MD, United States
Synopsis
In addition to having cost advantages, low-field MRI may offer new imaging opportunities by virtue of the physical attributes. Here we report T1, T2 and T2* tissue parameters and contrast agent relaxivities for a custom high performance 0.55T MRI system. We found that T1 was 29% shorter at 0.55T compared 1.5T, whereas T2 was lengthened by 33% and T2* was lengthened by 54% at 0.55T. Marketed small molecular weight gadolinium-based contrast agents demonstrate similar relaxivity at 0.55T and 1.5T, indicating similar dosing requirements, and larger molecular complex agents had increased T1 relaxivity at 0.55T, indicating potential advantages at low-field.
Introduction
MRI system performance has significantly improved in the last two decades through magnet design, shielded gradient systems, phased array receiver coils, and sophisticated image reconstructions. In light of this contemporary system engineering, we sought to evaluate a high-performance low field (0.55T) MRI system.
New clinical avenues may be afforded by low field MRI due to its physical attributes. For example, the reduced RF power allows MRI for patients otherwise ineligible because of metallic implants and enables MRI guided interventions using commercially available conductive devices. The low magnetic field susceptibility enables imaging of previously inaccessible anatomy, including the lungs, airway, intestines and cranial sinuses. Finally, both endogenous contrast agents such as oxygen and exogenous large contrast agents with long correlation times, on the order of the Larmor frequency, have improved relaxation properties.
Here, we characterize a prototype high-performance 0.55T MRI system by reporting tissue T1, T2 and T2*, and relaxivity of clinical and experimental contrast agents.
Methods
A conventional 1.5T MRI system (MAGNETOM Aera, Siemens Healthcare, Erlangen, Germany) was modified to operate at 0.55T with maintained gradient performance (maximum amplitude = 45 mT/m, maximum slew rate = 200 T/m/s).
Human subjects imaging was approved by our local institutional review board. To characterize field homogeneity, B0 maps of the human head were generated using gradient echo imaging (TE = 4ms, 10ms) and B1 maps were obtained using a saturated double-angle method. T1, T2 and T2* relaxation parameters were calculated for a variety of tissues in healthy volunteers (n = 9 brain, n = 14 thorax, n = 13 abdomen).
Relaxivity parameters (r1 and r2) were quantified at 0.55T at room temperature for both clinical and experimental contrast agents diluted in phosphate-buffered saline.
As exploratory examples of contrast enhanced imaging at 0.55T, clinical GBCA (gadolinium based contrast agents) were used for imaging of pathology at 0.55T with standard dosing (0.1mmol/kg or 0.15mmol/kg off-label use for cardiac applications) and ferumoxytol was used for angiography in a swine experiment.
Results
As expected, the relative B0 variation (in ppm) due to susceptibility was independent of field strength (0.29ppm at 0.55T vs. 0.31ppm at 1.5T, whole head averaged), but the absolute perturbation (in Hz) scaled linearly (7.21Hz at 0.55T vs. 18.63Hz at 1.5T, whole head averaged). Improvements compared to 1.5T were observed especially near the cranial sinuses, face and throat. Transmit B1 non-uniformities are usually problematic at 3T and above, and B1 field mapping demonstrated subtly improved relative flip angle uniformity at 0.55T in the human head (relative flip angle = 0.96±0.09 at 0.55T vs. 0.93±0.10 at 1.5T).
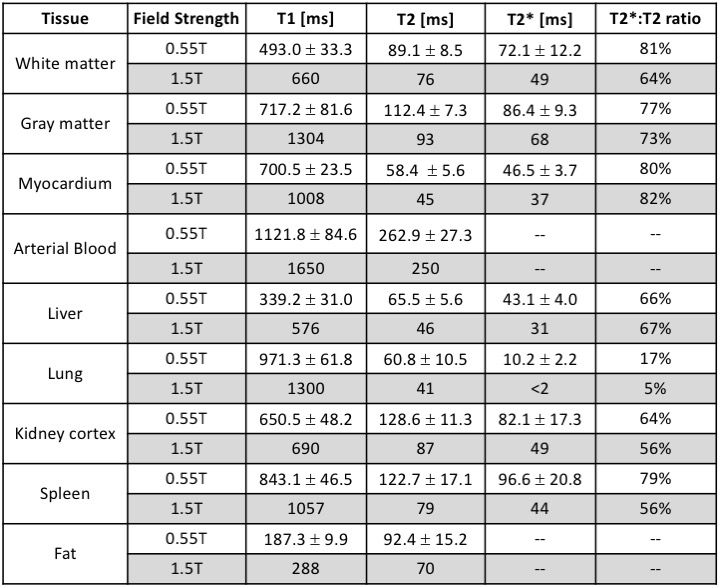
The measured relaxation parameters for various tissues are provided in Table 1 and compared to example literature 1.5T values [1-14]. On average, T1 was 29% shorter at 0.55T compared to conventional 1.5T system. T2 was lengthened by 33% and T2* was lengthened by 54% at 0.55T.
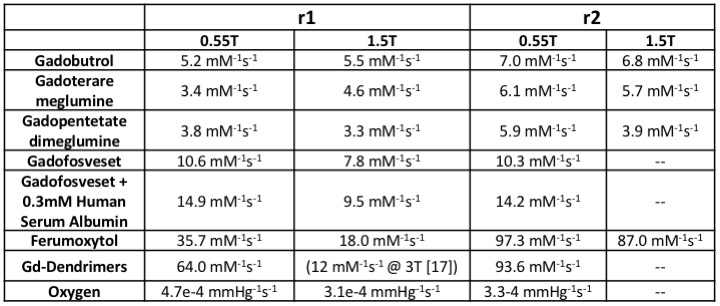
Relaxivity parameters for clinical and experimental contrast agents are given in Table 2. Marketed small molecular weight gadolinium-based contrast agents (GBCAs, eg. gadobutrol, gadoterare meglumine, gadopentetate dimeglumine) demonstrate similar relaxivity at 0.55T and 1.5T. Larger molecular complex agents (eg. ferumoxytol, gadofosveset and gadolinium dendrimers) had increased T1 relaxivity per Mole metal at 0.55T, as did molecular oxygen.
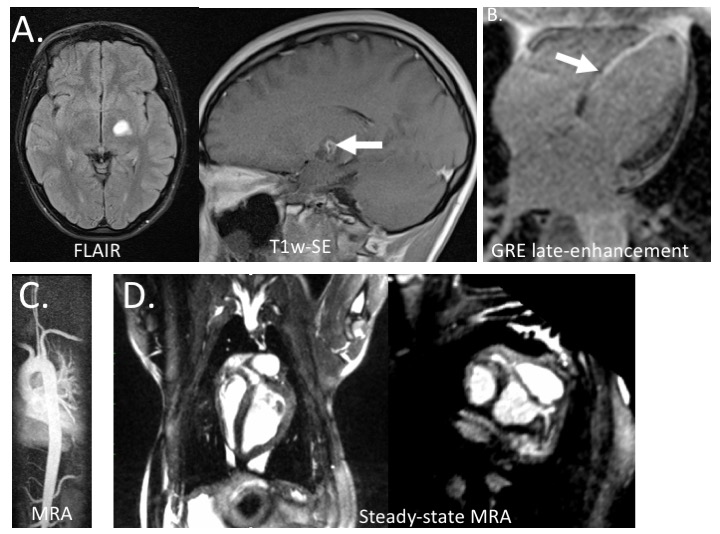
Standard dosing of GCBA (Dotarem, Guerbet, Villepinte, France) was successful for imaging brain tumor and myocardial infarction in patients (Figure 1A,B), and angiographic imaging in a volunteer (Figure 1C). Despite reduced SNR, images were of diagnostic quality. Based on the high relaxivity of ferumoxytol, a low dose (0.7 mgFe/kg) was used for angiography in a swine to depict cardiac chambers, large vessels and even coronary vessels (Figure 1D).
Discussion and conclusion
Our measured tissue relaxation parameters at 0.55T suggestion opportunities for sequence optimization. The shortened T1 relaxation is advantageous for imaging efficiency, and the lengthened T2 and T2* relaxation are advantageous for extending readouts contributing to recovered SNR. Here we compare our measured parameters to example literature values, however a literature survey revealed significant variability in the tissue T1, T2 and T2* values reported for 1.5T.
Despite the lower field, clinical GBCAs exhibit similar relaxivity, which is important because no increase in dosage is required. Large contrast agents with long correlation times, on the order of the Larmor frequency, have improved relaxation properties and may require reduced dose for angiography at low field. Potentially very important is that molecular oxygen also had increased relaxivity at low field [15, 16] providing a non-metal, physiologically relevant contrast agent that is superior at low field.
In addition to having cost advantages, low field may offer new MR imaging opportunities by virtue of its physical attributes. The high-performance low field system characterized here warrants further investigation in the context of modern clinical MRI.
Acknowledgements
This work was supported by the Division of Intramural Research, National Heart, Lung, and Blood Institute, National Institutes of Health, USA (Z1A-HL006213, Z1A-HL006214).References
- Vymazal, J., et al., T1 and T2 in the brain of healthy subjects, patients with Parkinson disease, and patients with multiple system atrophy: relation to iron content. Radiology, 1999. 211(2): p. 489-95.
- Stanisz, G.J., et al., T1, T2 relaxation and magnetization transfer in tissue at 3T. Magn Reson Med, 2005. 54(3): p. 507-12.
- Siemonsen, S., et al., Age-dependent normal values of T2* and T2' in brain parenchyma. AJNR Am J Neuroradiol, 2008. 29(5): p. 950-5.
- Kritsaneepaiboon, S., et al., The relationship between myocardial and hepatic T2 and T2* at 1.5T and 3T MRI in normal and iron-overloaded patients. Acta Radiol, 2018. 59(3): p. 355-362.
- Grassedonio, E., et al., Quantitative T2* magnetic resonance imaging for renal iron overload assessment: normal values by age and sex. Abdom Imaging, 2015. 40(6): p. 1700-4.
- Dabir, D., et al., Reference values for healthy human myocardium using a T1 mapping methodology: results from the International T1 Multicenter cardiovascular magnetic resonance study. J Cardiovasc Magn Reson, 2014. 16: p. 69.
- Carpenter, J.P., et al., On T2* magnetic resonance and cardiac iron. Circulation, 2011. 123(14): p. 1519-28.
- Baessler, B., et al., A systematic evaluation of three different cardiac T2-mapping sequences at 1.5 and 3T in healthy volunteers. Eur J Radiol, 2015. 84(11): p. 2161-70.
- Bottomley, P.A., et al., A review of normal tissue hydrogen NMR relaxation times and relaxation mechanisms from 1-100 MHz: dependence on tissue type, NMR frequency, temperature, species, excision, and age. Med Phys, 1984. 11(4): p. 425-48.
- Gold, G.E., et al., Musculoskeletal MRI at 3.0 T: relaxation times and image contrast. AJR Am J Roentgenol, 2004. 183(2): p. 343-51.
- Deoni, S.C., B.K. Rutt, and T.M. Peters, Rapid combined T1 and T2 mapping using gradient recalled acquisition in the steady state. Magn Reson Med, 2003. 49(3): p. 515-26.
- de Bazelaire, C.M., et al., MR imaging relaxation times of abdominal and pelvic tissues measured in vivo at 3.0 T: preliminary results. Radiology, 2004. 230(3): p. 652-9.
- Schwenzer, N.F., et al., T2* relaxometry in liver, pancreas, and spleen in a healthy cohort of one hundred twenty-nine subjects-correlation with age, gender, and serum ferritin. Invest Radiol, 2008. 43(12): p. 854-60.
- Treibel,
T.A., et al., Automatic Measurement of
the Myocardial Interstitium: Synthetic Extracellular Volume Quantification
Without Hematocrit Sampling. JACC Cardiovasc Imaging, 2016. 9(1): p. 54-63.
- Dietrich, O., T. Gaass, and M.F. Reiser, T1 relaxation time constants, influence of oxygen, and the oxygen transfer function of the human lung at 1.5T-A meta-analysis. Eur J Radiol, 2017. 86: p. 252-260.
- Mirhej, M.E., Proton Spin Relaxation By Paramagnetic Molecular Oxygen. Canadian Journal of Chemistry, 1965. 43(5): p. 1130-1138.
- Opina, A.C., et al., Preparation and long-term biodistribution studies of a PAMAM dendrimer G5-Gd-BnDOTA conjugate for lymphatic imaging. Nanomedicine (Lond), 2015. 10(9): p. 1423-37.
Figures