1213
A Biophysical Model of Iron-Induced Relaxation in Human Substantia Nigra for Early Stage Parkinson Diagnostic1Department of Neurophysics, Max Planck Institute for Human Cognitive and Brain Sciences, Leipzig, Germany, 2Faculty of Physics and Earth Sciences, Leipzig University, Leipzig, Germany, 3Paul Flechsig Institute of Brain Research, Leipzig, Germany, 4Center for Cognitive Neuroscience Berlin, Freie Universität Berlin, Berlin, Germany
Synopsis
We present a biophysical model that quantitatively describes gradient and spin echo relaxation in substantia nigra induced by iron accumulated the neuromelanin of dopaminergic neurons. This model was informed by 3D quantitative microscopic iron distributions obtained from classical histology and Proton-Induced X-ray Emission. It was validated by comparison to quantitative MRI on post mortem human brain tissue. We demonstrate that the total iron content of DN can be extracted analytically from relaxometry in nigrosomes. This results provides an important step toward a highly desired early stage biomarker for detecting dopaminergic neurons depletion in Parkinson's disease.
Introduction
The
depletion of dopaminergic neurons (DN) in nigrosome 1 (N1) in
substantia nigra (SN) precedes first motor symptoms of Parkinson's
disease (PD) by two decades.1,2
Methods capable of monitoring DN depletion at an early stage
have the potential to accelerate PD diagnosis.3
Pronounced MR contrast induced by iron accumulated in neuromelanin in
DN4 renders
MRI particularly suitable for this task.5
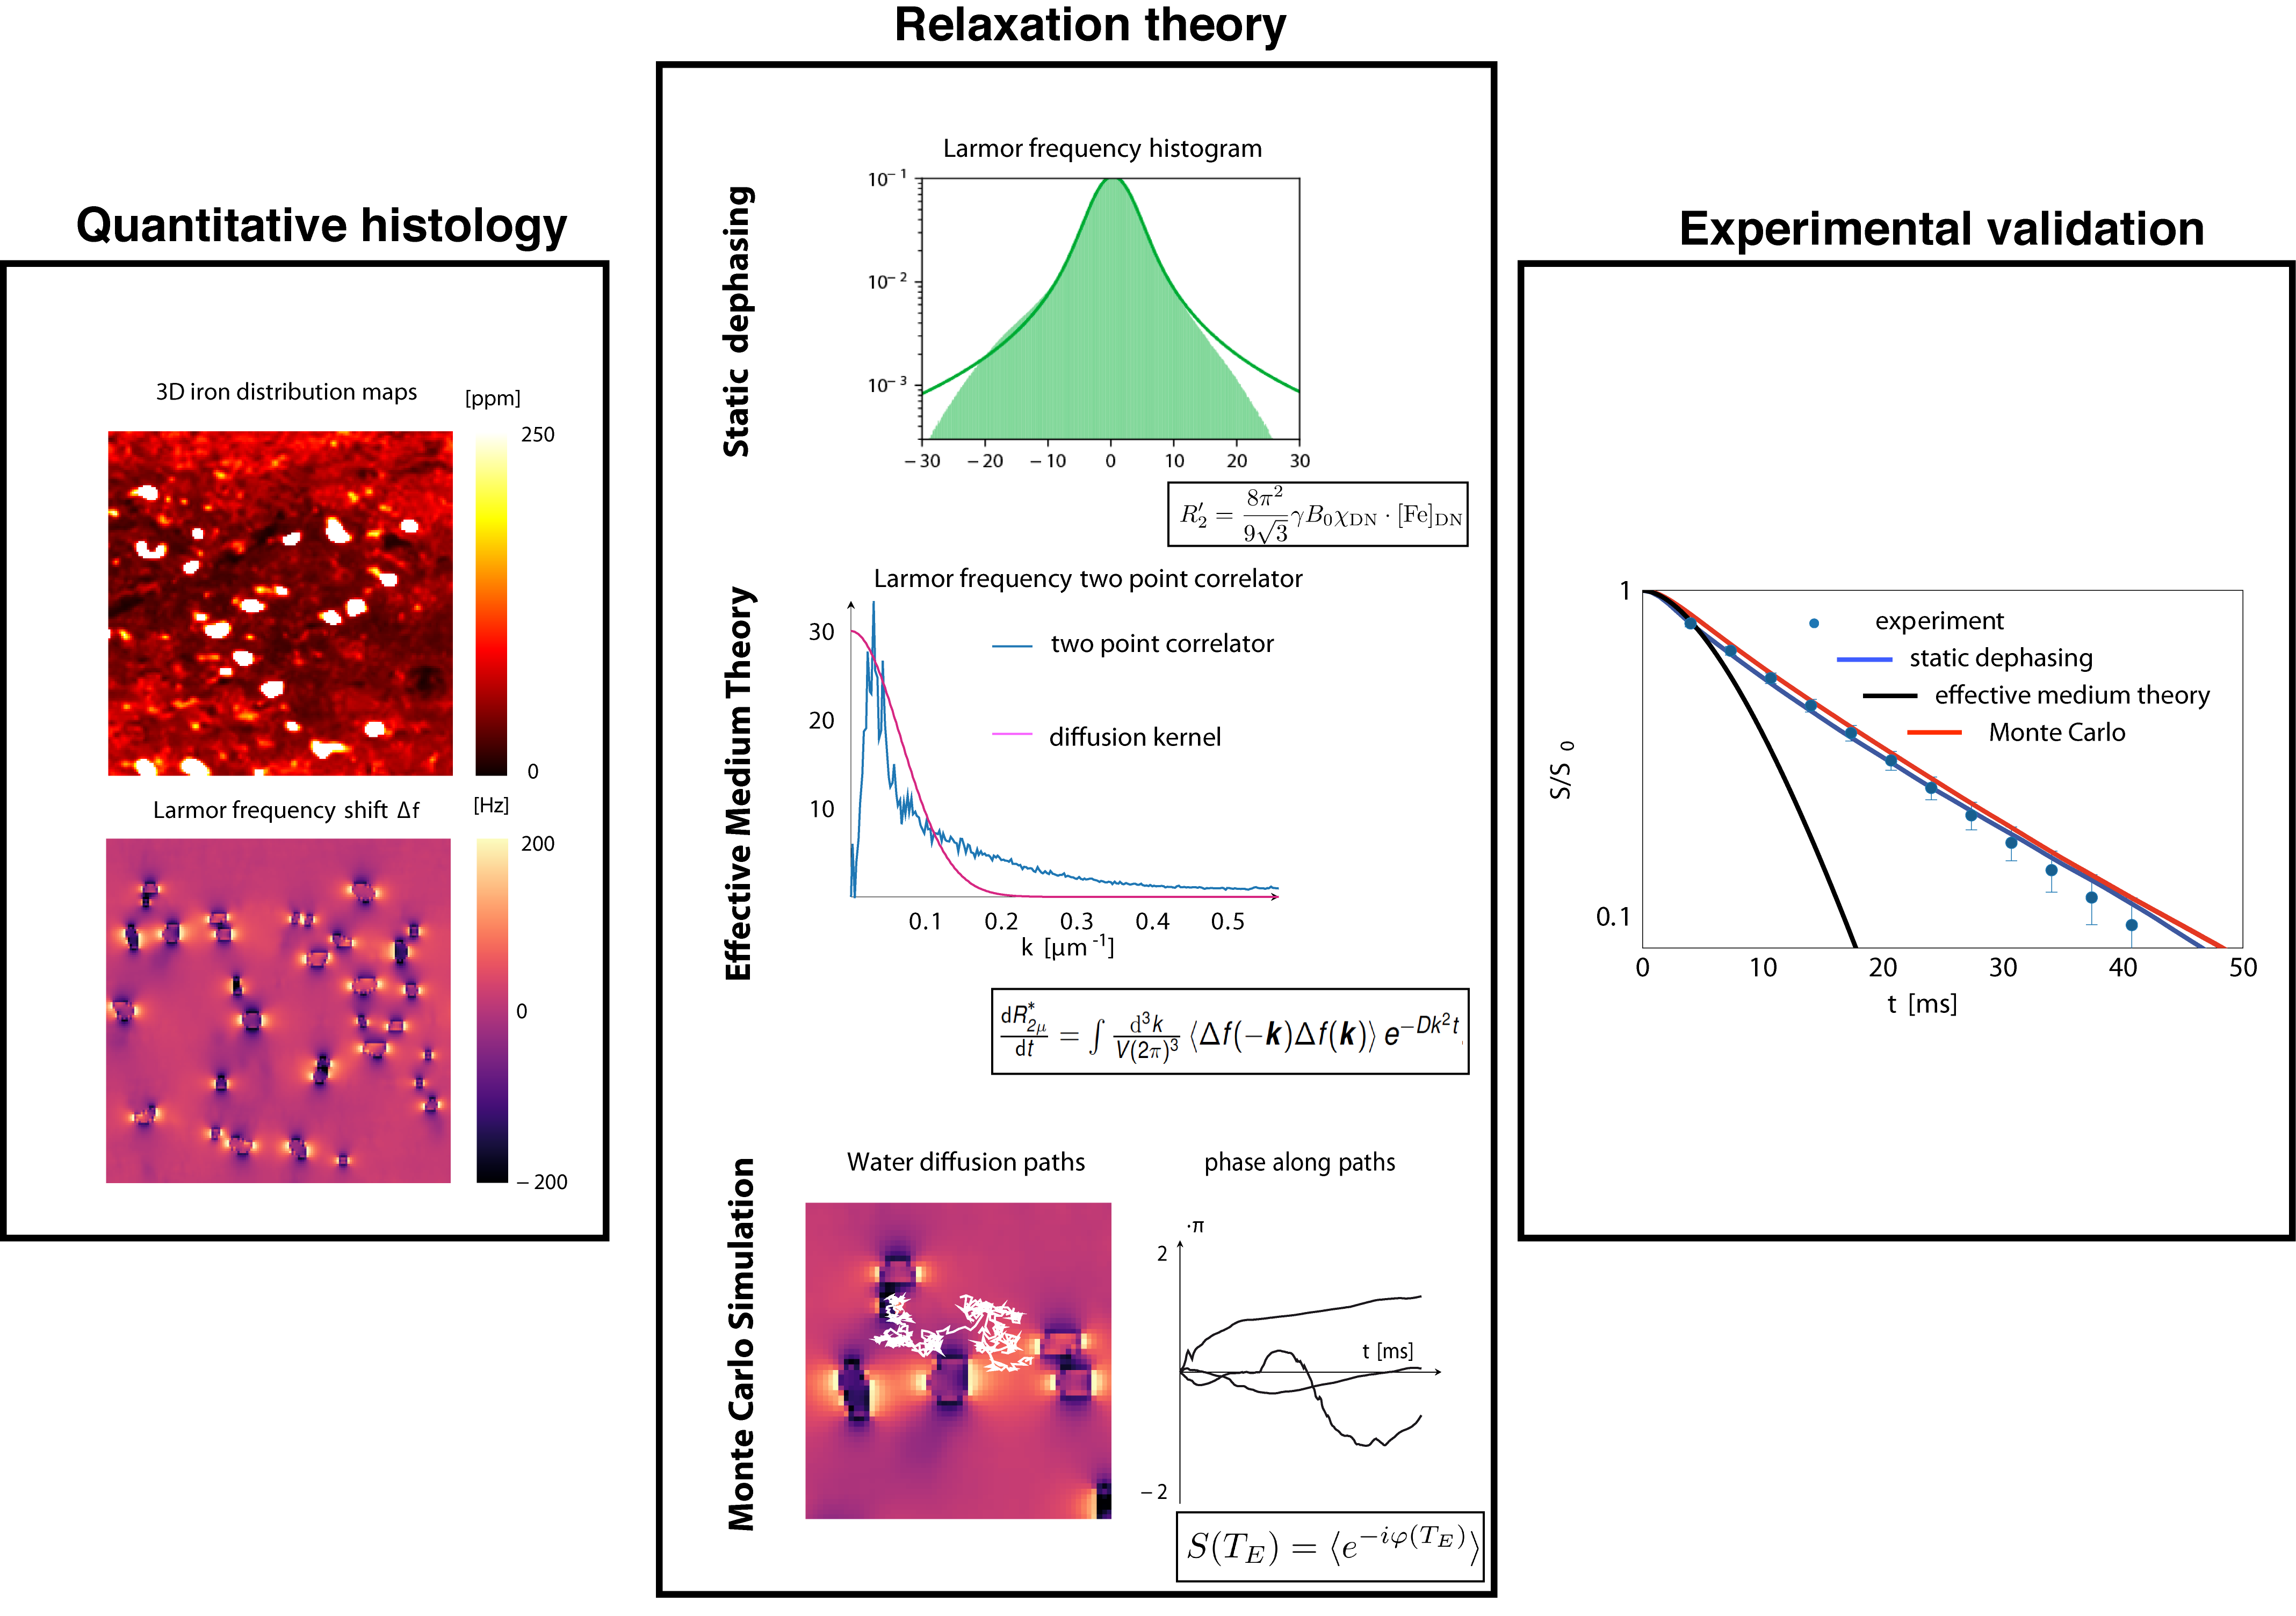
A quantitative link between the iron-induced relaxation rates R2 and R2* and neuropathological changes in N1 requires a profound theoretical understanding of relaxation mechanisms. Several approaches, including static dephasing (SD)6 and effective medium theory (EMT),7 have been proposed to describe transverse relaxation in tissue.8 Their predictive power depends on the underlying tissue’s iron distribution, its water diffusion coefficient, and the static magnetic field strength.
We present a biophysical model that quantitatively describes relaxation in gradient and spin echo MRI experiments of SN induced by DN. This model was informed by 3D quantitative microscopic iron distributions obtained from classical histology and Proton-Induced X-ray Emission (PIXE). It was validated by comparing model predictions to quantitative MRI on post mortem human brain tissue.
Methods
Six
human post mortem specimen containing SN were immersion-fixed in 4%
paraformaldehyde in phosphate buffered saline. Quantitative MRI
measurements were performed at 7T (Magnetom 7T, Siemens Healthineers,
Erlangen). R2* was measured using 3D multi-echo FLASH (isotropic
resolution of 0.22mm, TE1...12=4...40ms,
TR=60ms); R2 maps were obtained from a 2D spin echo sequence (0.22mm
in-plane resolution, 0.6mm slice thickness, TE1...6=11,...,83ms).
Ultra-high resolution T2*-weighted images (T2*WI) were acquired using
3D FLASH (isotropic resolution of 50µm, TE=20 ms, TR=180ms) to achieve
co-registration with histology. Diffusion tensor imaging (resolution
1mm, 6 diffusion directions, b=4000s/mm2)
was performed to estimate the apparent diffusion coefficient in fixed
post mortem tissue.
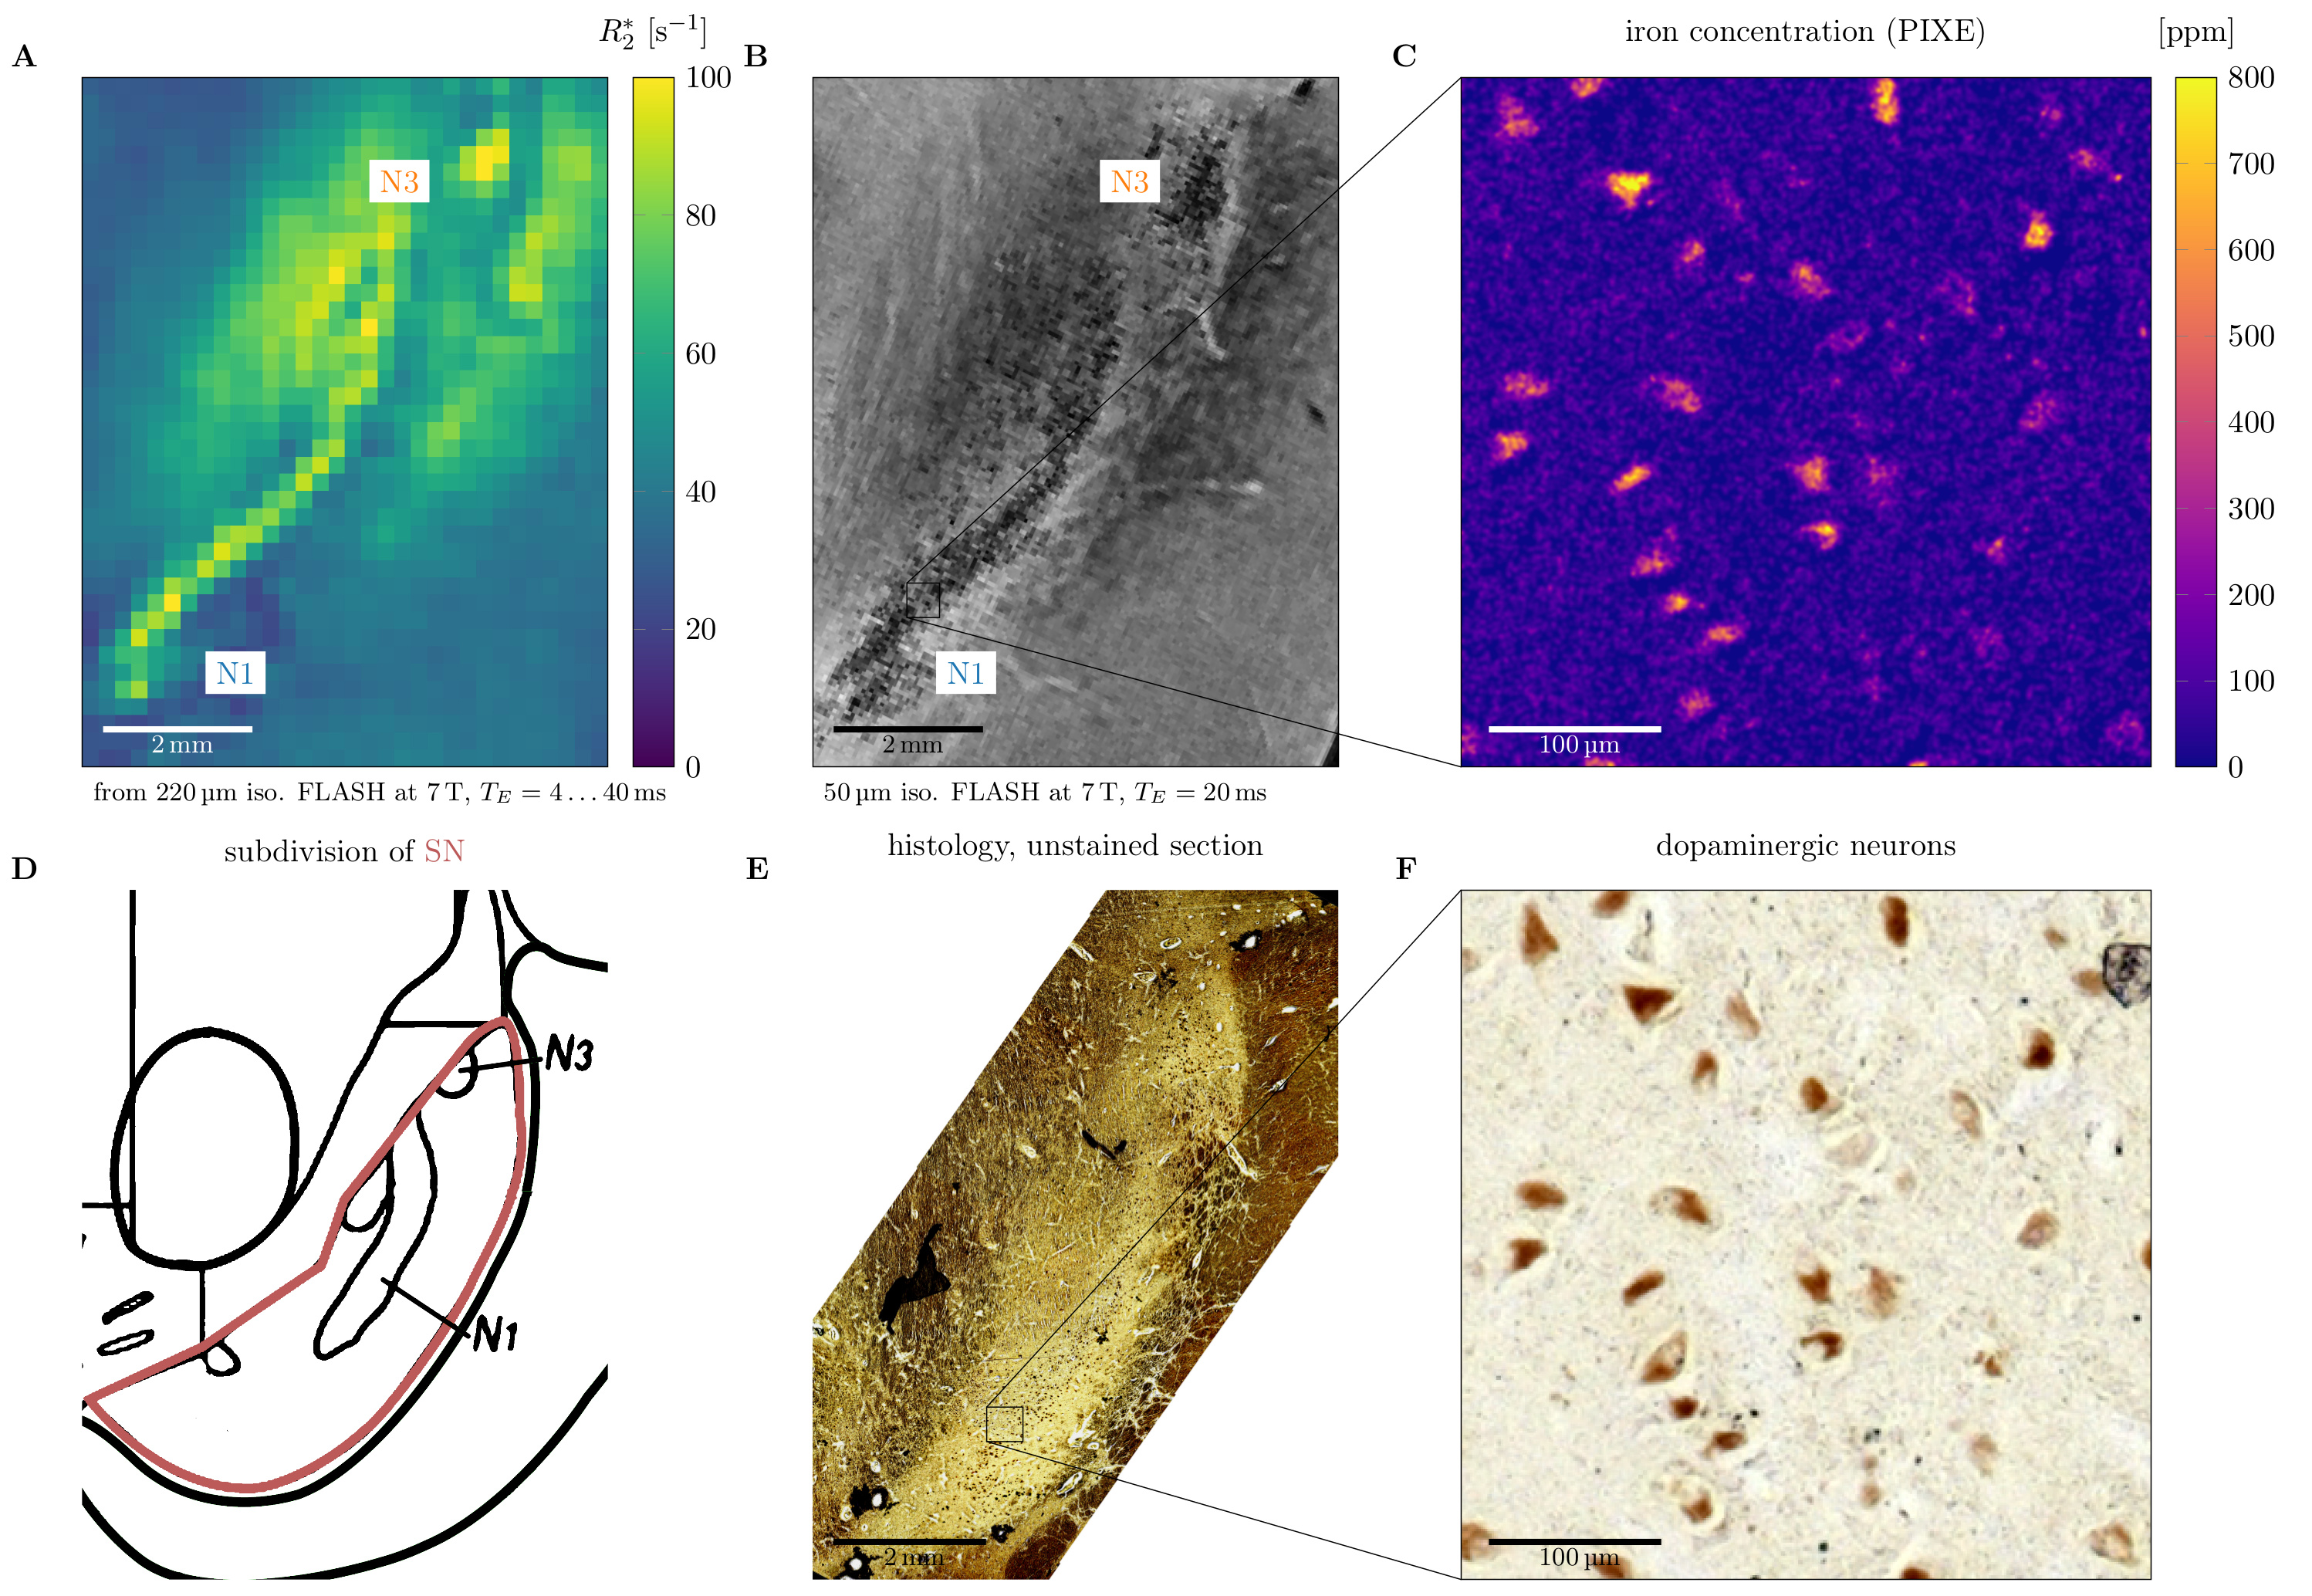
Quantitative microscopic iron maps in 3D were obtained combining Perls’ stain for iron and PIXE (Fig.1).9
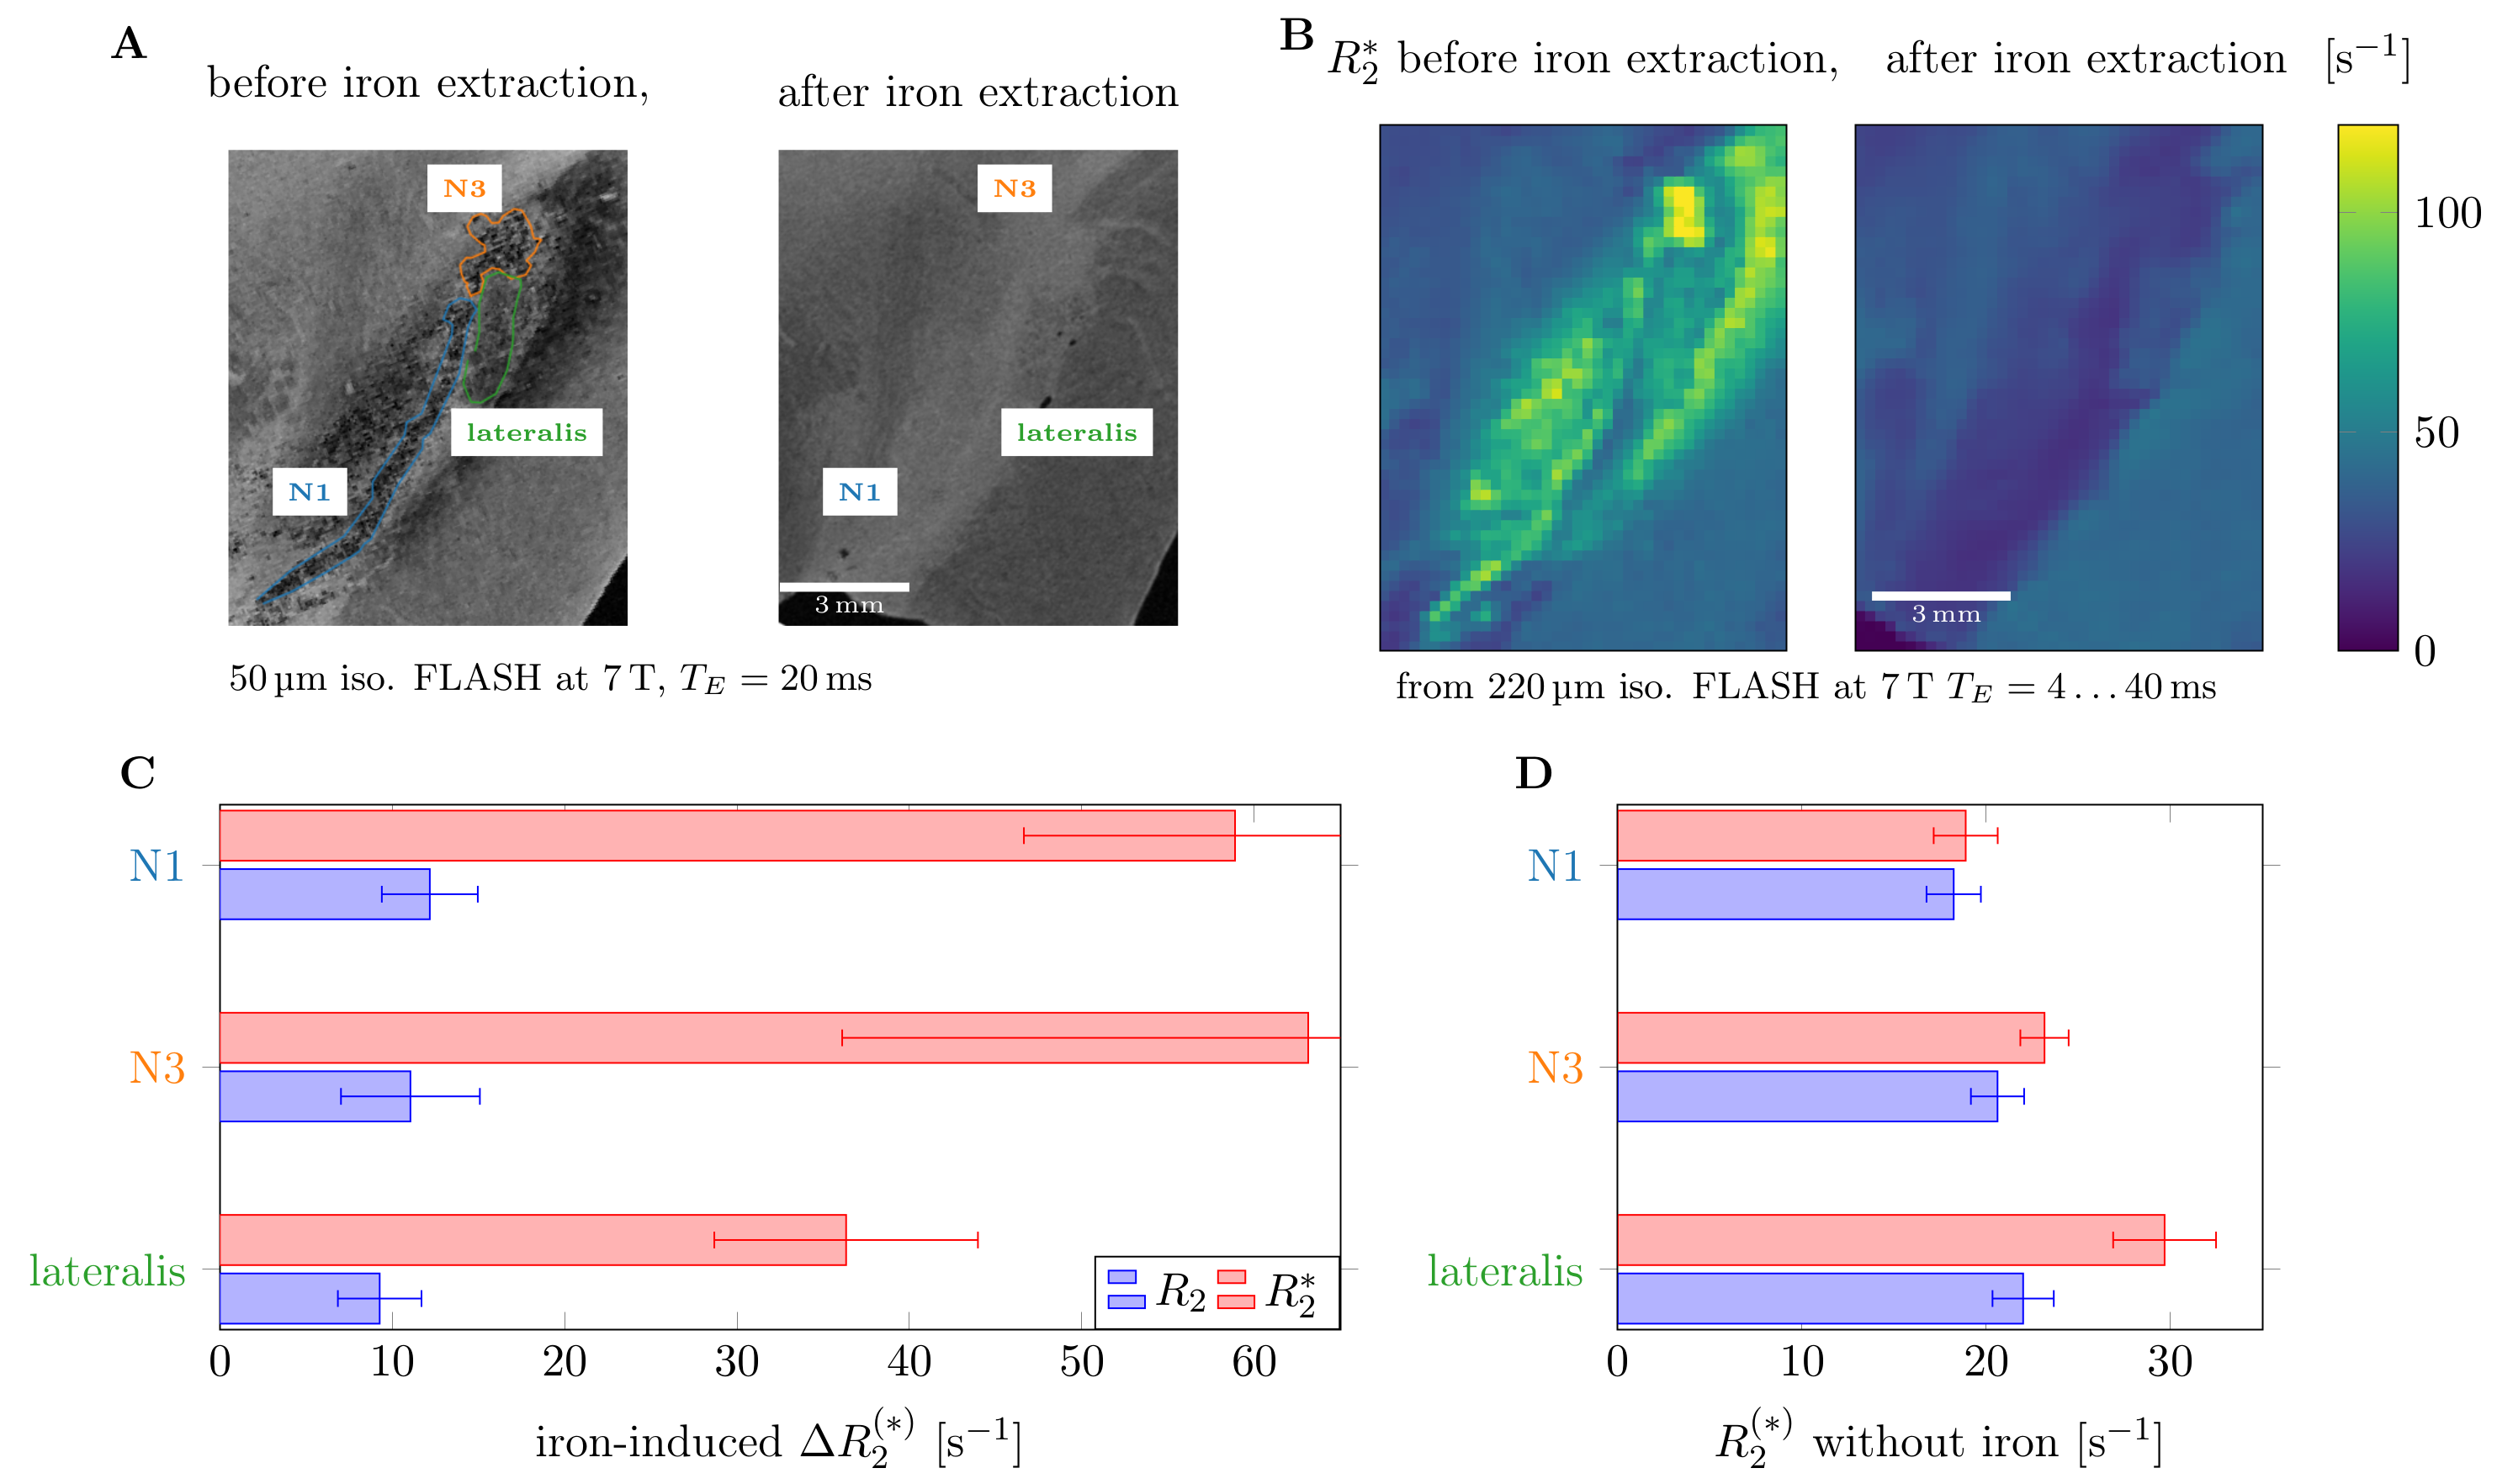
To quantify the impact of iron on R2 and R2* relaxation rates, one of the SN specimen was imaged before and after chemical iron extraction.10
Theory
Larmor
frequency shifts induced by the microscopic iron distributions within
the voxel were predicted
from 3D quantitative iron maps by scaling with the susceptibility of
ferritin11
outside and susceptibility of neuromelanin inside the DN (1.3
and 7.8 ppb/ppm iron in wet tissue weight, respectively) and
convolution with a dipole kernel (Fig.1).12
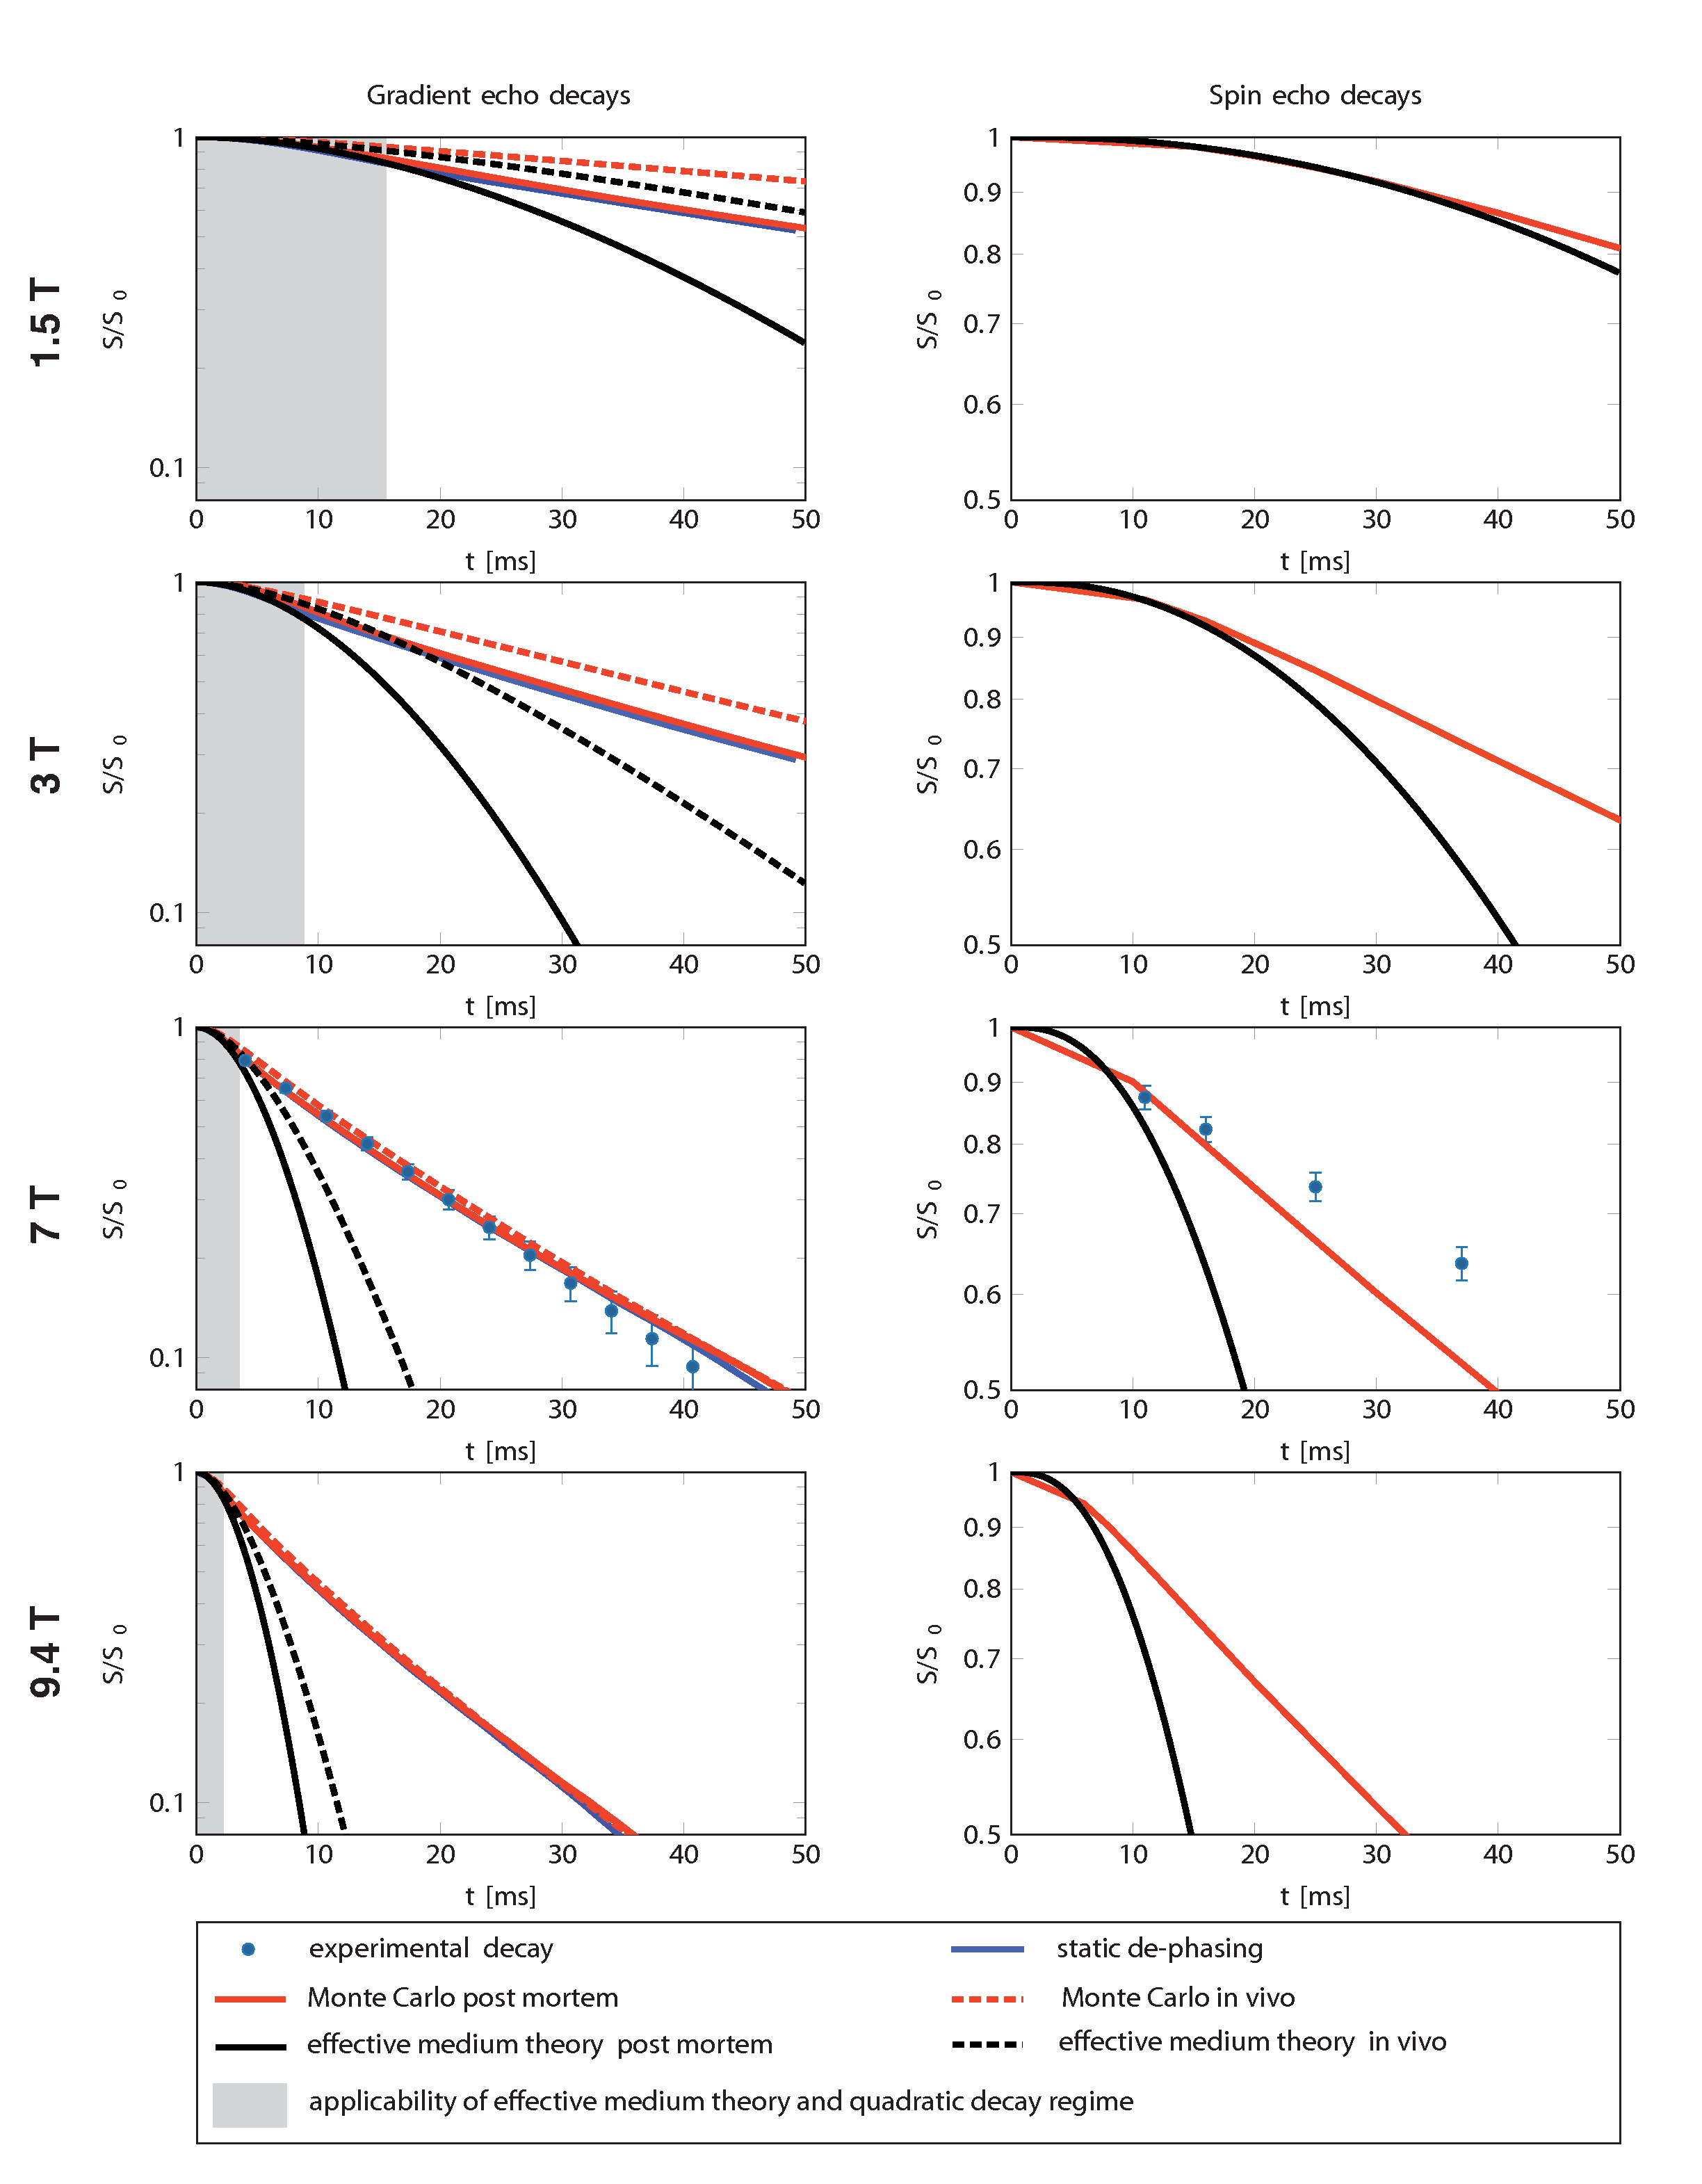
Three theoretical approaches applicable to real biological iron distribution were used to calculate iron-induced transverse relaxation rates at different field strengths in the presence of water diffusion: SD, EMT7 and Monte Carlo simulations (MC) (Fig.1).13 In SD, gradient echo decays were calculated from Larmor frequency shift histograms. In EMT, gradient and spin echo decays were predicted from spatial two-point correlators of the obtained susceptibility maps.14 MC was used to validate the applicability of the aforementioned theories. EMT and MC of gradient and spin echo decays were simulated for post mortem fixed tissue and in vivo conditions (D=0.3µm2/ms and 3µm2/ms, respectively).
Results and Discussion
N1 and nigrosome 3 (N3) in SN appeared as areas of high R2* and hypointensity in high-resolution T2*WI in all investigated samples. This finding, based on precise co-registration between histology and quantitative MRI (100µm precision (Fig.2A,B,E)), challenges common interpretations that N1 is an area of low R2*.15,16
Since iron removal strongly decreased R2* in nigrosomes (82±22 to 21±2s-1), iron appears as the main source of contrast in gradient echo experiments. Dopaminergic neurons were visible as regions of high iron concentration in maps acquired with PIXE (Fig.2C), further supporting this conclusion. Iron-induced ΔR2*=61±22s-1 in N1 and N3 was much higher than ΔR2=12±3s-1, suggesting that iron-induced relaxation is closer to the regime of static dephasing than motional narrowing (Fig.3C).
Predicted gradient echo decays for SD showed excellent agreement with experimentally observed linear exponential signal decay at 7T. The predictions of SD and EMT were compared with MC at different field strengths in the case of post mortem and in vivo diffusion conditions (Fig.4). SD provides accurate estimations at 7T and 9.4T, but deviates significantly at 1.5T and 3T for in vivo conditions. Thus, the total iron load of dopaminergic neurons can be estimated from R2* measured at high fields.6 EMT is applicable only at very short TE at 7T, but provides a good estimation of decays at lower fields.
Conclusion
For the first time, we present a generative model quantitatively describing iron-induced R2 and R2* in nigrosomes in SN. We demonstrate that N1 shows increased values of R2* driven by iron in DN, which at higher field can be predicted by SD. The total iron content of DN can be extracted analytically from R2* and R2.6 This provides an important step toward a specific early stage PD biomarker, based on DN depletion before onset of PD motor symptoms.
Acknowledgements
We acknowledge the Brain Banking Centre Leipzig of the German Brain-Net, operated by the Paul Flechsig Institute of Brain Research, Medical Faculty, University of Leipzig for providing post mortem brain samples.
The research leading to these results has received funding from the European Research Council under the European Union's Seventh Framework Program (FP7/2007-2013) / ERC grant agreement n° 616905. This project has also received funding from the BMBF (01EW1711A & B) in the framework of ERA-NET NEURON.
M. D. Brammerloh has received funding from the International Max Planck Research School on Neuroscience of Communication: Function, Structure, and Plasticity.
References
1. P. Damier, E.C. Hirsch, Y. Agid, et al. The substantia nigra of the human brain. II. Patterns of loss of dopamine-containing neurons in Parkinson's disease. Brain. 1999;122(8):1437-48.
2. Y. Agid. Parkinson's disease: pathophysiology. Lancet. 1991;337(8753):1321-4.
3. J. Acosta-Cabronero, A. Cardenas-Blanco, M. J. Betts. The whole-brain pattern of magnetic susceptibility perturbations in Parkinson's disease. Brain. 2017;140(1):118-131.
4. J. H. Lee, S. Y. Baek, S. Y. Chun. Specific visualization of neuromelanin-iron complex and ferric iron in the human post-mortem substantia nigra using MR relaxometry at 7T. Neuroimage. 2018;172:874-885. 5. J. H. Lee, S. Y. Baek, Y. Song, et al. The Neuromelanin-related T2* Contrast in Postmortem Human Substantia Nigra with 7T MRI. Sci. Rep. 2016;6:32647.
6. D. A. Yablonskiy, E. M. Haacke. Theory of NMR signal behavior in magnetically inhomogeneous tissues: the static dephasing regime. Magn. Reson. Med. 1990;32(6):749:63.
7. V. G. Kiselev and D. S. Novikov. Transverse NMR Relaxation as a Probe of Mesoscopic Structure. Phys. Rev. Lett. 2002;89:278101.
8. V. G. Kiselev, D. S. Novikov. Transverse NMR relaxation in biological tissues. Neuroimage. 2018;182:149-168.
9. M. D. Brammerloh, I. Weigelt, T. Arendt, et al. Iron-induced relaxation mechanisms in the human substantia nigra: towards quantifying iron load in dopaminergic neurons. Proc. Intl. Soc. Mag. Reson. Med. 188 (2018)
10. C. Stüber, M. Morawski, A. Schäfer, et al. and iron concentration in the human brain: a quantitative study of MRI contrast. Neuroimage. 2014;93(1):95-106.
11. J. F. Schenck. Health and Physiological Effects ofHuman Exposure to Whole-Body Four-Tesla Magnetic Fields during MRI. Ann. N. Y. Acad. Sci. 1992;649:285-301.
12. J. P. Marques, R. Bowtell. Application of a Fourier-based method for rapid calculation of field inhomogeneity due to spatial variation of magnetic susceptibility. Concepts Magn. Reson. 2005;25B(1):65-78.
13. Gagnon, L., Sakadžić, S., Lesage, F., et al. Quantifying the microvascular origin of BOLD fMRI from first principles with two-photon microscopy and an oxygen-sensitive nanoprobe. J. Neurosci. 2015;35:3663–3675.
14. A. Ruh, P. Emerich, D. S. Novikov, et al. Characterizing microstructure by a time-dependent transverse relaxation rate. Proc. Intl. Soc. Mag. Reson. Med. 21 (2013)
15. A. I. Blazejewska, S. T. Schwarz, A. Pitiot. Visualization of nigrosome 1 and its loss in PD: pathoanatomical correlation and in vivo 7 T MRI. Neurology. 2013;81(6)534-40.
16. F. J. Meijer, S. C. Steens, A. van Rumund, et al. Nigrosome-1 on Susceptibility Weighted Imaging to Differentiate Parkinson's Disease From Atypical Parkinsonism: An In Vivo and Ex Vivo Pilot Study. Pol. J. Radiol. 2016;81:363-9.
17. P. Damier, E.C. Hirsch, Y. Agid, et al. The substantia nigra of the human brain. I. Nigrosomes and the nigral matrix, a compartmental organization based on calbindin D(28K) immunohistochemistry. Brain. 1999;122(8):1421-36.
Figures