1212
Longitudinal assessment of relaxation and magnetization transfer saturation rates during formalin fixation across fiber pathways of the human brain1Department of Systems Neurosciences, University Medical Center Hamburg-Eppendorf, Hamburg, Germany, 2Department of Neurophysics, Max Planck Institute for Human Cognitive and Brain Sciences, Leipzig, Germany, 3Department of Legal Medicine, University Medical Center Hamburg-Eppendorf, Hamburg, Germany
Synopsis
We longitudinally investigated the effect of brain tissue fixation, using 4% paraformaldehyde, on three potential quantitative myelin MRI markers across different white matter fiber pathways of the human brain: longitudinal (R1) and apparent transverse (R2*) relaxation rates and magnetization transfer (MT) using the quantitative multi-parameter mapping (MPM) protocol. To better understand the temporal evolution of the fixation process within the whole brain and its influence on MRI parameters, we monitored the temporal evolution of the fixation process of a whole human post-mortem brain using the same MPM protocol at 15 time-points (one unfixed, in-situ MRI scan and 14 ex-vivo MRI scans) at different stages of the fixation process (days 1-93).
Introduction
To validate the predictions of MRI-based biophysical
models 1, typically fixed tissue samples are first measured
with MRI and then compared to the ex vivo histology gold standard. This
validation is then translated to the in vivo situation, known as the “triple
jump approach” 2. However, before such an approach, can be reliably used, the effect of the fixation and the autolysis
processes on the measured MR signal needs to be better understood. Here, we
monitored the temporal evolution of these processes by acquiring quantitative
MRI (qMRI) maps for longitudinal (R1) and apparent
transverse relaxation rates (R2*), as well as
magnetization saturation rates (MT) at different stages of the fixation process
for 93 days. Hereby, we specifically tackled the question whether the temporal
evolution of these processes showed differences for different fiber pathways,
indicating differences in the underlying microstructure of the pathways.
Methods
Sample: One human post-mortem brain dissected at autopsy with prior informed consent (WF-74/16, 37yo, female, cardiac failure) was fixed with 4% paraformaldehyde (PFA) in aqueous solution, as commonly used for ex vivo histology 3–5. The time interval between death and begin of the fixation was 21h. The sample was measured by MRI at days 0, 3, 4, 5, 6, 7, 9, 10, 11, 12, 13, 14, 17, 36, and 93. The Formalin was replaced seven times in this process at day 2, 3, 6, 13, 21, 31 and 86.
MRI: Measurements were performed on a 3T PRISMA fit MRI (Siemens Healthcare, Erlangen, Germany) on the whole brain using the MPM 6 protocol, comprised of calibration 7 and spoiled multi-echo fast-low-angle-shot (FLASH) 8 data with three different weightings. The parameters were: isotropic resolution of 1mm³, 6° (MT- and PD-weighted) and 21° (T1-weighted) flip angles, 16 gradient echoes (2.34-41.44 ms, in steps of 2.30 ms), readout bandwidth of 488 Hz/pixel, repetition time (TR): 47.50 ms. The protocol was used to scan the brain first in situ (day 0), i.e. unfixed and still inside the skull, and ex situ in the 4% PFA solution at 14 time-points during the fixation process. A custom-made sample holder was used to stabilize the positioning.
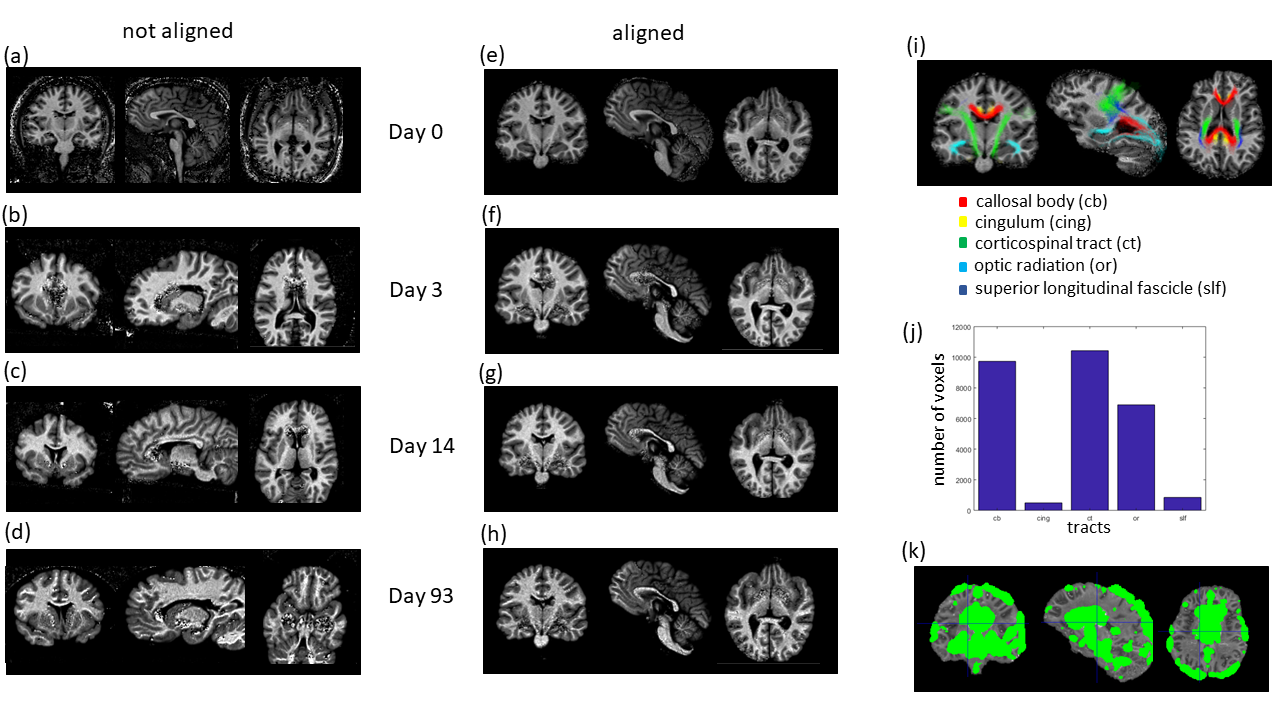
Analysis: From the MPM protocol, quantitative R2*, R1, and MT maps were calculated using the MPM modelling framework 9. The ex vivo MT maps were registered to the in situ MT map using manual and affine registration. Afterwards, non-linear, longitudinal registration available in SPM was used for refined registration 10 (see figure 1). Then the transformations previously determined for the MT maps were applied to the other MPM maps. The fiber-tract region-of-interests (ROIs) as defined in the Jülich-white-matter atlas 11 were registered to the longitudinally registered MPM maps, using SPM registration tools (figure 1i).
Results
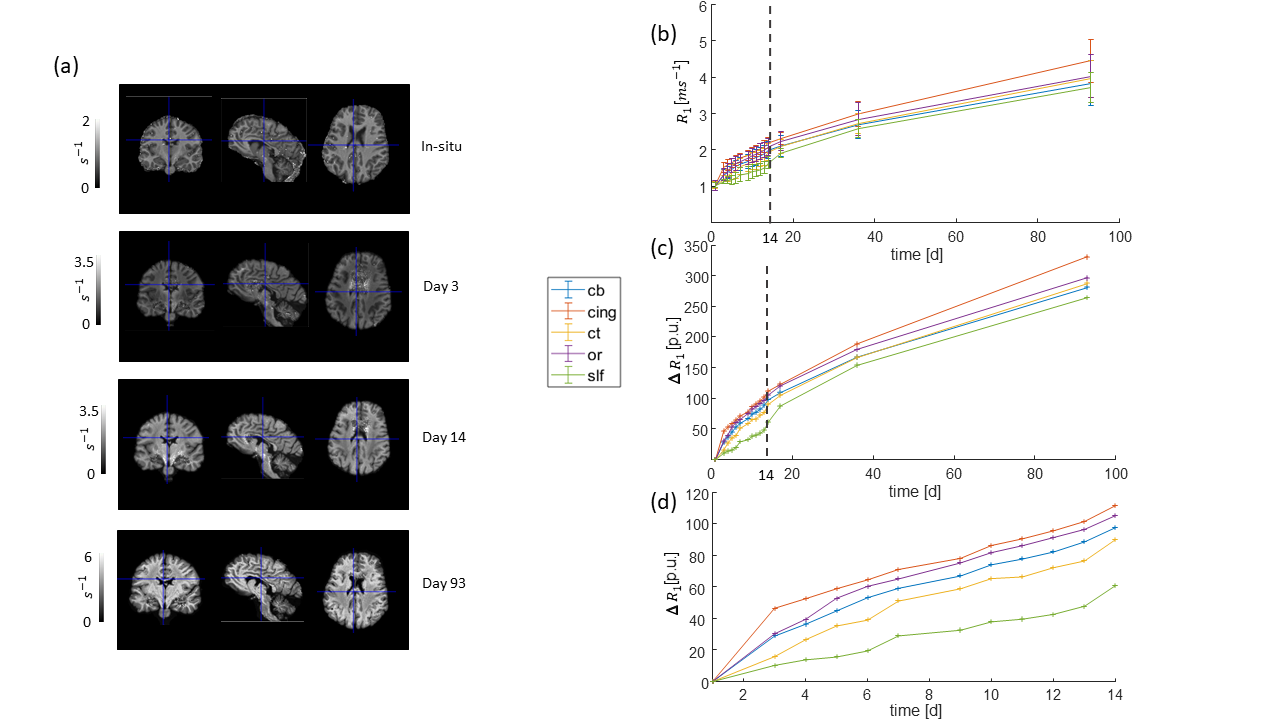
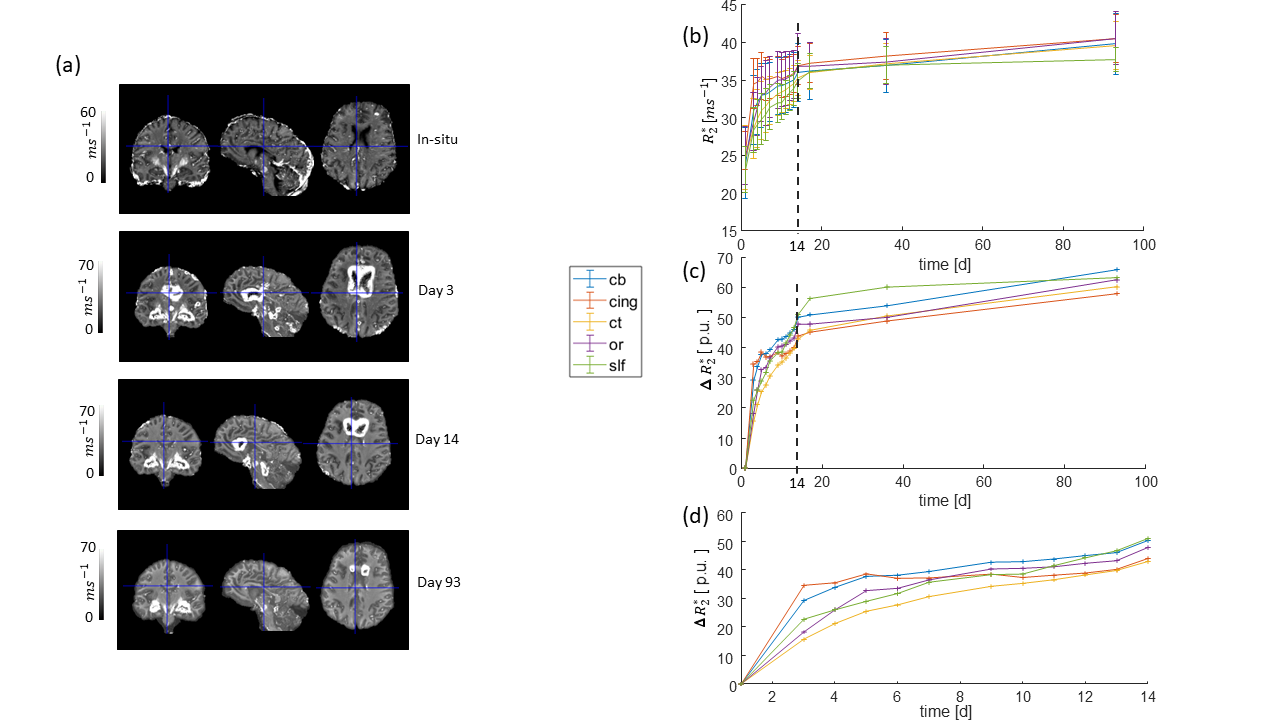
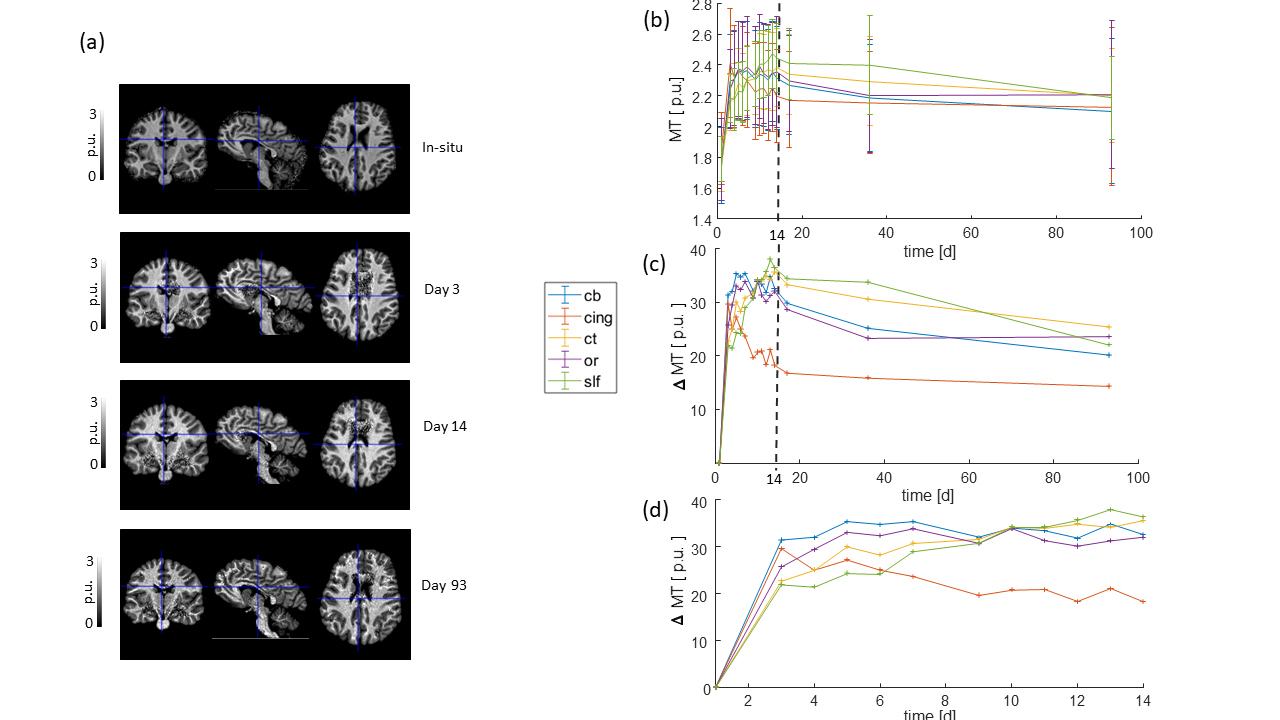
All monitored qMRI parameters changed during the fixation process. The temporal evolution of the parameters could be separated into two stages, a rapidly changing stage and a slow and monotonic. R1 and R2* increased nonlinearly during the first stage (days 3-14, figures 2 and 3), but then reached an almost linear slope, which was large for R1 and small for R2*, in accordance to previous findings 5, 9–11. MT approached a maximum during the first stage and leveled off or decreased in the second stage (figure 4).
Out of the investigated fiber pathways, the relative change of the qMRI parameters in the superior-longitudinal fascicle (slf, green curves) showed the most distinguishable temporal change during the first 14 days of fixation: smallest slope for R1 (figure 2d), and largest slope for R2* (figure 3d) and MT (figure 4d). Moreover, the relative change of R1 as a function of fixation showed a positive curvature in the slf, whereas it was rather negative in the other tracts (figure 2c, d).
Discussion and Conclusion
Using the MPM protocol to monitor the temporal evolution of R1, R2*, and MT across the fixation process, we found that the temporal change of all three markers could be separated into two stages: a rapidly changing and a slow and monotonic stage. Moreover, we found that all parameters evolved differently in the slf as compared to the other fiber tracts. This observation might indicate a substantial difference in the microstructural composition of the slf as compared to the other tracts. To test this interpretation: a higher sampling rate of the temporal change of all parameters is necessary but also histological studies of the type of 15 and 16 could help to identify microstructural axonal features that might explain the distinct temporal behavior of the investigated MRI parameters in the slf during the fixation process.Acknowledgements
This work was supported by the German Research Foundation (Emmy Noether Stipend: MO 2397/4-1) and by the BMBF (01EW1711A and B) in the framework of ERA-NET NEURON.References
1. Weiskopf, N., Mohammadi, S., Lutti, A. & Callaghan, M. F. Advances in MRI-based computational neuroanatomy: from morphometry to in-vivo histology. Curr. Opin. Neurol. 28, 313–322 (2015).
2. Turner, R. & Geyer, S. Comparing like with like: the power of knowing where you are. Brain Connect. 4, 547–557 (2014).
3. Thavarajah, R., Mudimbaimannar, V., Rao, U., Ranganathan, K. & Elizabeth, J. Chemical and physical basics of routine formaldehyde fixation. J. Oral Maxillofac. Pathol. 16, 400 (2012).
4. Fox, C. H., Johnson, F. B., Whiting, J. & Roller, P. P. Formaldehyde fixation. J. Histochem. Cytochem. Off. J. Histochem. Soc. 33, 845–853 (1985).
5. Birkl, C. et al. Effects of formalin fixation and temperature on MR relaxation times in the human brain: Formalin fixation MR relaxation mechanisms. NMR Biomed. 29, 458–465 (2016).
6. Weiskopf, N. et al. Quantitative multi-parameter mapping of R1, PD*, MT and R2* at 3T: a multi-center validation. Front. Brain Imaging Methods 7:, 95 (2013).
7. Lutti, A. et al. Robust and fast whole brain mapping of the RF transmit field B1 at 7T. PloS One 7, e32379 (2012).
8. Frahm, J., Haase, A. & Matthaei, D. Rapid three-dimensional MR imaging using the FLASH technique. J. Comput. Assist. Tomogr. 10, 363–368 (1986).
9. Weiskopf, N. et al. Quantitative multi-parameter mapping of R1, PD*, MT, and R2* at 3T: a multi-center validation. Front. Neurosci. 7, (2013).
10. Ashburner, J. A fast diffeomorphic image registration algorithm. NeuroImage 38, 95–113 (2007).
11. Bürgel, U. et al. White matter fiber tracts of the human brain: Three-dimensional mapping at microscopic resolution, topography and intersubject variability. NeuroImage 29, 1092–1105 (2006).
12. Raman, M. R., Shu, Y., Lesnick, T. G., Jack, C. R. & Kantarci, K. Regional T 1 relaxation time constants in Ex vivo human brain: Longitudinal effects of formalin exposure: Regional T 1 Mapping in Fixed Brain. Magn. Reson. Med. 77, 774–778 (2017).
13. Shepherd, T. M., Thelwall, P. E., Stanisz, G. J. & Blackband, S. J. Aldehyde fixative solutions alter the water relaxation and diffusion properties of nervous tissue. Magn. Reson. Med. 62, 26–34 (2009).
14. Ashtarayeh, M., Streubel, T., Püschel, K. & Mohammadi, S. Effect of autolysis, fixation, and storage in PBS on relaxation rates and macro-molecular tissue volume across fiber pathways of the human brain. Proc Intl Soc Mag Reson Med 26, 2066 (2018).
15. Liewald, D., Miller, R., Logothetis, N., Wagner, H.-J. & Schüz, A. Distribution of axon diameters in cortical white matter: an electron-microscopic study on three human brains and a macaque. Biol. Cybern. 108, 541–557 (2014).
16. Braitenberg, V. & Schüz, A. The Human Cortical White Matter: Quantitative Aspects of Cortico-Cortical Long-Range Connectivity. in Cortical Areas (eds. Miller, R. & Schüz, A.) 20020530, 377–385 (CRC Press, 2002).
Figures