1209
Multi-Vendor Validation of Controlled Saturation Magnetization Transfer (CSMT) for VFA T1 and T2 mapping1Centre for the Developing Brain,School of Biomedical Engineering and Imaging Sciences, King's College London, London, United Kingdom, 2Biomedical Engineering Department, School of Biomedical Engineering and Imaging Sciences, King's College London, London, United Kingdom, 3MR Research Collaborations, Siemens Healthcare Limited, Frimley, United Kingdom, 4Neuroimaging, King's College London, London, United Kingdom
Synopsis
White matter T1 values have been reported to range from 699ms-1735ms1. The recently introduced Controlled Saturation Magnetization Transfer (CSMT)2 qMRI approach suggests this might be due to MT effects. In this work employ the CSMT framework on 3 major MR manufacturers and demonstrate it allows a decrease in variability of T1/T2 estimation both in phantom and in-vivo.
Introduction
Recent work1, collated the range of normative T1 and T2 relaxation times values for brain reported throughout the literature at 3T and found an unexpectedly wide range of values given similar tissues. As an example white matter (WM) T1values ranged from 699ms-1735ms1. The Controlled Saturation Magnetization Transfer (CSMT)2 qMRI approach suggests this might be due to MT effects in brain tissue and proposed the use of non-selective multiband RF-pulses tailored to equalize saturation power across all measurements in variable flip angle (VFA) qMRI. We hypothesized that the CSMT approach can stabilize VFA measures of T1/T2 across sites.Methods
Scans were performed on a GE MR750(General Electric Healthcare), Philips Achieva-Tx(Philips Healthcare) and Siemens Biograph-mMR(Siemens Healthcare) 3T systems. In all scanners, data was acquired at 1mm3 resolution with TR/TE=7.0/3.5ms, FA of 3°, 7°, 11°, and 15° for SPGR (RF-spoiling increment of 50° in two sites and 117° in the remaining) and 5°, 25° and 45° for SSFP with 180° RF-phase increment between consecutive pulses. An extra 45° FA with 0° RF increment to allow B0 estimation3 was also acquired. Transmit field inhomogeneities were measured using each scanners default method. All FAs were measured twice: once with RF-pulse native to the scanner concerned and with a 3-band CSMT pulse2 designed for a target B1rms=1.6uT. Estimation of T1/T2 was based on the Joint System Relaxometry (JSR)4 approach which, as DESPOT5, makes use of Spoiled Gradient Echo (SPGR) and balanced SS free precession (bSSFP) images. Parameter maps were estimated using all measures (All FA) and 6 permutations of the angles.
A 15%w/w bovine serum albumin (BSA) NMR tube was prepared following the approach described by Koenig et al.6. BSA is known to manifest significant MT effects6,7. Temperature as a confounder was avoided by immersing the BSA tube in an ice-bath 30-60 min before imaging. Measurements were extracted from a spherical Region of Interest (ROI) with 3-voxel radius whose centre was manually selected in a well shimmed region in the centre of the phantom.
A single volunteer was imaged on all three scanners. Informed consent was obtained according to local ethics requirements. WM specific ROI were obtained using the FSL FAST8 algorithm to obtain WM map and further eroded using a 3mm radius sphere.
Results
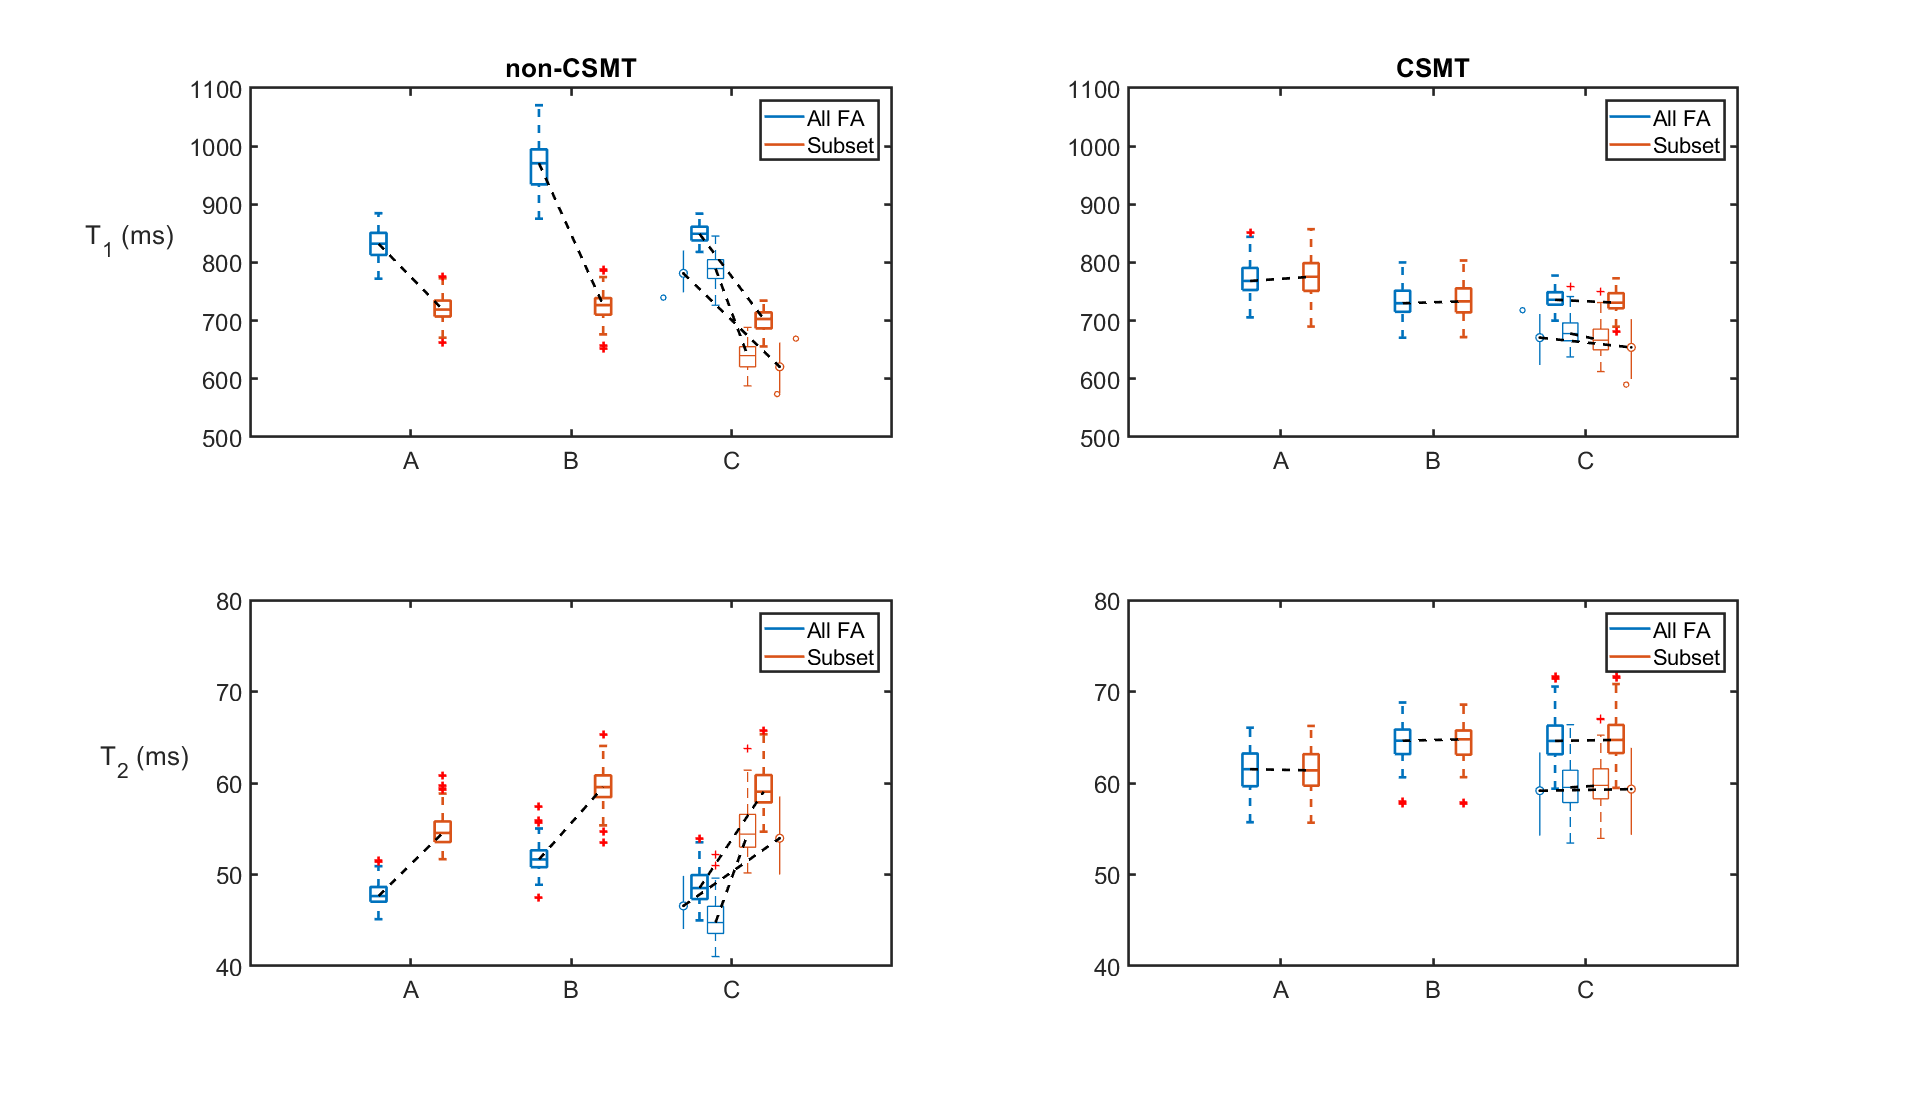
Figure 1 shows a box-plot summary comparison of Phantom results. Estimated T1 (top-row) and T2 (bottom-row) distributions are shown for both non-CSMT (left-column) and CSMT (right-column) conditions. Vendor C has two measurements (thin box-plots) performed on a different date to demonstrate test-retest variability. Extra 5 permutations (for a total of 7) were computed for each measurement but are not shown for simplicity of demonstration.
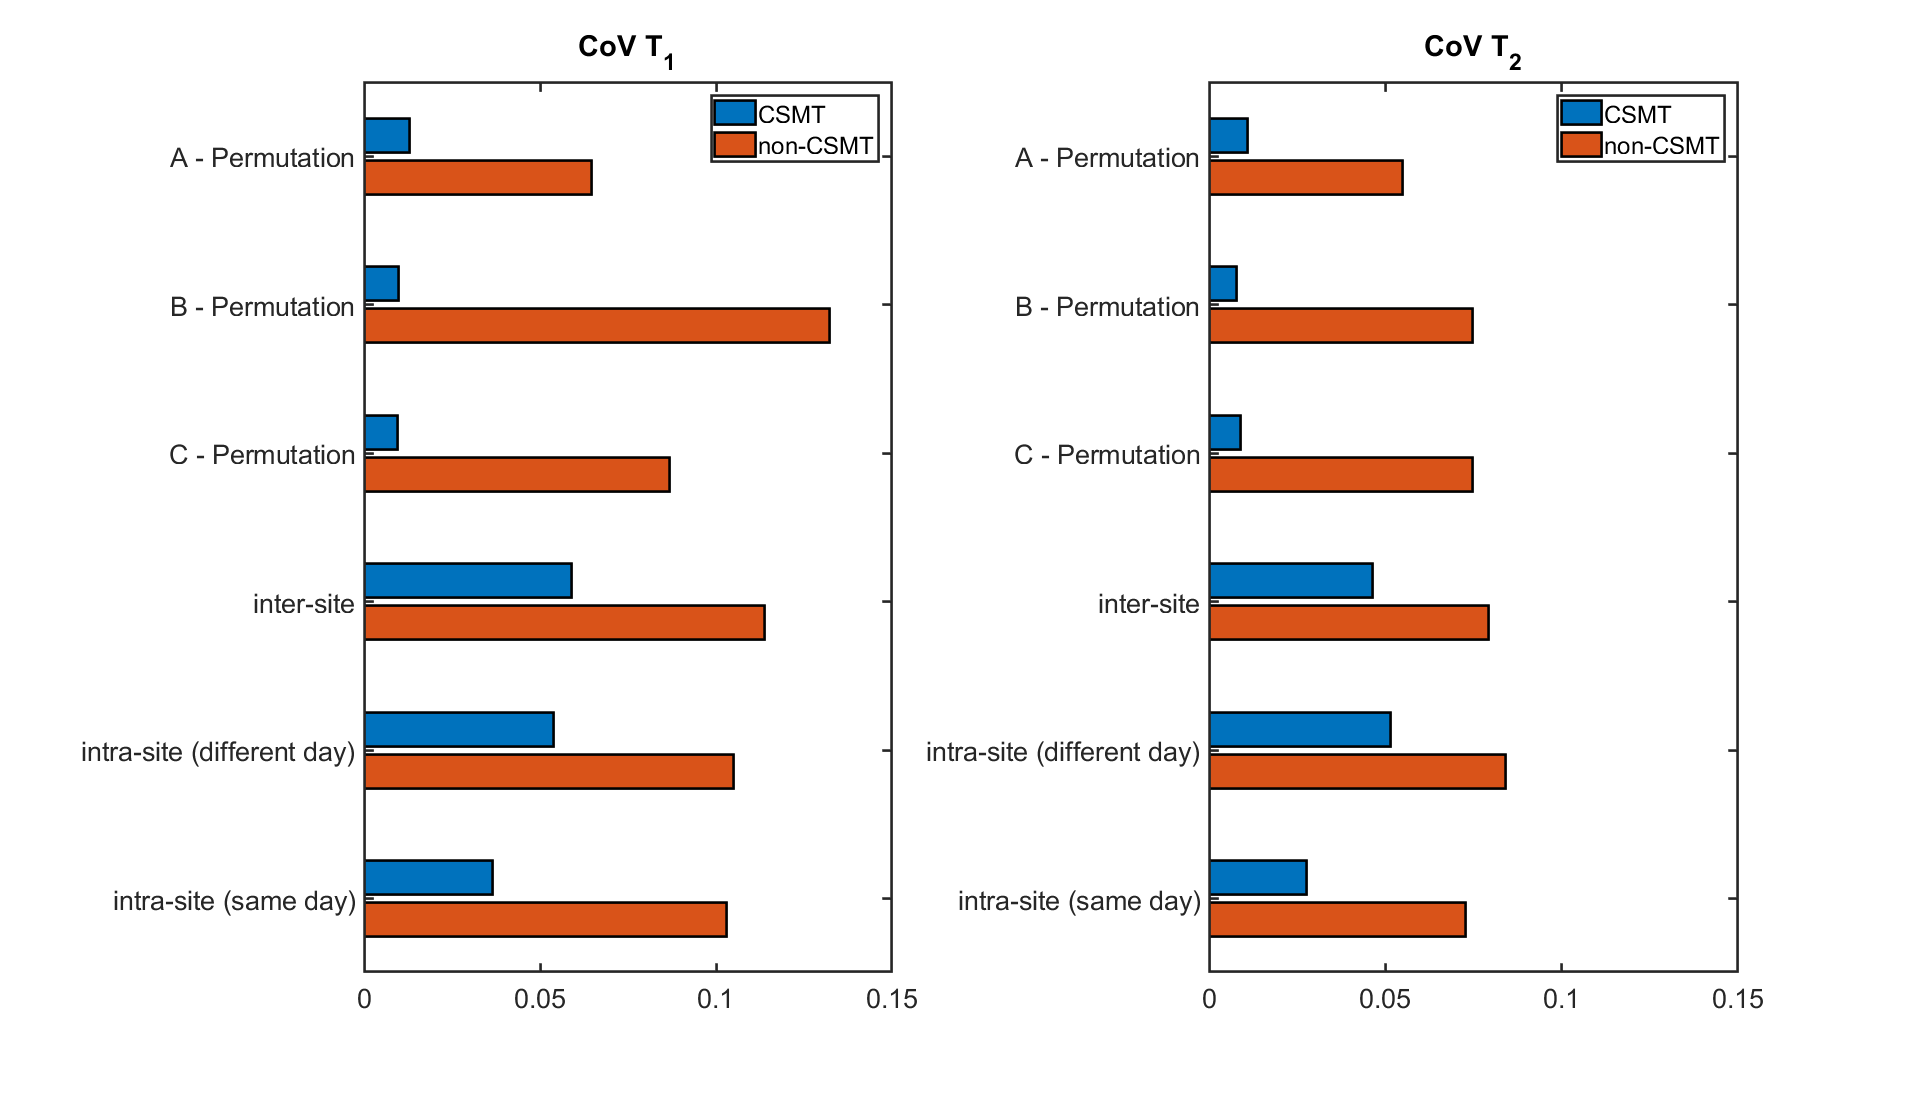
Data variability was accessed via the coefficient of variance (CoV=std/mean) metric. This was computed across all 7 median values obtained from each permutation test. Furthermore, CoV was computed between all sites measures (inter-site CoV). Intra-site variability was measured in site C by repeating the experiment twice on a different date allowing to measure intra-site CoV spaced in time (different day) and close in time (same day). Summary of all this comparisons is highlighted in Figure 2 for both T1 (left) and T2 (right).
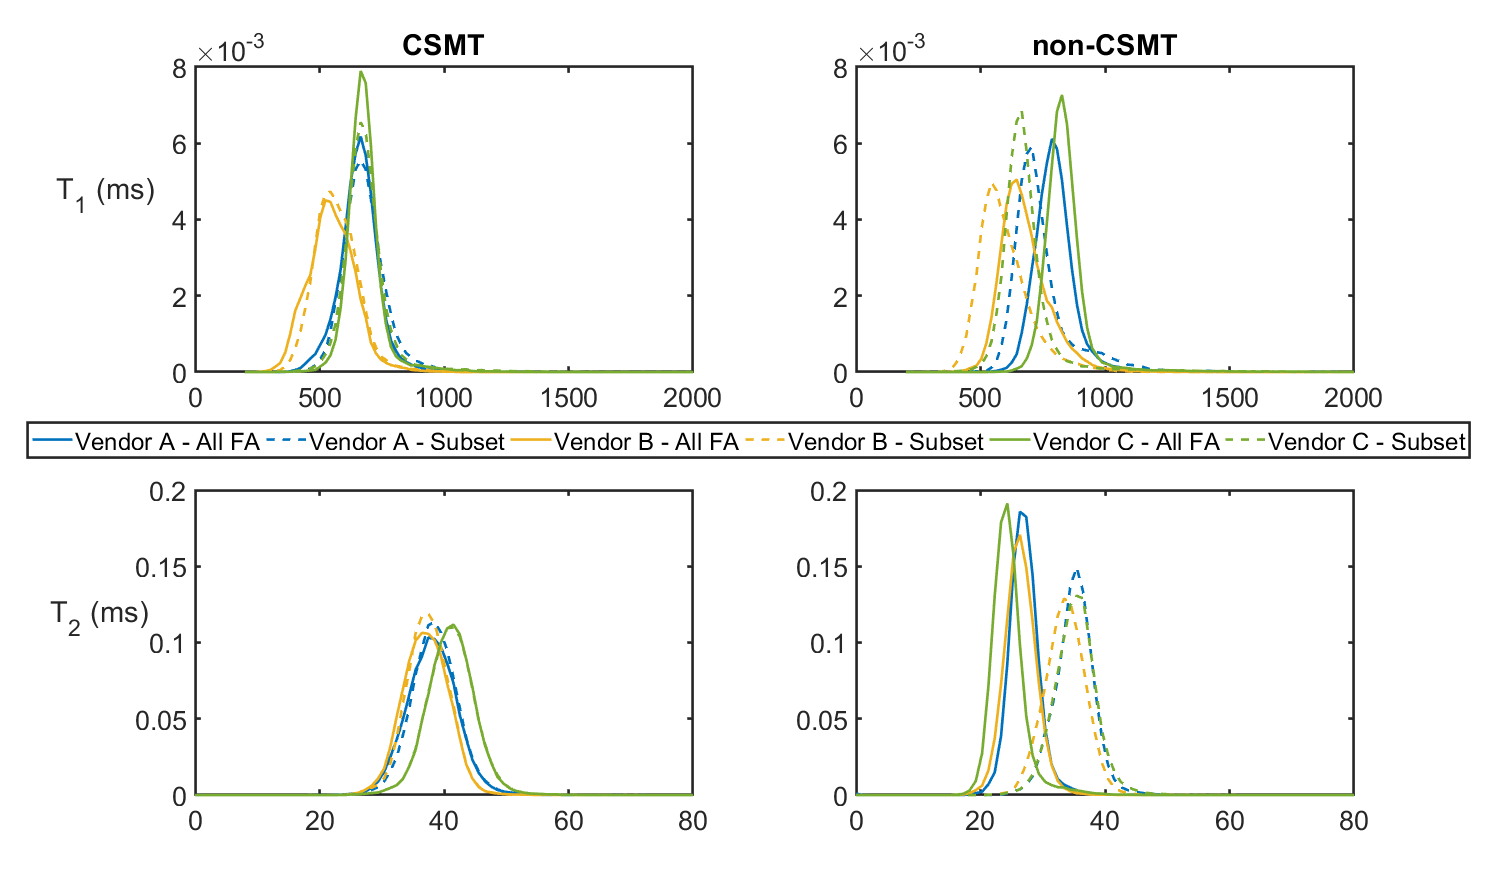
Figure 3 shows WM extracted histograms for both T1 (top-row) and T2(bottom-row) under both CSMT(left-column) and non-CSMT(right-column) conditions. Distributions are normalized to their estimated probability density function.
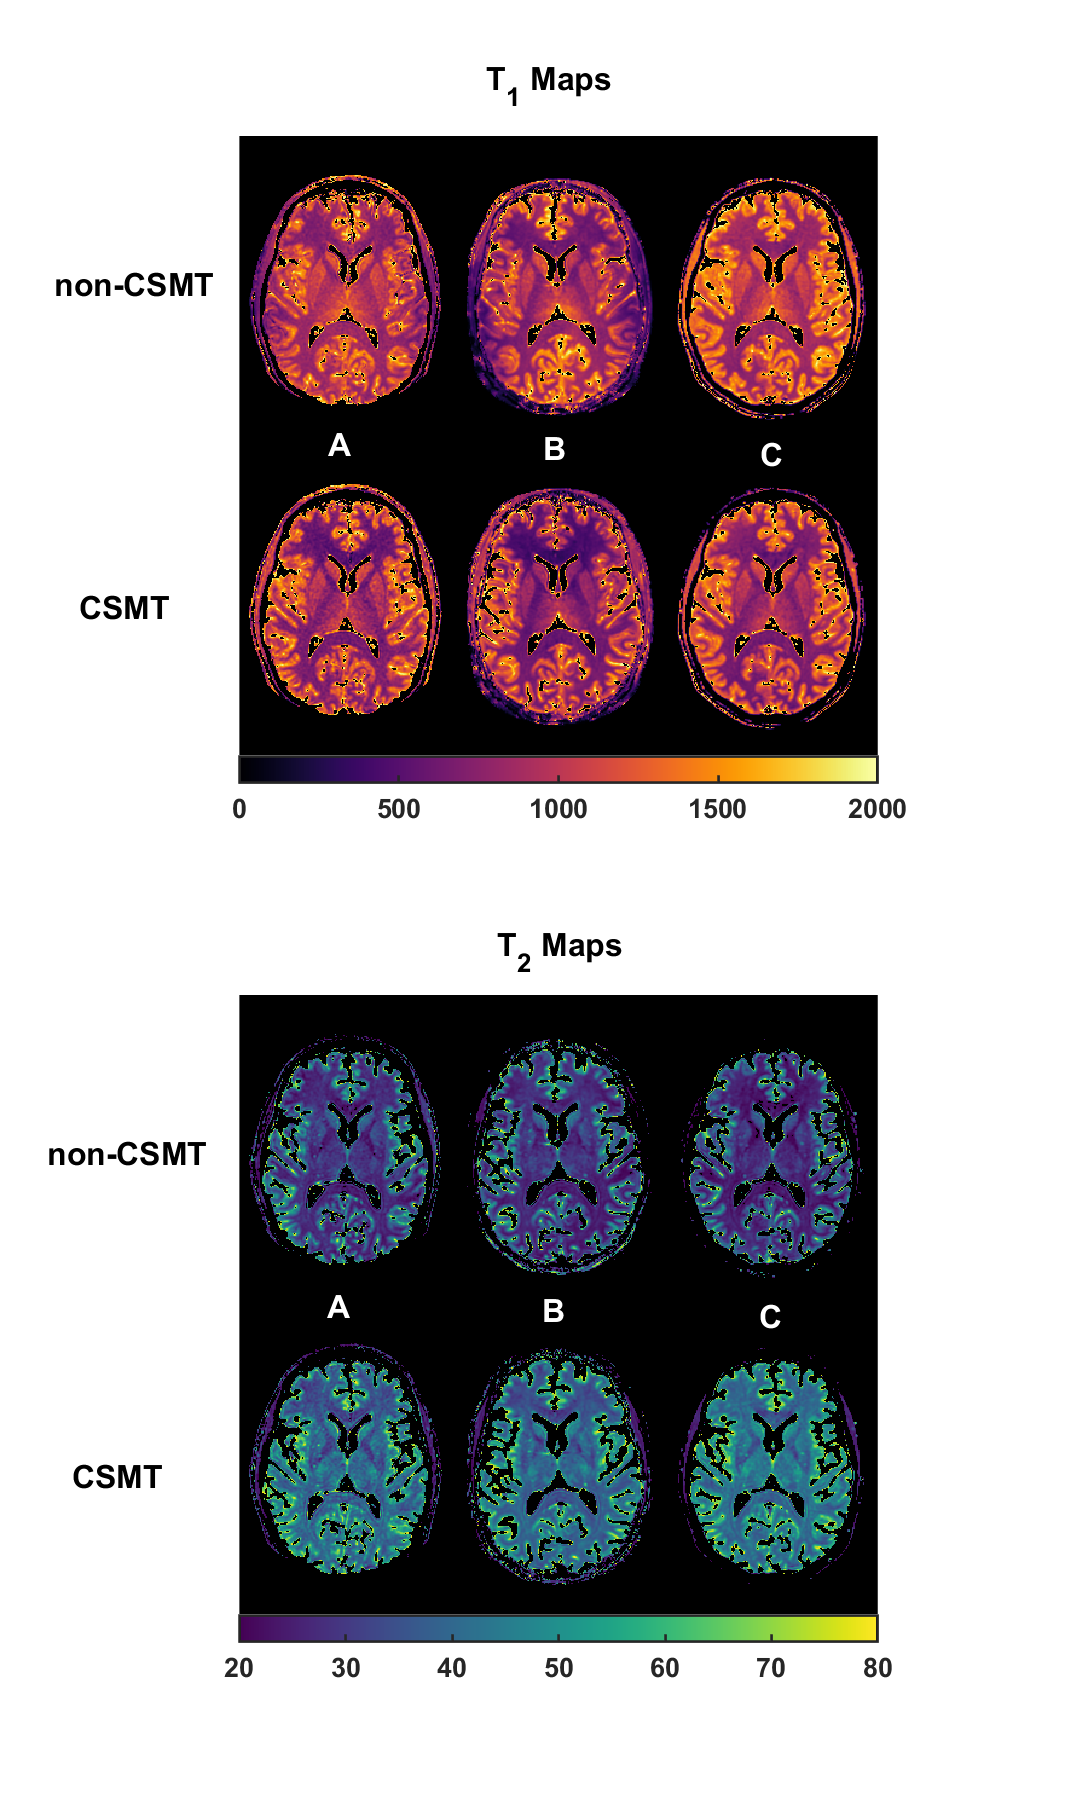
Representative axial slices obtained for each vendor are highlighted in Figure 4 for both non-CSMT conditions and CSMT conditions.
Discussion
This work sought to harmonize differences in estimated T1/T2 times across sites by controlling MT effects. Therefore, the only parameter we sought to control across all sites was the B1rms via the dedicated CSMT pulses2. All remaining commonly sought sources of bias such as incorrect spoiling or incorrect B1mapping were left to each site preferred option.
Figure 1 shows MT samples apparent T1/T2 are highly dependent on the particular scanning conditions. This is mitigated (<1% variability) once B1rms is held fixed2 for all measures. Figure 2, shows inter-site variability <11%(non-CSMT) similar to work9. This is reduced to <5% under CSMT sampling which is in line with the observed intra-scanner variability.
Figure 3 corroborates phantom data in-vivo. There is excellent agreement of T1 estimation between vendor A and C although a systematic shift is observed for B. A slight disagreement in estimated T2 values is also obtained between vendor C and A-B. This might be due to different spoiling regimens or incorrect mapping of local transmit fields and further investigation is required.
Conclusion
MT effects can be major contributor to inter-/intra-site variability of T1/T2 estimation across vendors. With CSMT, MT effects are stabilized paving the way for the use of single-pool metrics as a reliable source for clinical diagnosis across sites.Acknowledgements
This work was supported by ERC grant agreement no. 319456 (dHCP project), the Wellcome EPSRC Centre for Medical Engineering at Kings College London (WT 203148/Z/16/Z) and by the National Institute for Health Research (NIHR) Biomedical Research Centre based at Guy’s and St Thomas’ NHS Foundation Trust and King’s College London. The views expressed are those of the authors and not necessarily those of the NHS, the NIHR or the Department of Health.References
1. Bojorquez, J. Z. et al. What are normal relaxation times of tissues at 3 T? Magn. Reson. Imaging 35, 69–80 (2017).
2. A.G. Teixeira, R. P., Malik, S. J. & Hajnal, J. V. Fast quantitative MRI using controlled saturation magnetization transfer. Magn. Reson. Med. 1–14 (2018). doi:10.1002/mrm.27442
3. Deoni, S. C. L., Ward, H. A., Peters, T. M. & Rutt, B. K. Rapid T2 estimation with phase-cycled variable nutation steady-state free precession. Magn. Reson. Med. 52, 435–439 (2004).
4. A.G. Teixeira, R. P., Malik, S. J. & Hajnal, J. V. Joint system relaxometry (JSR) and Crámer-Rao lower bound optimization of sequence parameters: A framework for enhanced precision of DESPOT T1and T2estimation. Magn. Reson. Med. 79, 234–245 (2018).
5. Deoni, S. C. L., Rutt, B. K. & Peters, T. M. Rapid combined T1 and T2 mapping using gradient recalled acquisition in the steady state. Magn. Reson. Med. 49, 515–526 (2003).
6. Koenig, S. H., Brown, R. D. & Ugolini, R. Magnetization transfer in cross‐linked bovine serum albumin solutions at 200 MHz: A model for tissue. Magn. Reson. Med. 29, 311–316 (1993).
7. Malik, S. J., Teixeira, R. P. A. G. & Hajnal, J. V. Extended phase graph formalism for systems with magnetization transfer and exchange. Magn. Reson. Med. 80, 767–779 (2018).
8. Zhang, Y., Brady, M. & Smith, S. Segmentation of brain MR images through a hidden Markov random field model and the expectation-maximization algorithm. IEEE Trans. Med. Imaging 20, 45–57 (2001).
9. Lee, Y., Callaghan, M. F., Acosta-Cabronero, J., Lutti, A. & Nagy, Z. Establishing intra- and inter-vendor reproducibility of T 1 relaxation time measurements with 3T MRI. Magn. Reson. Med. 1–12 (2018). doi:10.1002/mrm.27421
Figures