1208
Non-Invasive Assessment of Intratumor Heterogeneity in Clear Cell Renal Cell Carcinoma using Quantitative MRI-Derived Texture Features1Radiology, UT Southwestern Medical Center, Dallas, TX, United States, 2Advanced Imaging Research Center, UT Southwestern Medical Center, Dallas, TX, United States, 3Clinical Science, UT Southwestern Medical Center, Dallas, TX, United States, 4Pathology, UT Southwestern Medical Center, Dallas, TX, United States, 5Urology, UT Southwestern Medical Center, Dallas, TX, United States, 6Kidney Cancer Program, UT Southwestern Medical Center, Dallas, TX, United States, 7Internal Medicine, UT Southwestern Medical Center, Dallas, TX, United States
Synopsis
Intra and inter-tumor heterogeneity pose a challenging task for predicting tumor behavior due to the limited understanding of the molecular mechanism of clear cell renal cell carcinoma (ccRCC) development. The purpose of the present study was to correlate non-invasive quantitative measures of heterogeneity on MR imaging with histopathologic signatures of aggressiveness and gene expression heterogeneity in ccRCC. MRI derived Haralick texture features offer objective, quantitative measures of ccRCC aggressiveness, which can help compensate for the limitations of percutaneous biopsies in the tissue characterization of larger, heterogeneous tumors and assist in the implementation of active surveillance and neoadjuvant therapy protocols.
Abstract
Introduction: Clear cell renal cell carcinoma (ccRCC) represents the most common and aggressive subtype of RCC (65%–70%) and is highly variable in prognosis, biology, and therapy response [1-3]. Intratumoral heterogeneity (ITH) relates to aggressiveness in ccRCC [4]. Although percutaneous biopsies have high diagnostic accuracy for malignancy, reliability for tumor grading suffers in larger masses due to ITH . Noninvasive in vivo quantitative magnetic resonance imaging (MRI) methods that provide an objective, quantitative assessment of ITH in the whole tumor are therefore appealing. Haralick texture features extracted from a gray level co-occurrence matrix (GLCM) is a robust method to assess intrinsic tumor imaging characteristics [5]. Some of these features, including entropy (measure of ITH), have recently been used in differentiating malignant lesions from benign tumors in various organs. We aim to understand how tumor entropy extracted from MRI correlate with tumor grade and gene expression heterogeneity in ccRCC.
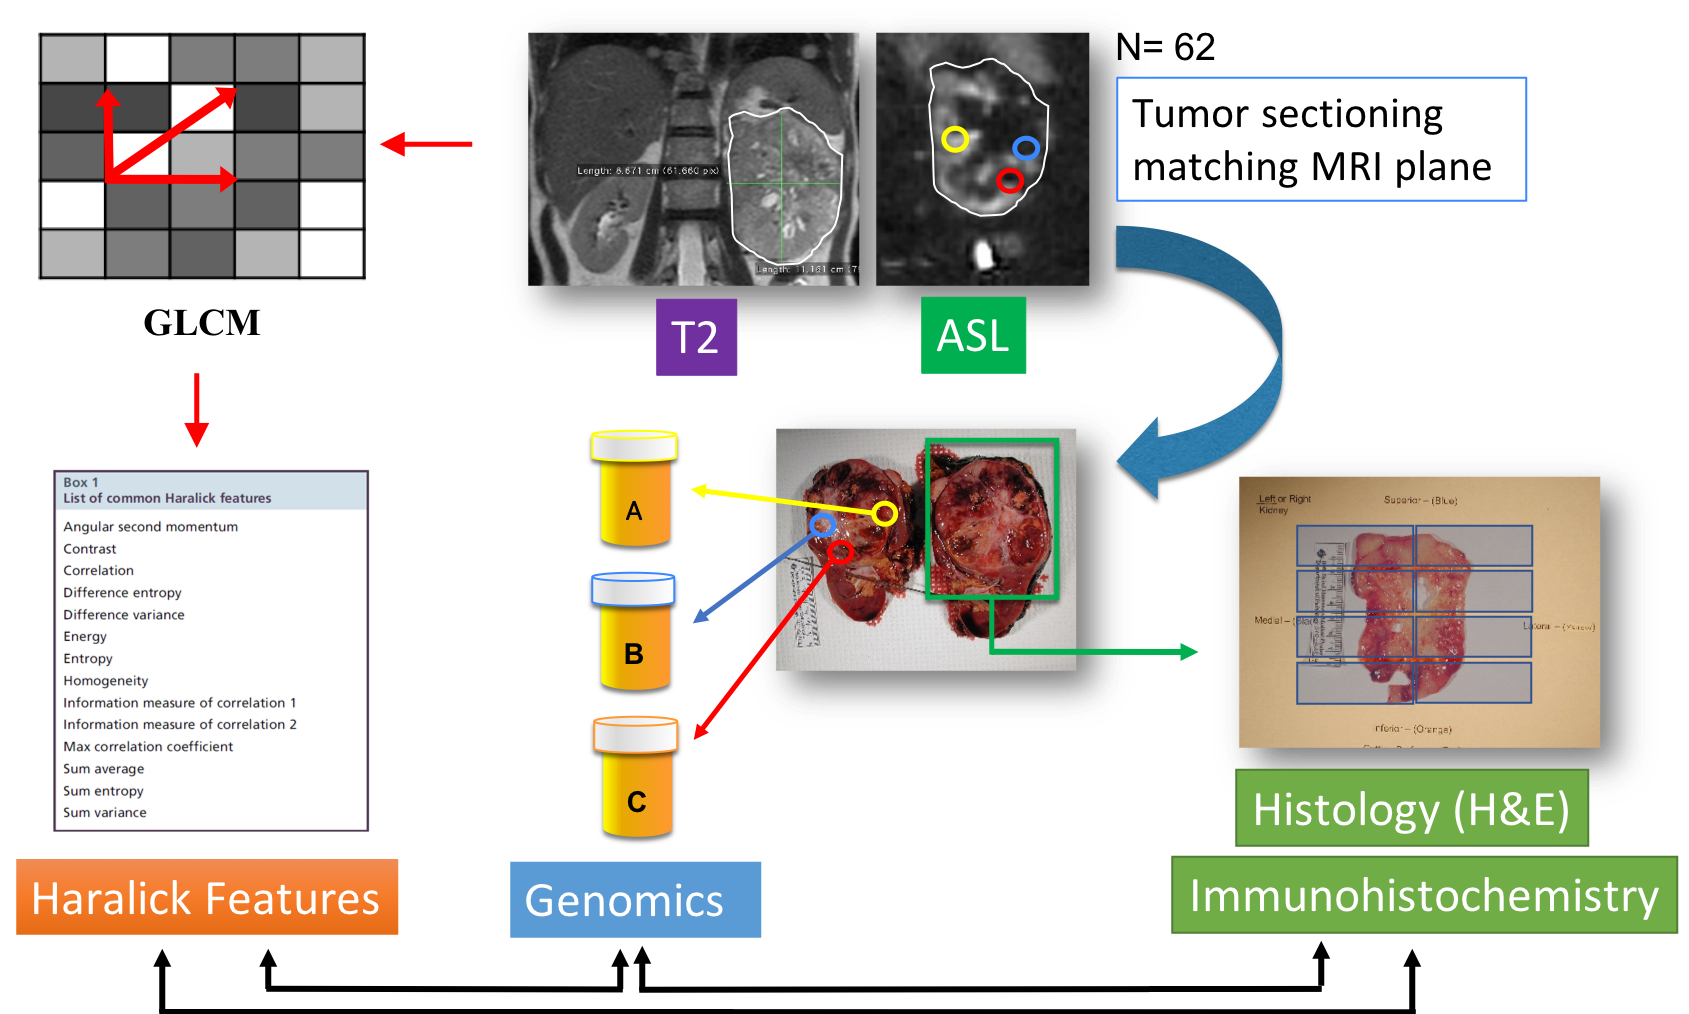
Material and Methods: This IRB-approved, prospective, and HIPAA- compliant study included 62 patients with ccRCC between 2012 - 2017 who signed a written informed consent prior to MRI. MRIs were performed on a 3T whole body MRI system (Ingenia, Philips Healthcare) using dStream anterior and posterior torso coils. Axial and coronal T2-weighted (T2W) ((TR/TE) = 1115/80ms, flip angle (FA) = 90o, number of signal averages (NSA) = 1, slice thickness = 5 mm, field of view (FOV) = 402 x 340 mm2, matrix = 284 x 268, bandwidth = 467 Hz per pixel) anatomic images were acquired. Pseudo-continuous ASL (pCASL) MRI was performed with TR of 6 seconds to allow a complete recovery of the spin magnetization and allow for guided breathing. Sixteen label and control pairs for the ASL were acquired and averaged. A proton density-weighted image (M0) was also acquired without the labeling or background suppression for perfusion quantification [6]. All tumors were manually segmented by an expert radiologist on OsiriX MD DICOM viewer. A region of interest (ROI) was drawn to include the entire tumor avoiding the contour of the lesion to minimize partial volume effects. An OsiriX-based plugin (pyOsiriX) and an open-source Python library (Mahotas) were used to perform the texture analysis [7,8]. A GLCM was constructed for each ROI and 13 Haralick texture features were calculated. After surgery, tumors were graded per International Society of Urological Pathology (ISUP) grading system. RNA extraction from 182 tumor samples in 49 surgically resected tumors were performed according to established protocols [9]. Library preparation (Illumina TruSeq mRNA Library Kit) and mRNA sequencing (HiSeq 4000) were done (Admerahealth, South Plainfield, NJ) (Schematic, Fig 1).
Statistical Analysis: Correlation between texture features and tumor grade was evaluated by logistic regression and area under the ROC curve (AUC). Entropy was correlated with standard deviation (SD) of normalized gene expression levels in multiple samples from the same tumor and Spearman correlation (rho) was computed for each gene. False discovery rate (FDR) (q-values) of < 0.05 considered statistically significant. Softwares: SAS 9.4 (SAS Institute, NC) and R (R Foundation for Statistical Computing, Austria).
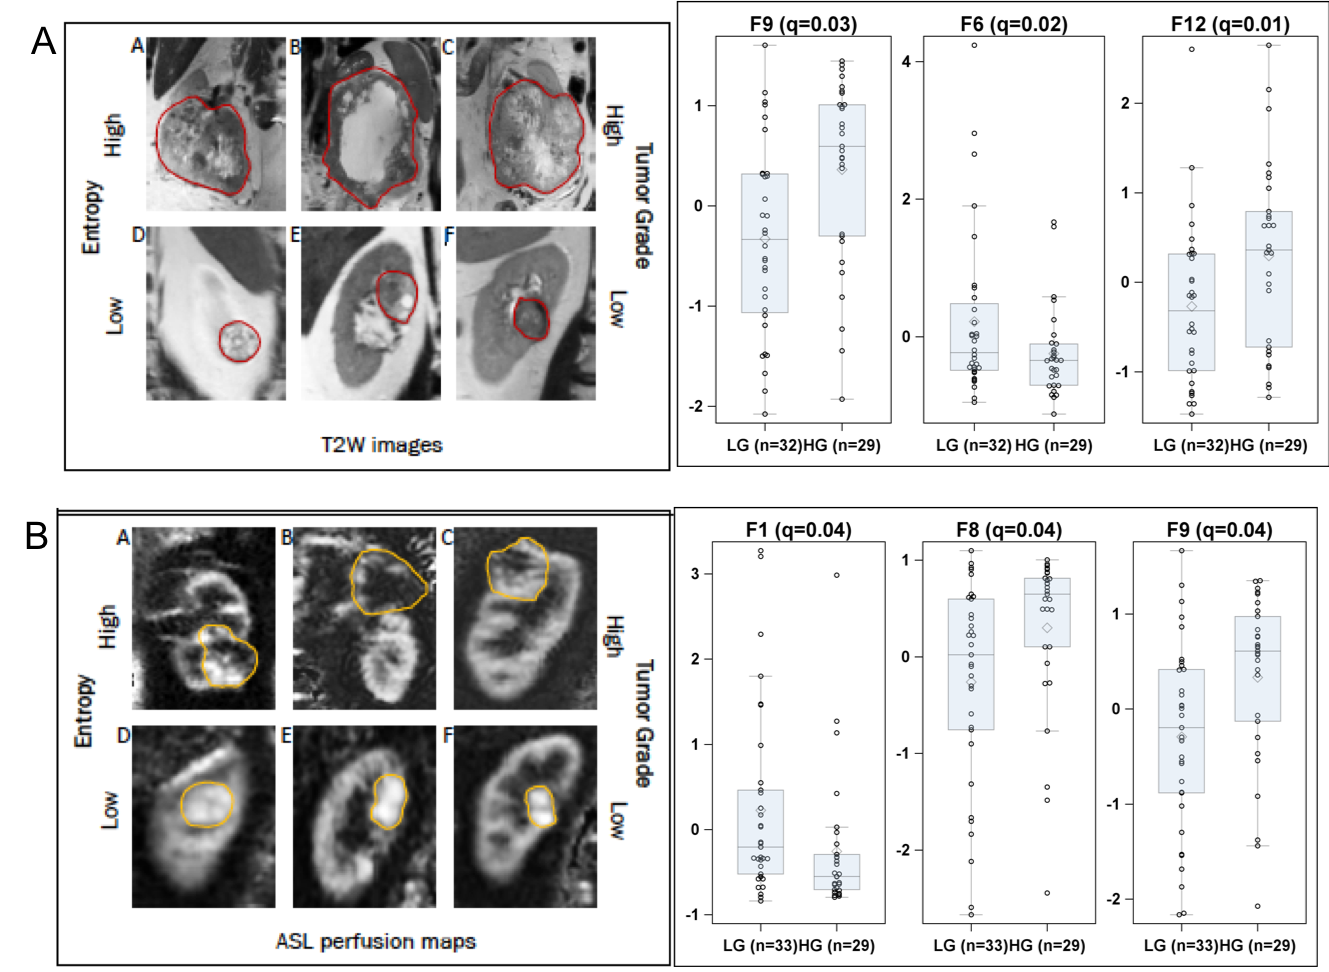
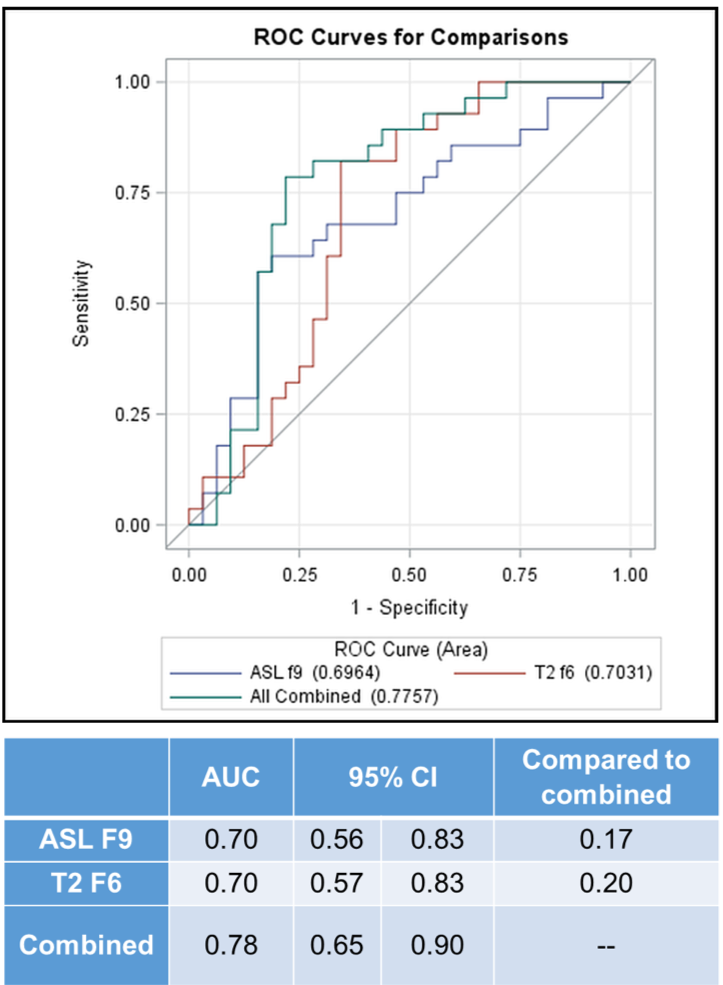
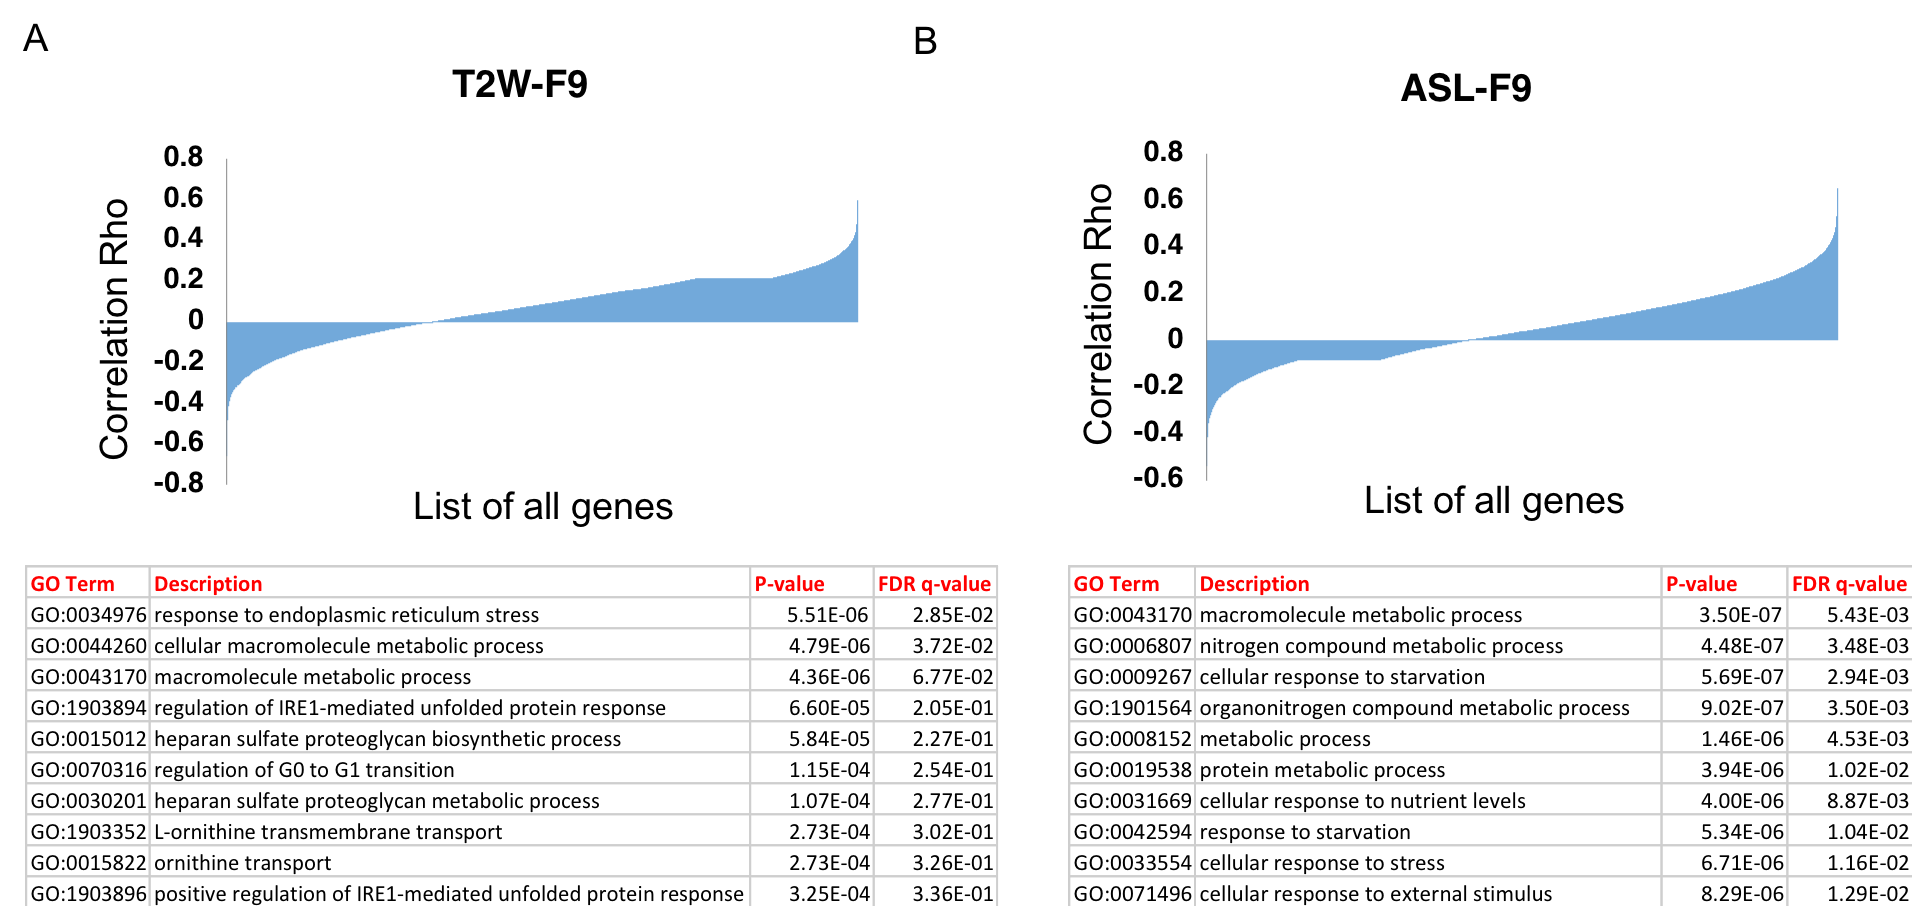
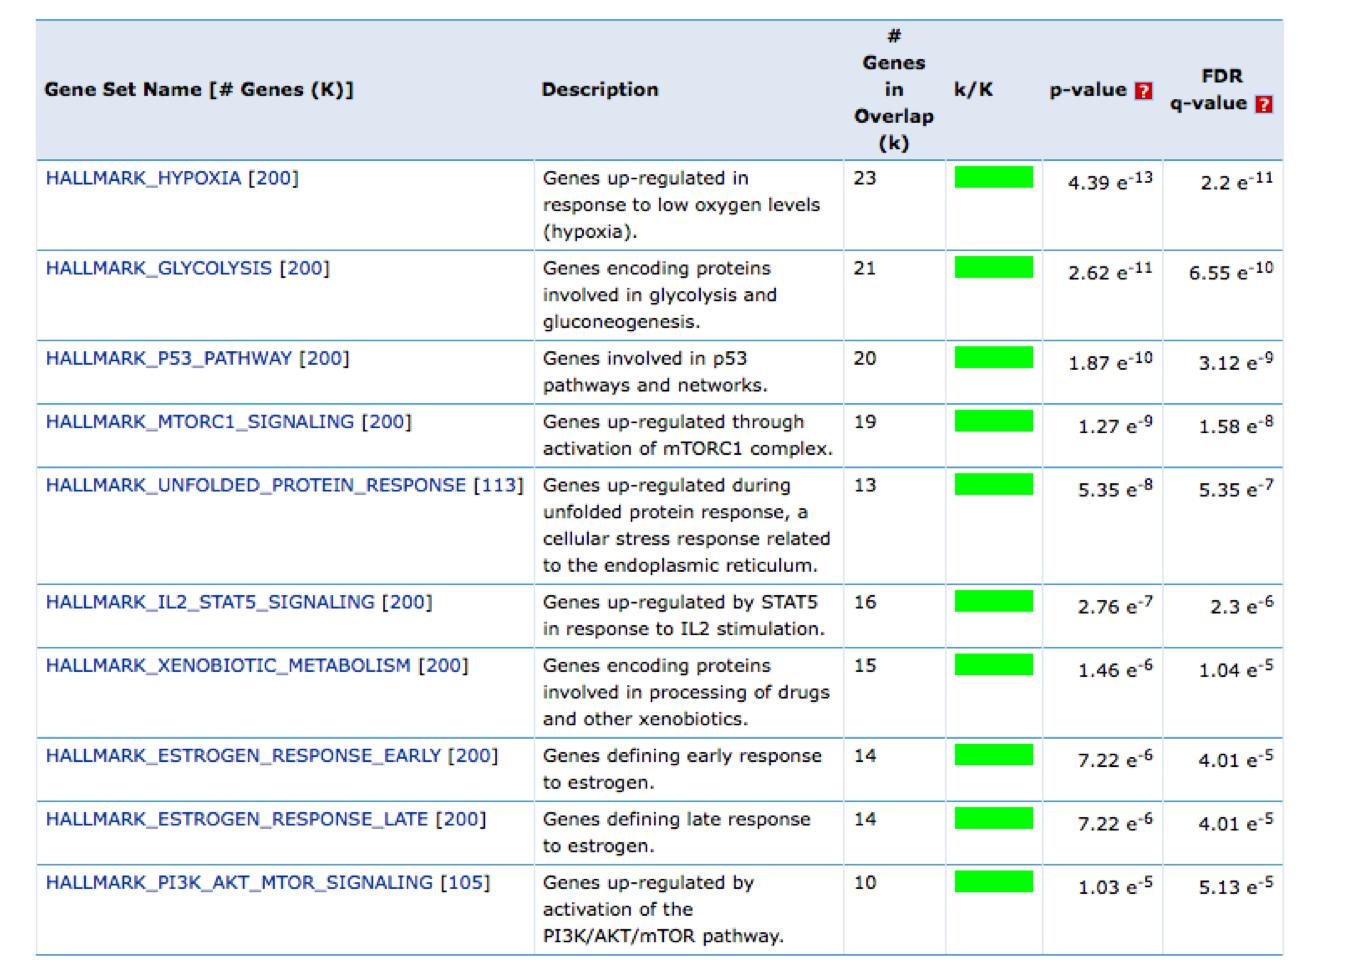
Results: Entropy was higher in high-grade than low-grade tumors on T2W (q = 0.028) and ASL (q = 0.04) (Fig 2). Entropy had an AUC of 0.70 (T2) for high-grade prediction and was weakly correlated with tumor size (R2 = 0.2) (Fig 3). Higher T2 and ASL entropy correlated with higher variability in gene expression (Fig 4). Gene ontology analysis of top correlated genes revealed strong enrichment of genes in metabolic processes suggesting higher heterogeneity in tumor perfusion correlates with increased heterogeneity in the expression of metabolic genes. Further, Gene Set Enrichment Analysis performed on the top genes positively correlated with ASL-Entropy showed significant enrichment of hallmark pathways implicated in ccRCC tumorigenesis (Fig 5).
Conclusion: Correlation between higher entropy on MRI and both higher tumor grade and increased gene expression heterogeneity in ccRCC suggest that the imaging phenotype may reflect the marked molecular heterogeneity that characterizes ccRCC. While the safety (i.e. low risk of developing metastases) of AS in larger tumors (cT1b/T2) has been documented, the reliability of tumor biopsies to accurately grade RCC is limited. Lack of reliable predictors of oncologic behavior represent an important argument for resistance to using AS in these larger tumors. An imaging biomarker that provides accurate information about tumor biology/aggressiveness non-invasively (e.g. Haralick texture features) in the whole tumor could overcome these limitations and would facilitate the adoption of AS in these patients. Furthermore, the non-invasive assessment of ITH may facilitate selection of patients for neoadjuvant therapy protocols.
Acknowledgements
Funding Sources: NIH grants R01 5RO1CA154475, P50CA196516, and U01CA207091References
1. Cheville JC, Lohse CM, Zincke H, Weaver AL, Blute ML: Comparisons of outcome and prognostic features among histologic subtypes of renal cell carcinoma. The American journal of surgical pathology 2003, 27(5):612-624.
2. Motzer RJ, Bukowski RM: Targeted therapy for metastatic renal cell carcinoma. J Clin Oncol 2006, 24(35):5601-5608.
3. Teloken PE, Thompson RH, Tickoo SK, Cronin A, Savage C, Reuter VE, Russo P: Prognostic impact of histological subtype on surgically treated localized renal cell carcinoma. J Urol 2009, 182(5):2132-2136.
4. Gerlinger M, Rowan AJ, Horswell S, Math M, Larkin J, Endesfelder D, Gronroos E, Martinez P, Matthews N, Stewart A et al: Intratumor heterogeneity and branched evolution revealed by multiregion sequencing. N Engl J Med 2012, 366(10):883-892.
5. Yang D, Rao G, Martinez J, Veeraraghavan A, Rao A: Evaluation of tumor-derived MRI-texture features for discrimination of molecular subtypes and prediction of 12-month survival status in glioblastoma. Med Phys 2015, 42(11):6725-6735.
6. Robson PM, Madhuranthakam AJ, Dai W, Pedrosa I, Rofsky NM, Alsop DC: Strategies for reducing respiratory motion artifacts in renal perfusion imaging with arterial spin labeling. Magn Reson Med. 2009 Jun;61(6):1374-87.
7. Blackledge MD, Collins DJ, Koh DM, Leach MO. Rapid development of image analysis research tools: Bridging the gap between researcher and clinician with pyOsiriX. Comput Biol Med 2016; 69: 203-212.
8. Coelho LP. Mahotas: Open source software for scriptable computer vision. Journal of Open Research Software 2013; 1(1): e3
9. Pena-Llopis S, Brugarolas J: Simultaneous isolation of high-quality DNA, RNA, miRNA and proteins from tissues for genomic applications. Nat Protoc 2013, 8(11):2240-2255.
Figures