1207
Value of Whole-lesion MR T2WI Texture Analysis in Diagnosis of Renal Oncocytoma from Localized RCC Subtypes: Comparison with Characteristic Imaging SignsYichen Wang1, Fei Xu1, Jin Zhang1, and Yan Chen2
1Radiology, National Cancer Center/National Clinical Research Center for Cancer/Cancer Hospital, Chinese Academy of Medical Sciences and Peking Union Medical College, Beijing, China, 2National Cancer Center/National Clinical Research Center for Cancer/Cancer Hospital, Chinese Academy of Medical Sciences and Peking Union Medical College, Beijing, China
Synopsis
Accurate imaging diagnosis of renal oncocytomas remains a challenge for radiologists. Our study retrospectively collected MR imaging of 37 renal oncocytomas and 131 Stage I renal cell carcinoma, compared the diagnostic efficacy between whole-lesion MRI texture analysis and traditional imaging features. Tumor central scar or segmental enhancement inversion showed low sensitivity with high specificity. While whole-lesion MRI texture analysis showed better performance in diagnosis of renal oncocytomas, especially in differentiating oncocytomas with chrommphobe RCC. Whole-lesion MR T2WI texture analysis can be an applicable method in diagnosis of renal oncocytomas.
Introduction
Renal oncocytoma is the second most common benign renal tumor after angiomyolipoma comprising an estimated 7–10 % of all renal neoplasms. Accurate imaging diagnosis remains inconclusive, with biopsy and surgery typically required for diagnosis. Previously, the imaging signs of central scar and segmental enhancement inversion were considered characteristics of renal oncocytoma. But the diagnostic efficiency was variable among studies. Recent interest in texture analysis has produced numerous studies aiming at developing texture-based models as a cancer risk assessment and prognostic tool. Lesion characterization through imaging that support treatment decision-making is of significant clinical importance. This study retrospectively collected MR imaging of renal oncocytomas and localized renal cell carcinomas (RCC), using texture analysis to explore its value in differential diagnosis comparing with traditional imaging signs.Methods
From 2010 to 2018, 37 renal oncocytomas and 131 Stage I renal cell carcinoma (51 clear cell (cc), 56 chromphobe(ch) and 24 papillary(p) renal cell carcinoma) were included in this study. Two radiologists with abundant experiences in urological oncology read all patients’ MR imaging together without knowing pathology and described the imaging features (necrosis, hemorrhage, central scar and segmental enhancement inversion). Another radiologist manually draw the ROI of the tumors on the axial images of fat-saturated T2 weighted imaging (GE Signa Excite HD 3.0T, FSE, slice thickness 7. 0mm,FOV 38cm) slice by slice using GE Omni-Kinetics V2.0. Tumors’ 3D texture parameters were extracted. We compared the imaging features and texture parameters of oncocytomas and different subtypes of renal cell carcinoma. The texture parameters with intra-group significant differences were selected and ROC curves were draw to diagnose oncocytomas from RCCs. AUC, sensitivity, and specificity were calculated to evaluate the diagnostic value of texture parameters.Results
Age and tumor diameters have no differences among patients. ChRCC occurs more likely in female patients. Only 14 out of 37 oncocytomas showed central scar or segmental enhancement inversion. 15 out of 137 RCC patients also showed central scar or SEI. Sensitivity and specificity using central scar/SEI for diagnosing renal oncocytoma is calculated to be 48.2% and 83.5%. Among texture parameters, entropy, energy, kurtosis, uniformity, correlation, cluster prominence (CP), haralick correlation(HC) had significant differences between oncocytoma and RCC subtypes. In diagnosis of oncocytoma from RCC, CP has the best performance with AUC of 0.70 (0.61-0.79), sensitivity of 70.0% and specificity of 65.1%. In differential diagnosis of oncocytoma and chRCC, CP has the best performance with AUC of 0.83(0.74-0.92), sensitivity of 75.8% and specificity of 76.9%. In differential diagnosis of oncocytoma and pRCC, HC has the best performance with AUC of 0.77(0.63-0.90), sensitivity of 72.7% and specificity of 75.0%.Discussion
The diagnosis of renal oncocytoma from RCC has long been considered an impossible mission[]. Kim et al in 2009 found and named the imaging sign ’segmental enhancement inversion’ which considered to be a characteristic sign for renal oncocytomas. Several studies has examined its diagnostic efficacy and the latest meta-analysis indicated that SEI is a specific imaging finding of renal oncocytoma with highly variable sensitivity. Our study included a large number of renal oncocytomas and RCC subtypes. The results of low sensitivity and high specificity from our study accorded with most of previous studies’ conclusion. Some previous studies showed that CT and MR texture analysis can differentiate small renal lesions. But the sample size of renal oncocytomas is relatively small. And most of the studies used multi-phase CT or MR imaging. Our study for the first time found that whole-lesion texture parameters derived from MR T2WI have significant difference between renal oncocytoma and RCC subtypes. Whole-lesion texture analysis showed well perfomances in differential diagnosis of oncocytoma and RCC, especially in differentiation of oncocytoma and chRCC. The diagnostic sensitivity reached to more than 70%, with relatively high specificity. Whole-tumor texture analysis of MR T2WI has several advantages. The MR technique has no radiation exposure and requires no contrast injection, thus can be widely used in clinical. The imaging analysis is easy to master and relatively subjective. For renal lesions suspected of oncocytoma, whole-lesion texture analysis of MR T2WI can provide more information and add diagnostic accuracy.Conclusion
Whole-lesion MR texture analysis performances well in diagnosis of renal oncocytomas with RCC subtypes. This method showed better diagnostic sensitivity than traditional imaging signs.Acknowledgements
No acknowledgement found.References
[1] Gill IS, Aron M, Gervais DA, Jewett MA (2010) Clinical practice. Small renal mass. N Engl J Med 362(7):624–634. https://doi.org/10. 1056/NEJMcp0910041 [2] Kim JI, Cho JY, Moon KC, Lee HJ, Kim SH (2009) Segmental enhancement inversion at biphasic multidetector CT: characteristic finding of small renal oncocytoma. Radiology 252:441–448 [3] Schieda N , Mcinnes M D F , Cao L . Diagnostic accuracy of segmental enhancement inversion for diagnosis of renal oncocytoma at biphasic contrast enhanced CT: systematic review[J]. European Radiology, 2014, 24(6):1421. [4] Young JR,Margolis D,Sauk S,et al. Clear cell renal cell carcinoma: discrimination from other renal cell carcinoma subtypes and oncocytoma at multiphasic multidetector CT [J]. Radiology, 2013, 267(2) : 444-453. [5] Davnall F, Yip C S P, Ljungqvist G, et al. Assessment of tumor heterogeneity: an emerging imaging tool for clinical practice?[J]. Insights Into Imaging, 2012, 3(6): 573-589. [6] Hoang U N, Mojdeh M S, Meirelles O, et al. Assessment of multiphasic contrast-enhanced MR textures in differentiating small renal mass subtypes[J]. Abdominal radiology, 2018(6):1-10.Figures
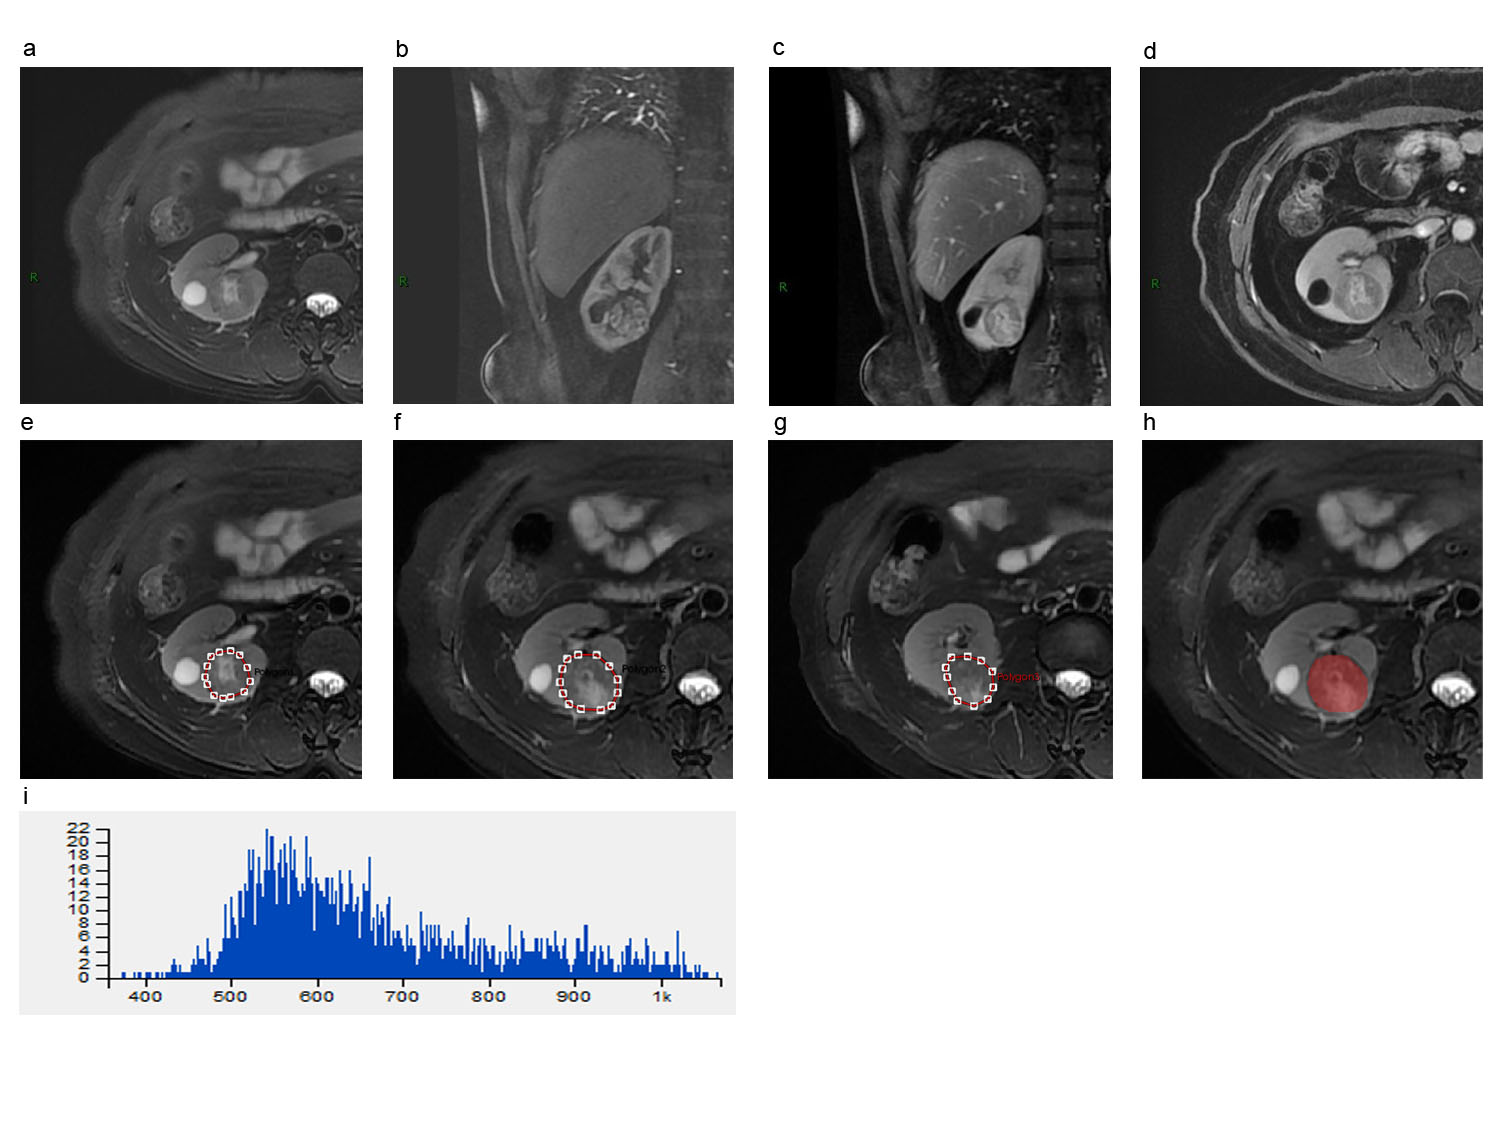
Figure 1. A 48 female patient with renal oncocytoma showing central scar. (a) axial T2WI/FS; (b) corticalmedullary phase of coronal T1WI with contrast;(c) nephrographic phase of coronal T1WI with contrast; (d) nephrographic phase of axial T1WI with contrast; (e)~(g) showed the ROI of every slice of tumor on axial T2WI/FS; (h) showed the merged 3D ROI of tumor; (i) showed the histogram of whole-lesion MR T2WI/FS texture analysis.
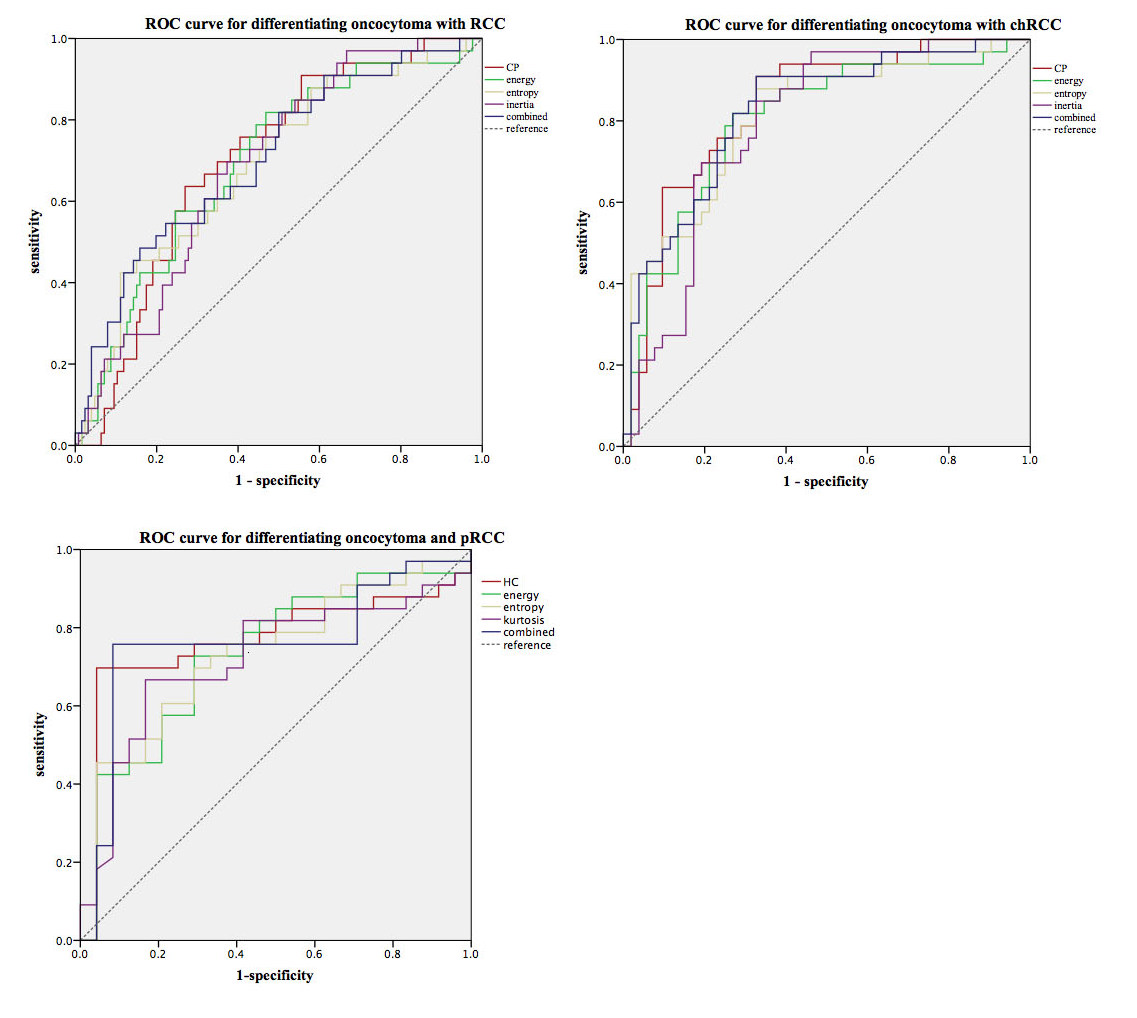
Figure 2 ROC of MR texture parameters for diagnosis renal oncocytoma.
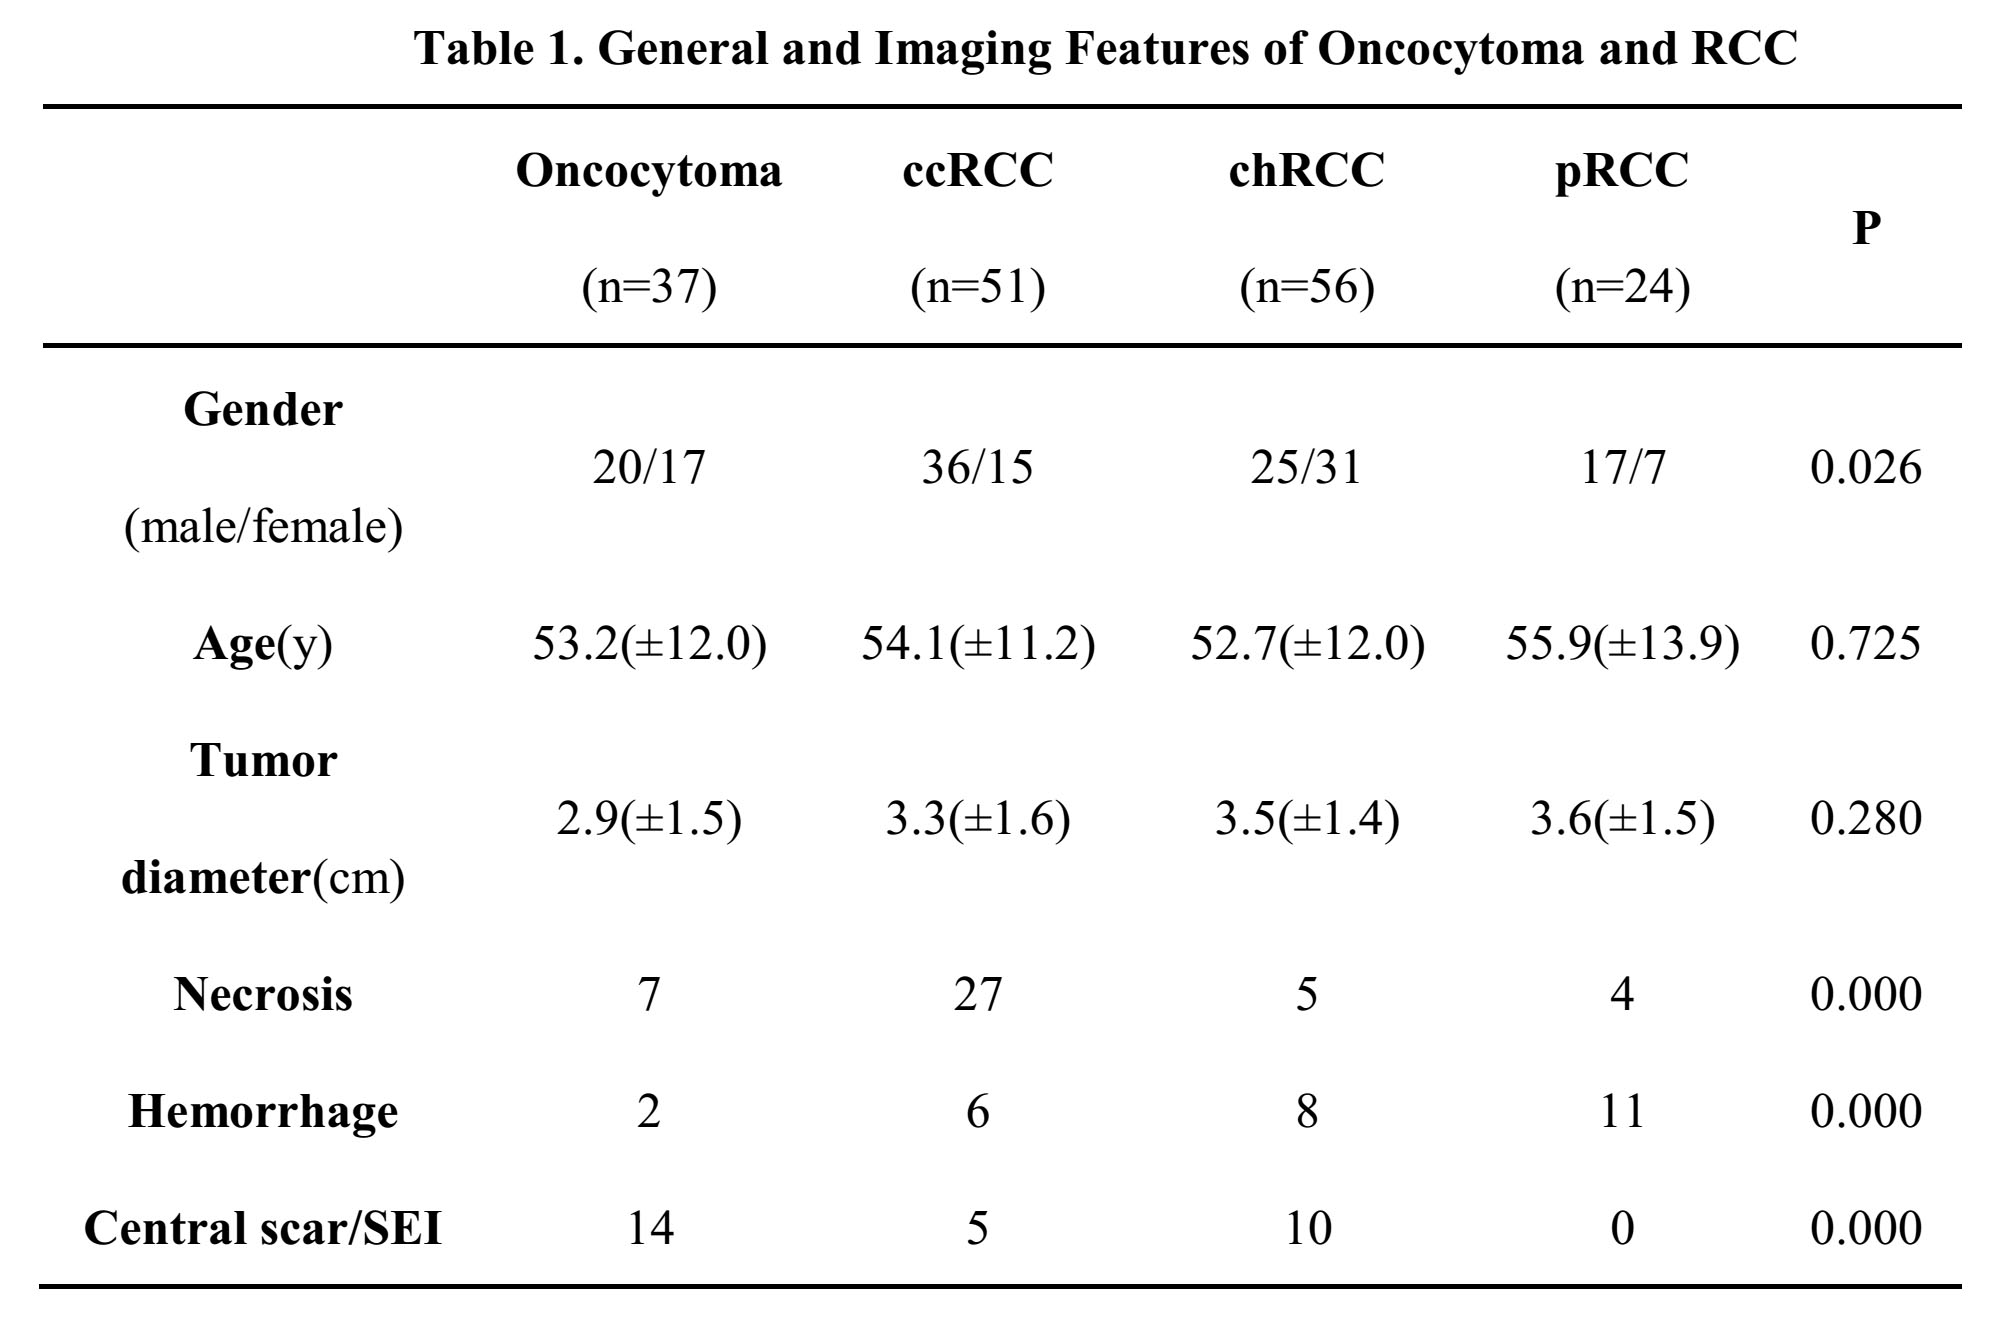
Table 1
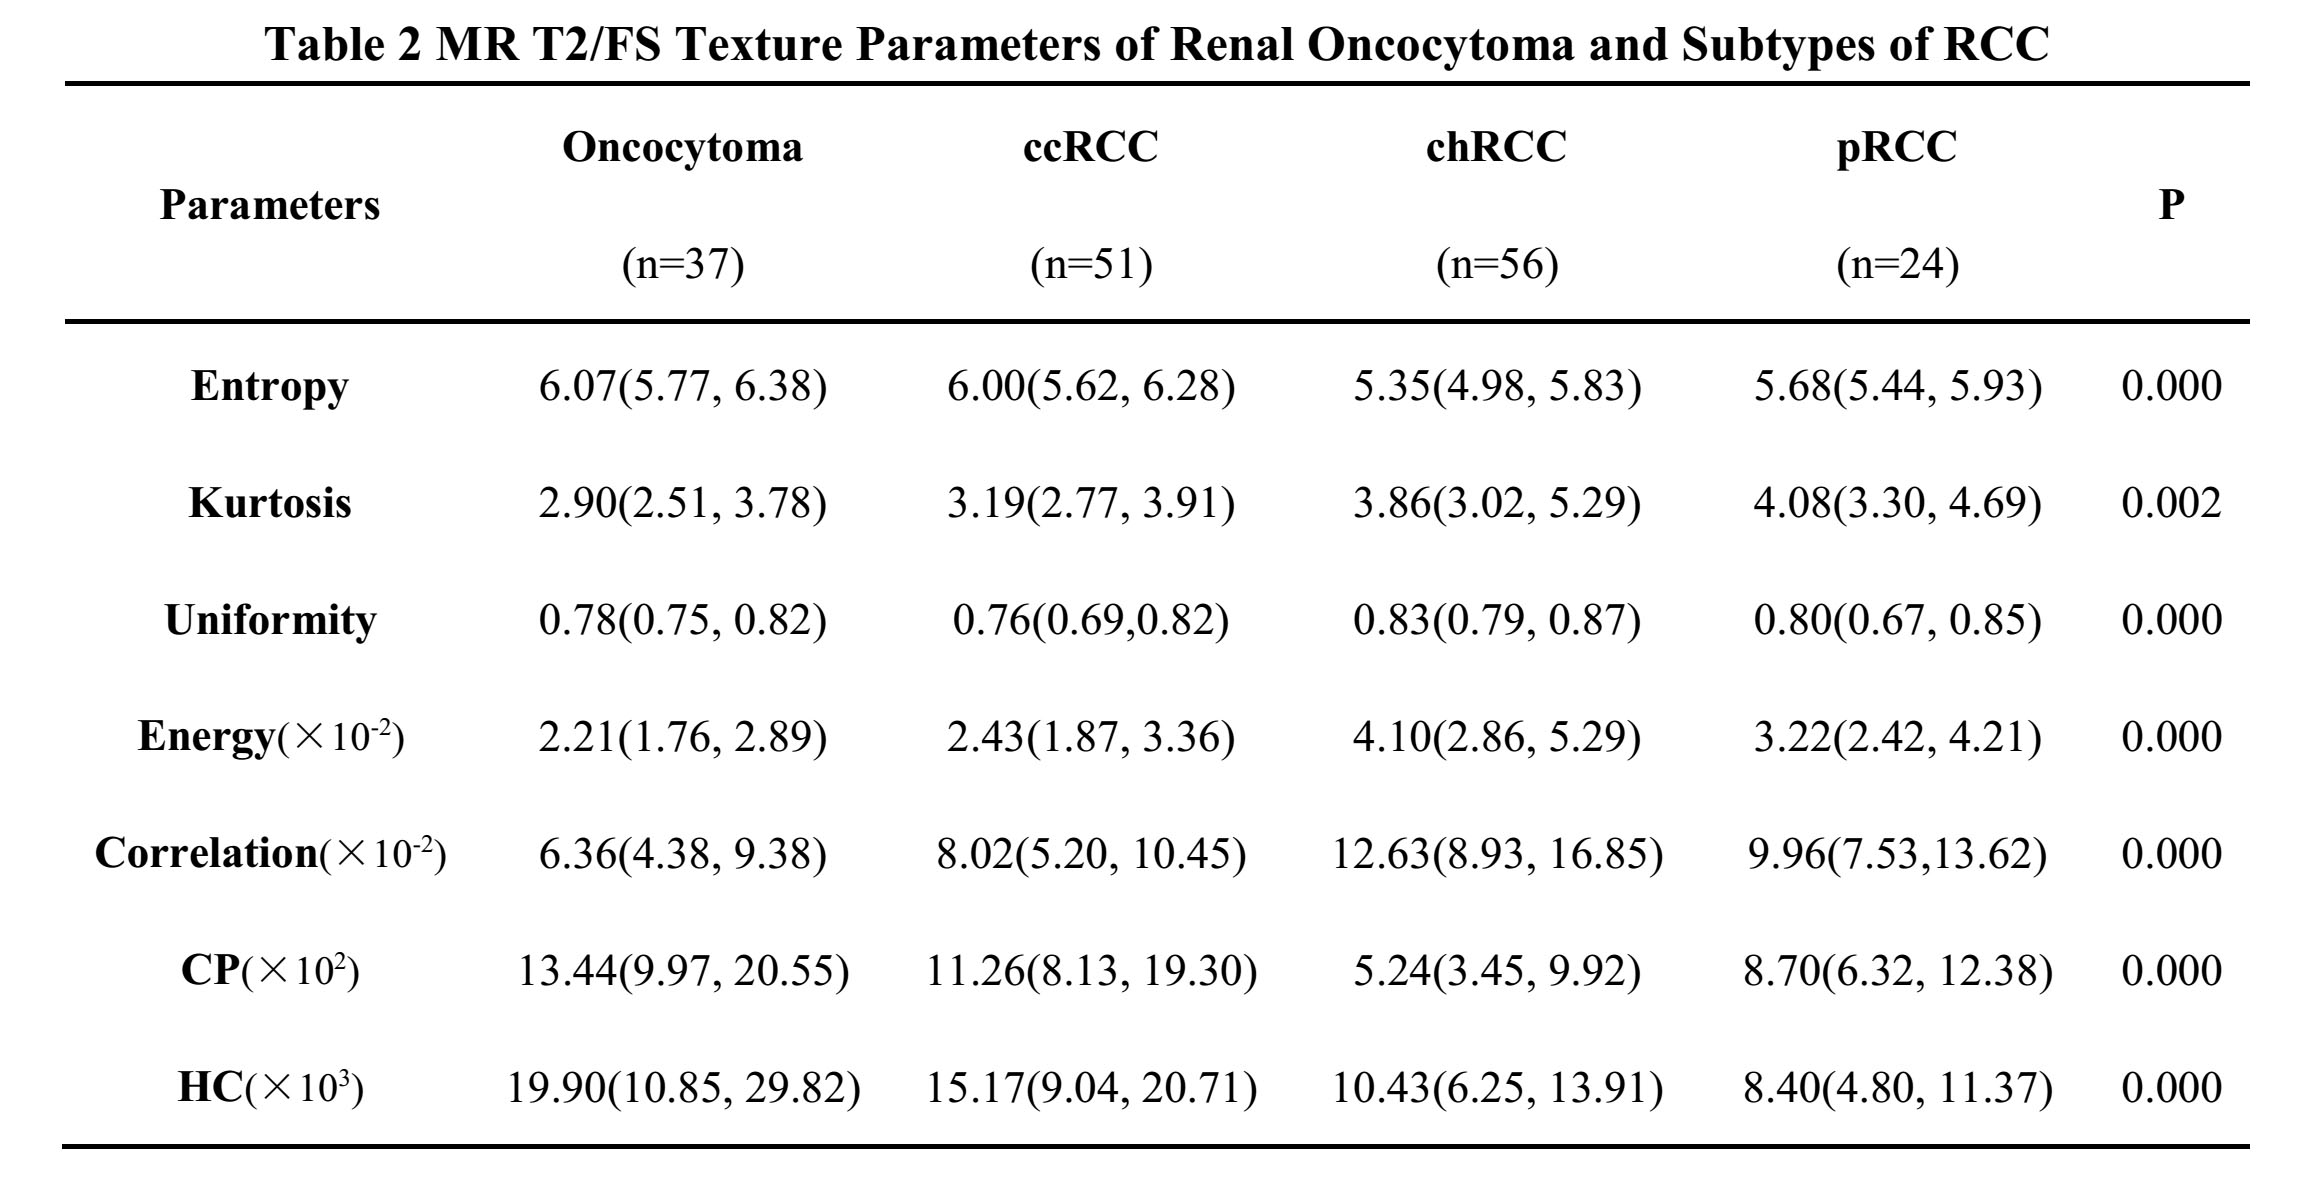
Table 2
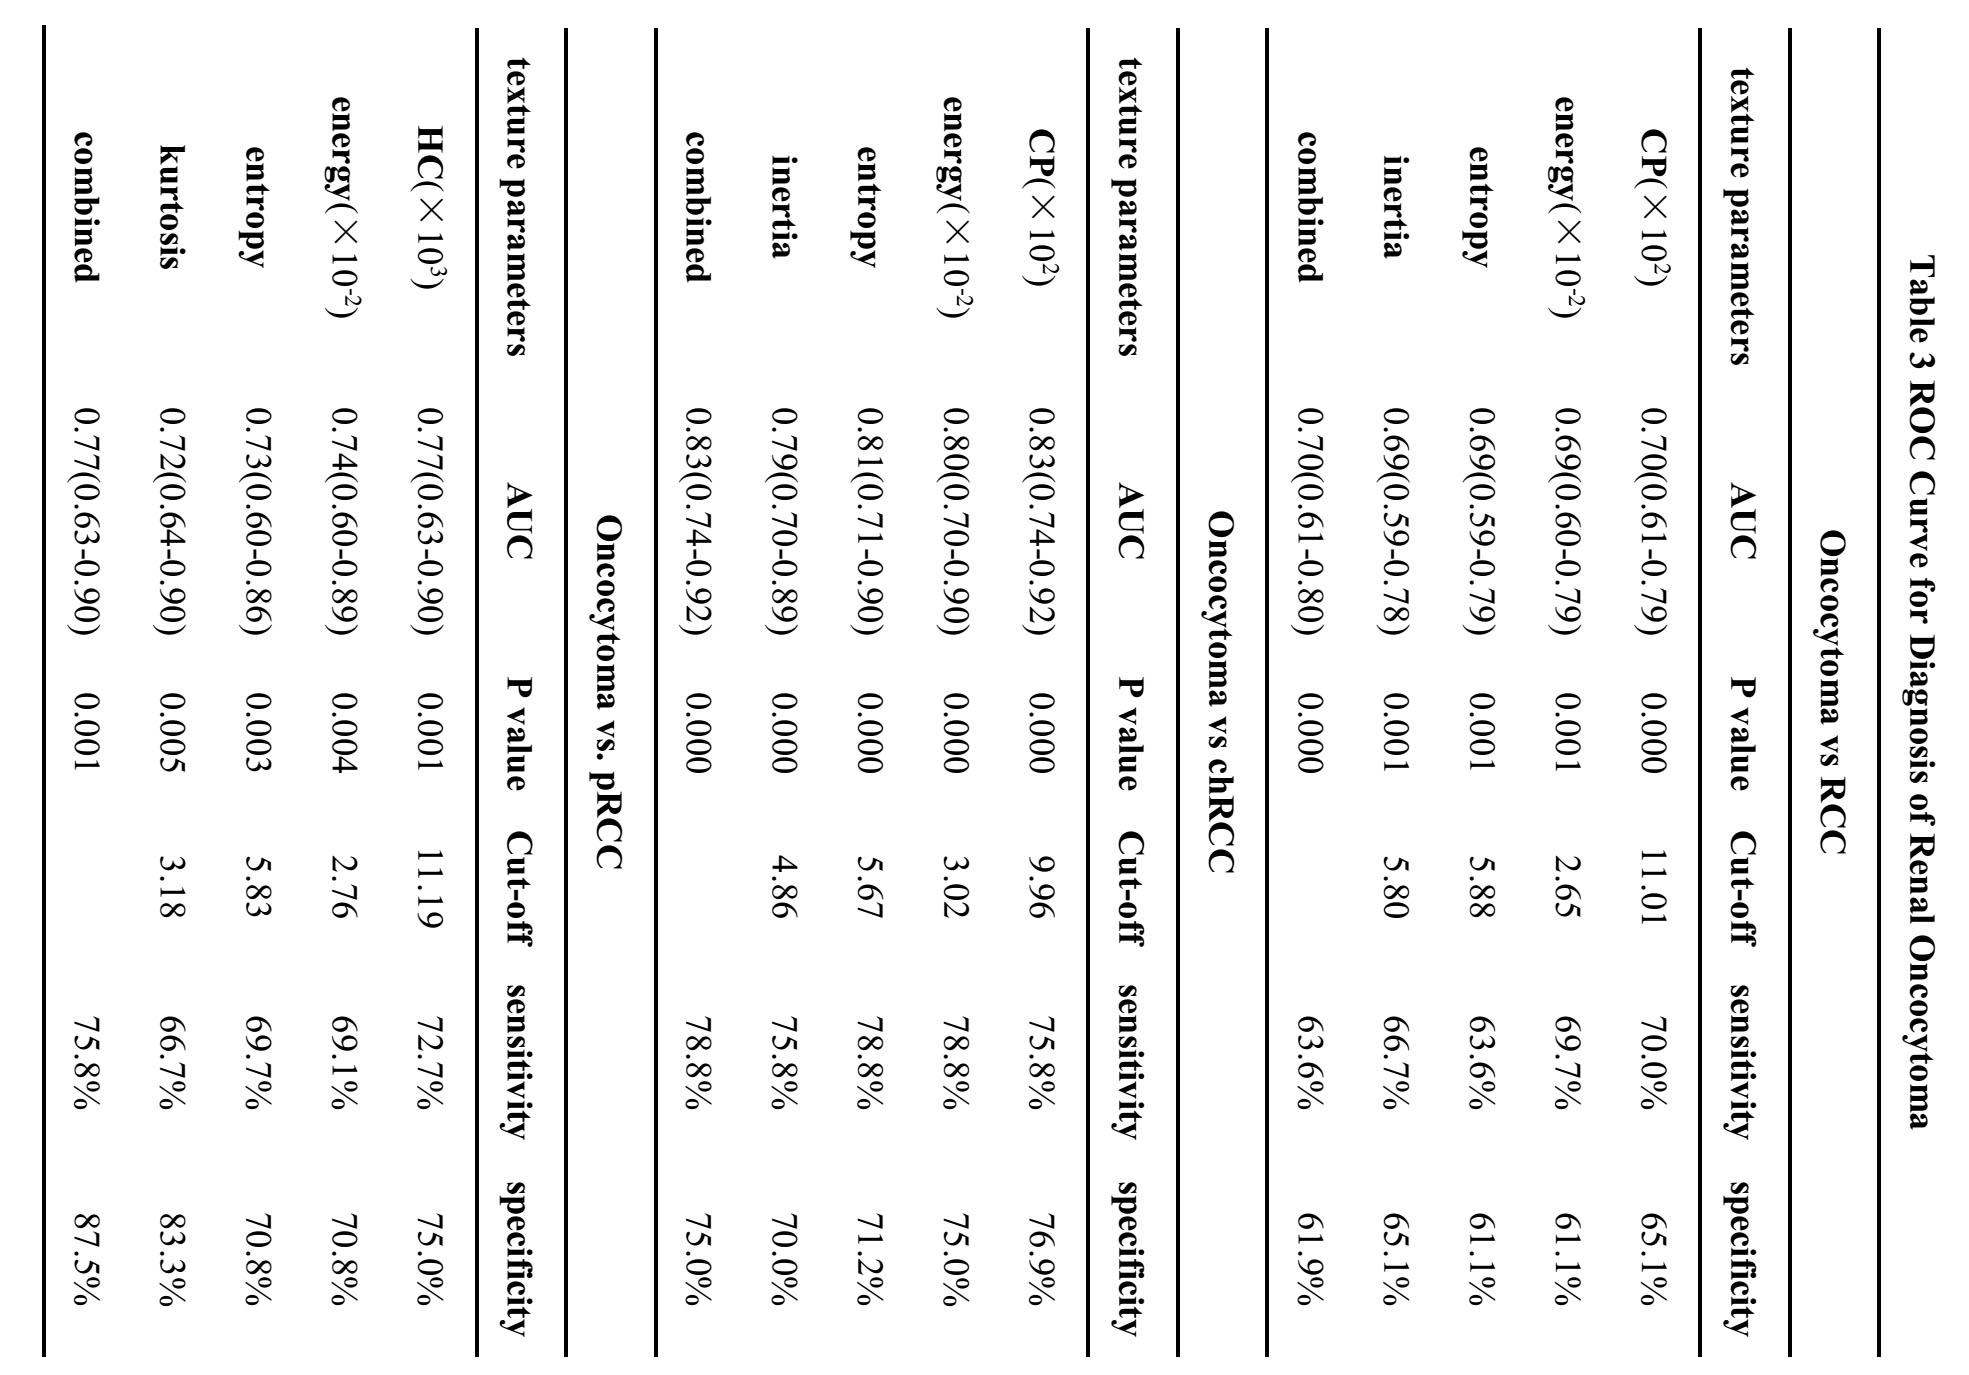
Table 3