1206
Radiomic analysis of MRI in Clear Cell Renal Carcinoma: Non-invasive prediction of High Grade Histology1Radiology, UT Southwestern Medical Center, Dallas, TX, United States, 2Clinical Science, UT Southwestern Medical Center, Dallas, TX, United States, 3Advanced Imaging Research Center, UT Southwestern Medical Center, Dallas, TX, United States, 4Urology, UT Southwestern Medical Center, Dallas, TX, United States, 5Pathology, UT Southwestern Medical Center, Dallas, TX, United States, 6Kidney Cancer Program, UT Southwestern Medical Center, Dallas, TX, United States
Synopsis
Clear cell RCC (ccRCC), the most common and aggressive subtype of kidney cancer is a very
Introduction
Renal cell carcinoma (RCC) is the most common malignant tumor of the kidney.1 Among RCC subtypes, clear cell RCC (ccRCC) is the most common (65%–70%) and aggressive subtype of RCC. Percutaneous biopsies are accurate for diagnosing RCC. However, their reliability to accurately determine the histologic subtype and, importantly, the nuclear grade in larger, heterogeneous tumors is likely over-estimated. Intratumoral heterogeneity, a hallmark of ccRCC, likely reduces the diagnostic performance of percutaneous biopsies.2 Alternatively, a clear cell likelihood score (ccLS) using magnetic resonance imaging (MRI) with T2-weighted (T2W) and contrast enhanced imaging has been proposed for the diagnosis of ccRCC among renal masses. 3 Intense enhancement on an appropriately-timed MR acquisition during the corticomedullary phase allows for distinction of ccRCC from other subtypes, 4,5 emphasizing the growth dependency of ccRCC on activation of the angiogenesis pathway. 6 While the MRI-based ccLS offers reasonable diagnostic accuracy for ccRCC, it does not provide information about tumor grade. Quantitative tools to measure tumor imaging characteristics may assist to differentiate more indolent from aggressive forms of ccRCC. The purpose of our study was to assess the diagnostic performance of MRI-based first- and second-order statistics to predict high-grade ccRCC.Methods
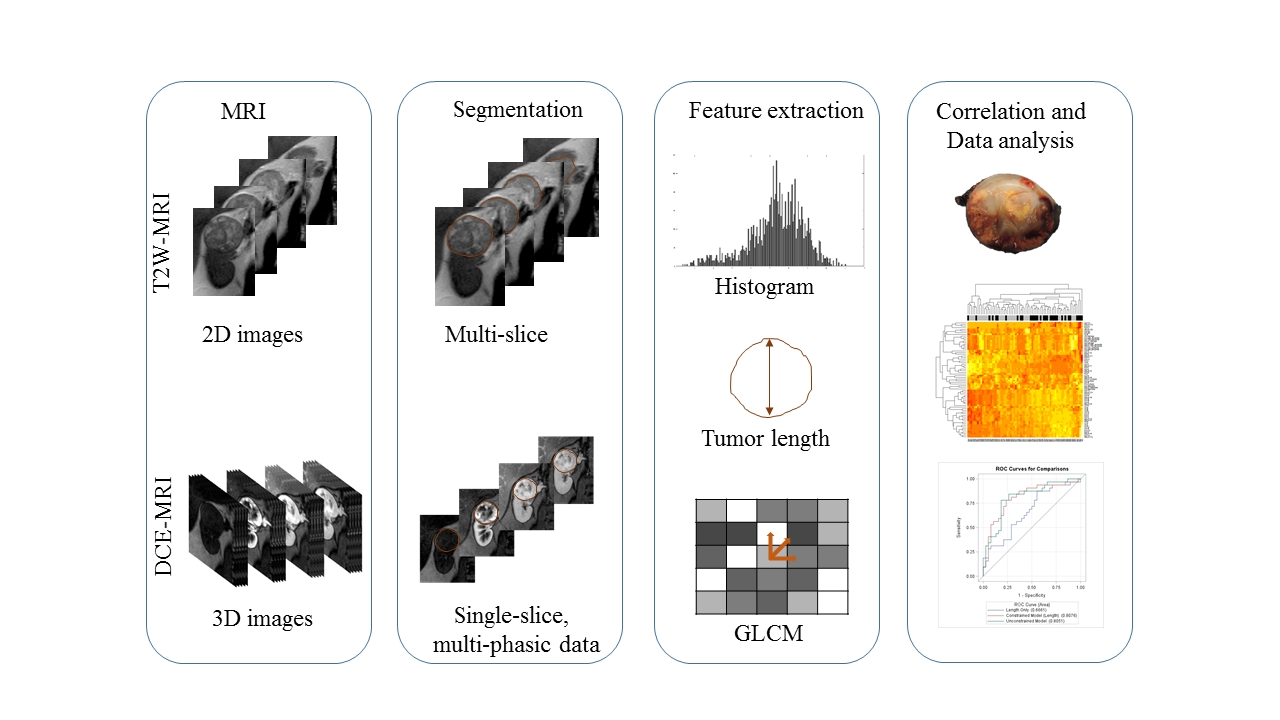
This IRB-approved, HIPAA-compliant prospective study included 70 ccRCC patients (18 female; 52 male; range 32-82 years) who signed informed consent prior to imaging. 3T MRI (Ingenia, Philips Healthcare) was performed with a dStream anterior/posterior torso coils: 1) coronal 2D T2W half-Fourier single-shot turbo spin-echo (SShTSE): (TR/TE) = 1115/80ms, flip angle (FA) = 90o, thickness = 5 mm, field of view (FOV) = 402 x 340 mm2, matrix = 284 x 268, bandwidth = 467 Hz per pixel. 2) coronal 3D T1-weighted spoiled gradient-echo (SPGR) with 3 different flip angles (FA: 10o, 5o, and 2o) to generate T1 maps. 3) dynamic contrast enhanced (DCE)-MRI after the injection of 0.1 mmol/kg of body weight of gadobutrol (Gadavist; Bayer Healthcare) at a rate of 2 mL/second with the same SPGR acquisition: TR/TE = 3/1.53 ms, FA = 10o, slice thickness = 5 mm, FOV = 180 x 408 mm2, matrix = 120 x 288, bandwidth = 1326 Hz per pixel. Total acquisition time for DCE-MRI was 5 min 45 sec with 5 sec temporal resolution. After surgery, all tumors were graded following the International Society of Urological Pathology (ISUP) grading system (High grade (HG) = ISUP grade 3-4; Low grade (LG) = ISUP grade 1-2). Tumors were manually segmented on OsiriX MD DICOM viewer. Maximum tumor length was recorded. A region of interest (ROI) was drawn to include the entire tumor on the center slice of the tumor, both on T2W and on each of the 4 phases (pre-contrast, corticomedullary (CM), nephrographic (NG), and delayed nephrographic (Dld) phases) selected from the DCE-MRI. An OsiriX-based plugin (pyOsiriX) and an open-source Python library (Mahotas) were used to extract Haralick texture features following the image biomarker standardization initiative (IBSI) guidelines.7 Pixel-by-pixel data was extracted for all the ROIs and tumor intensity characteristics were quantified by histogram-based first-order statistics. A total of 85 first- and second-order features were included. A clustering algorithm was applied to reduce the number of features. Three logistic regression models were evaluated and cross-validated using the leave-one-out method: 1) a univariate logistic regression model with tumor length only; 2) a multivariable logistic regression model with stepwise selection restricted to include tumor length; 3) a multivariable logistic regression model with stepwise selection with no restriction. The false discovery rate (FDR) adjusted p-values are reported.Results
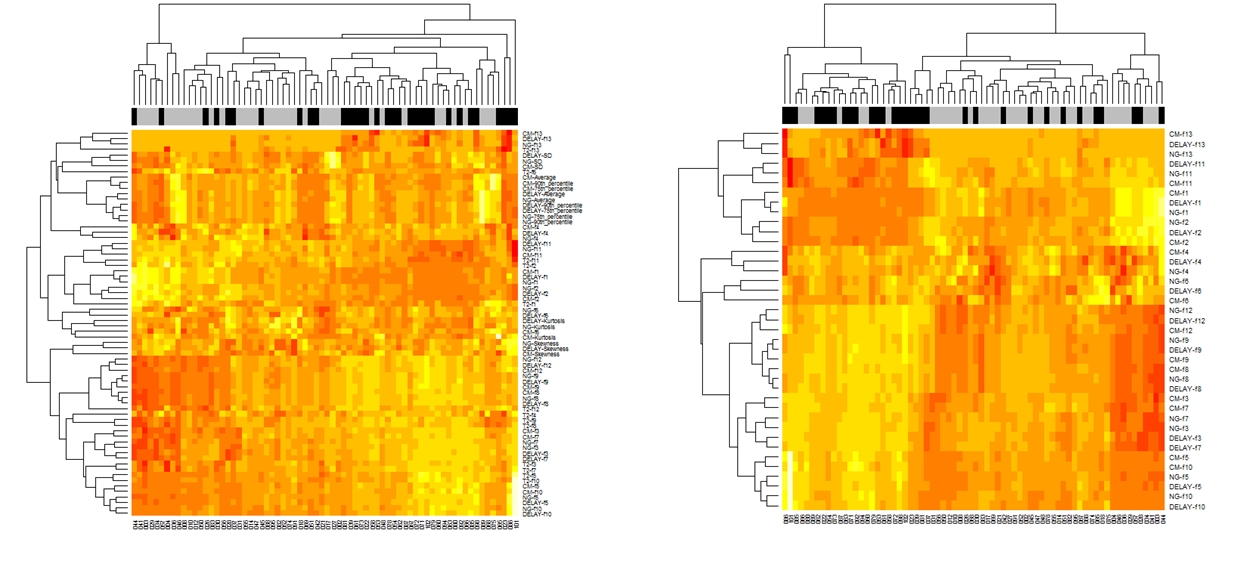
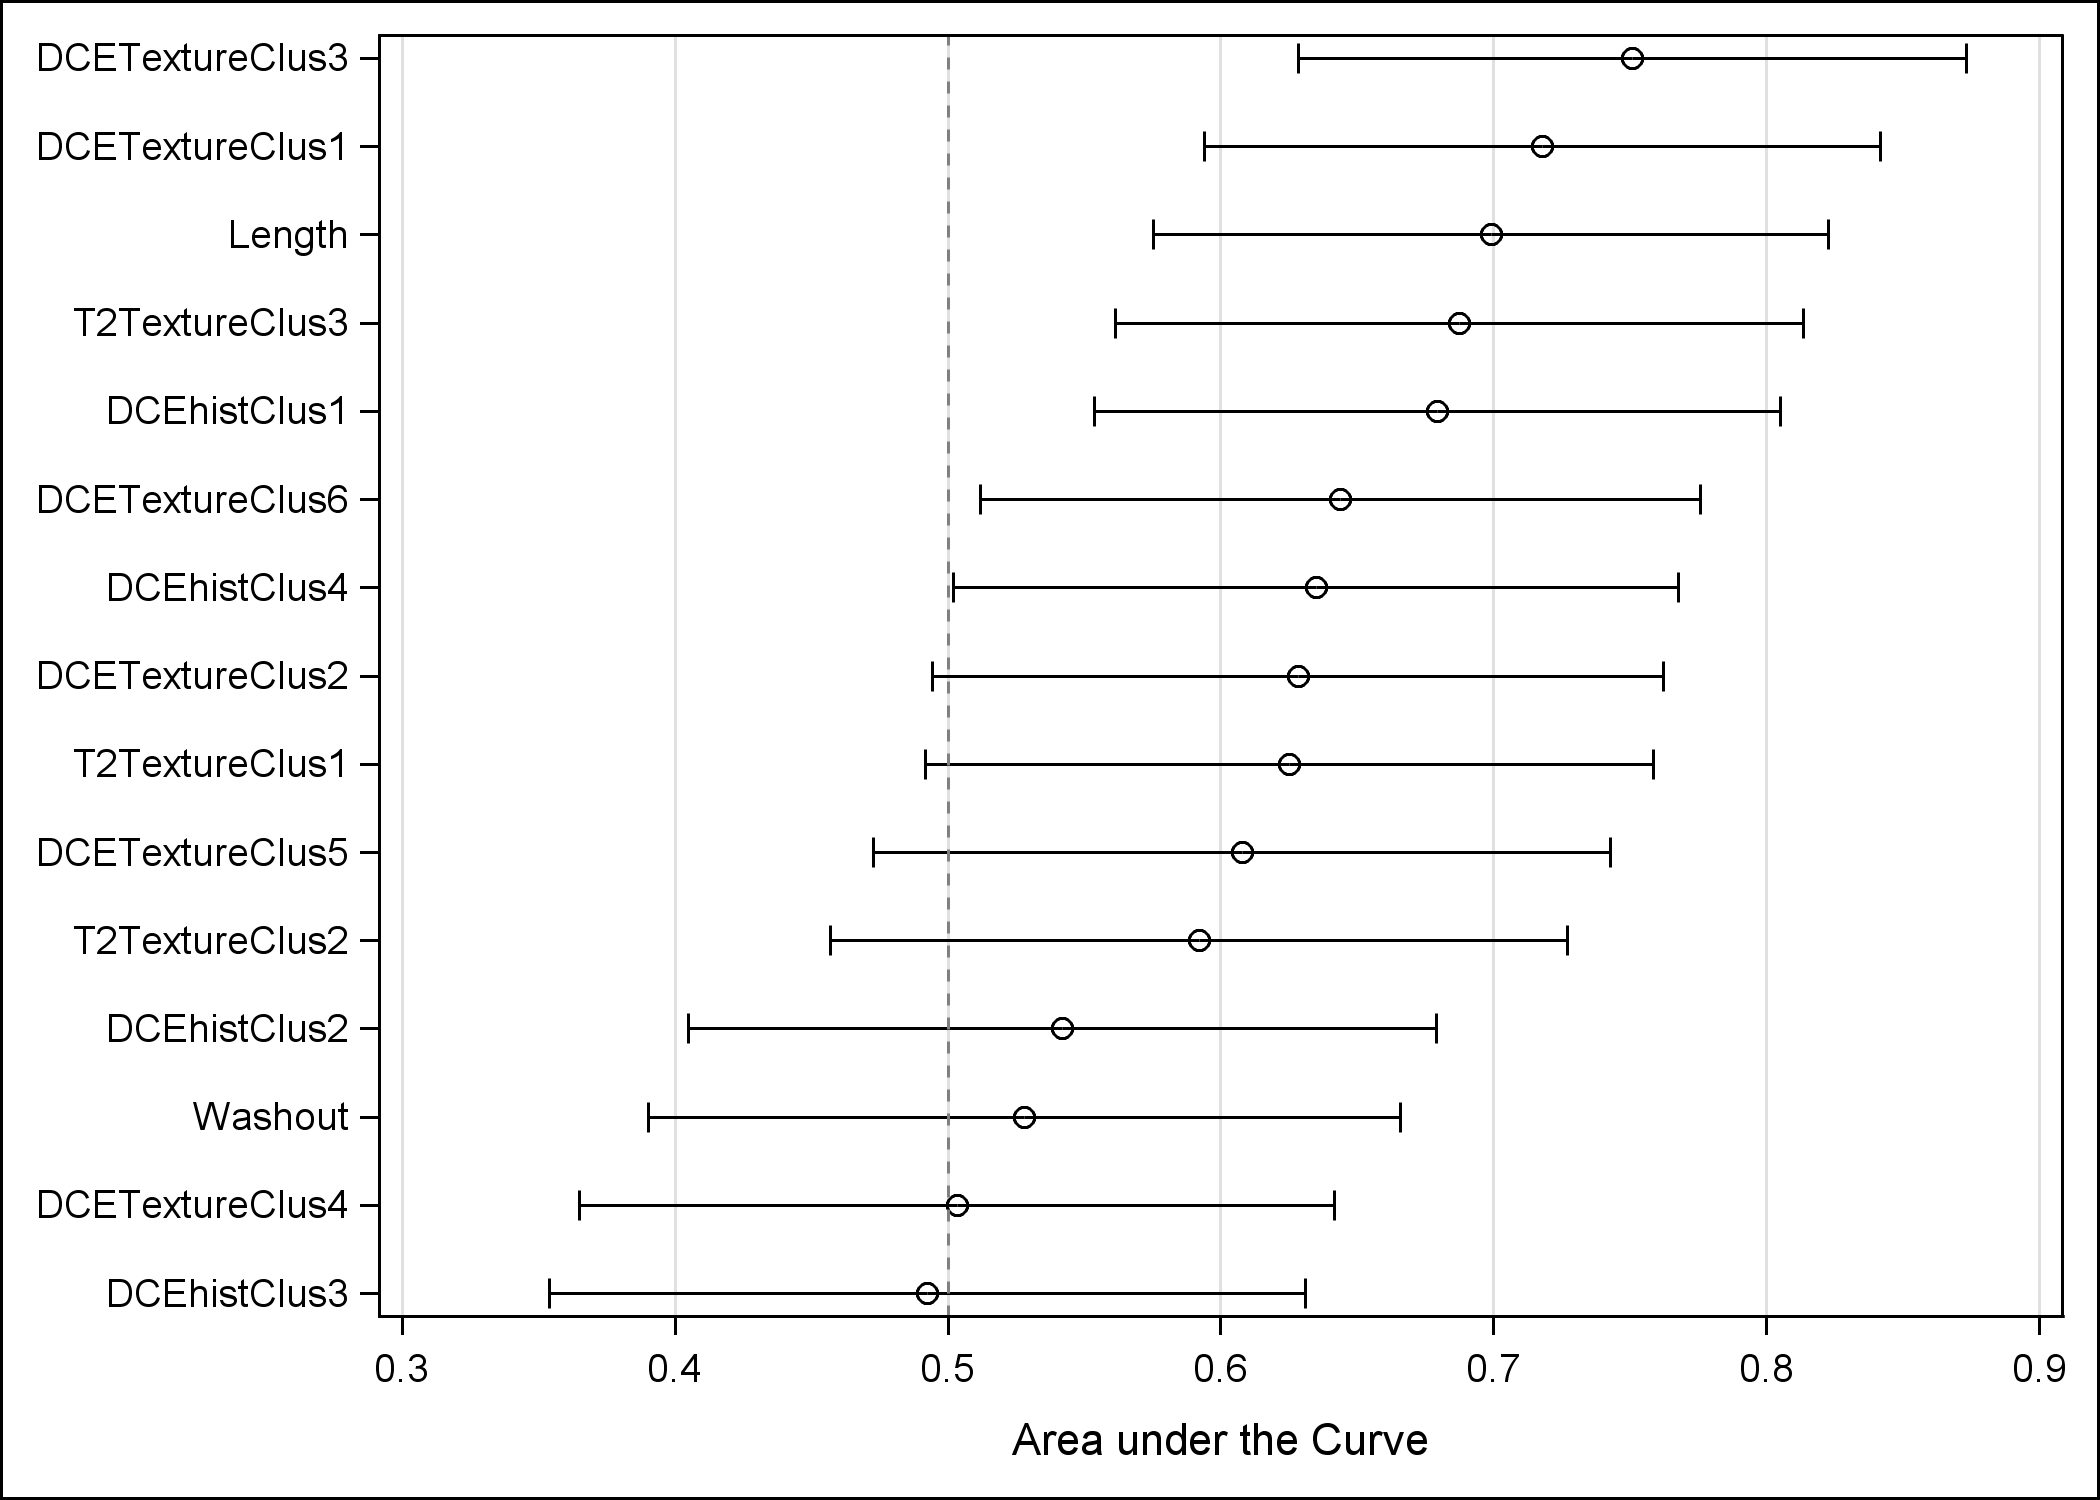
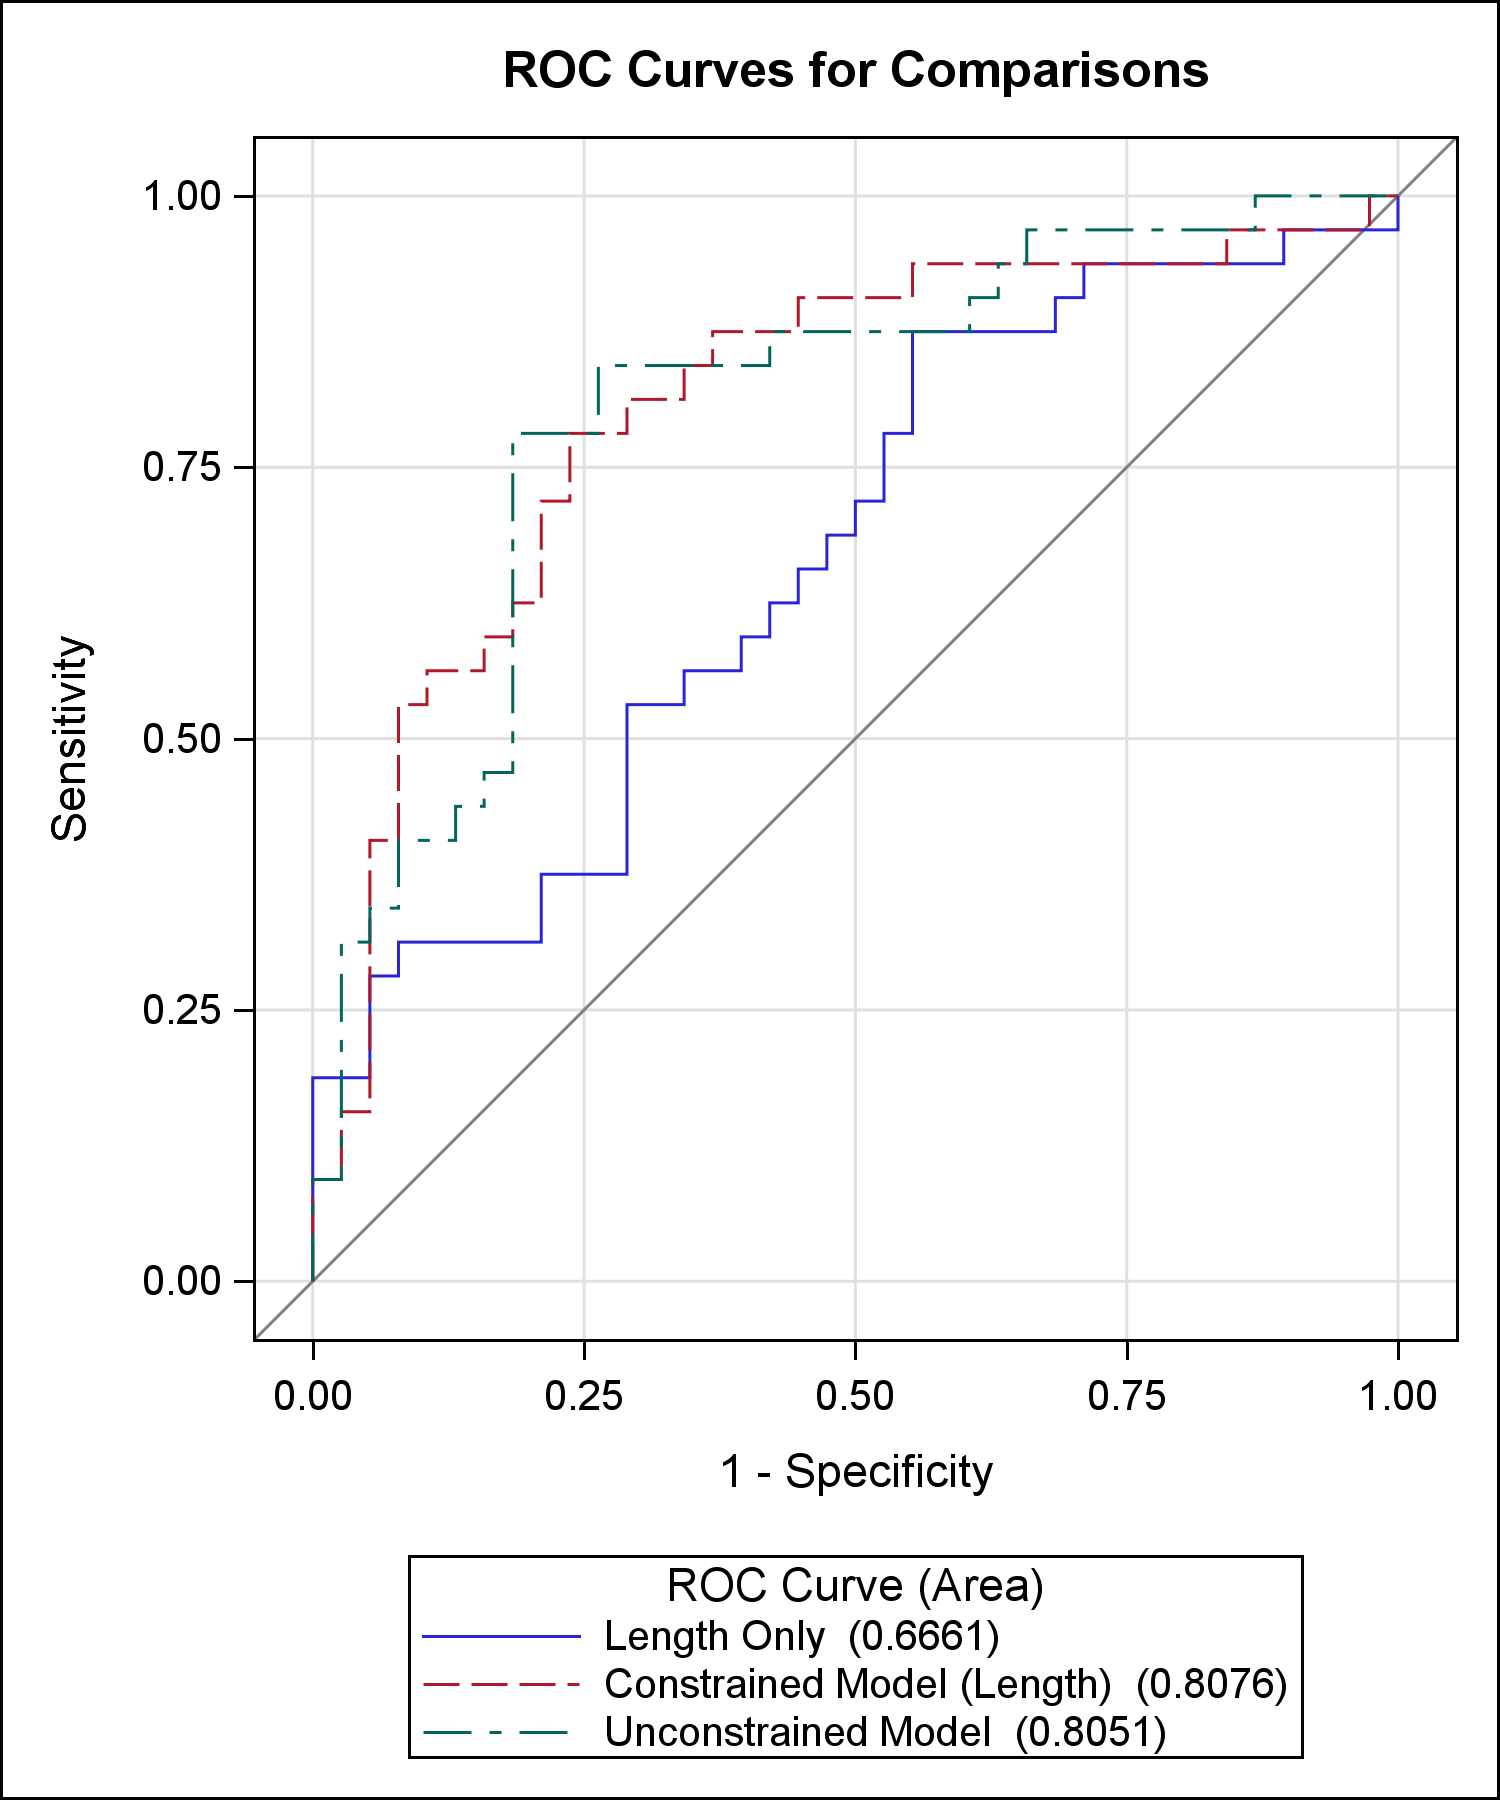
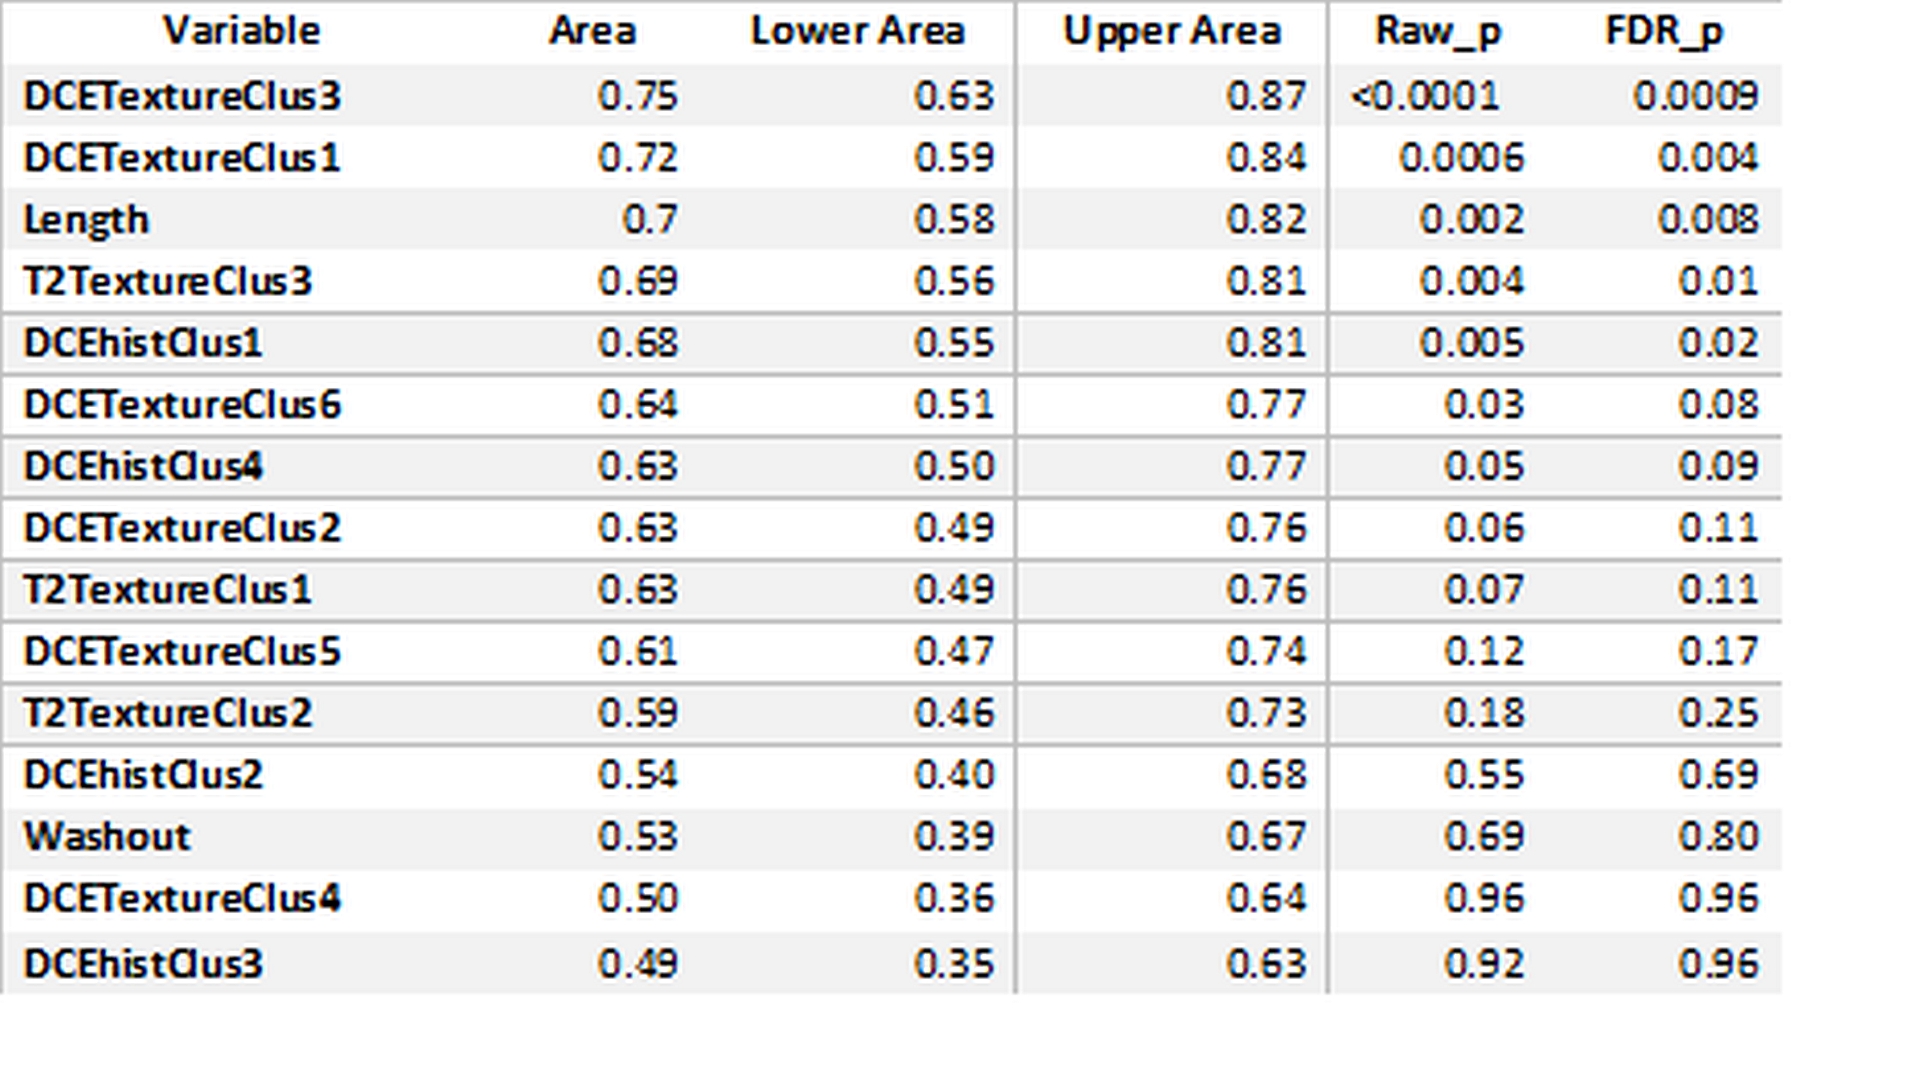
Workflow is presented in Figure 1. Heat map generated using distance clustering method shows the association of the radiomic features and ISUP grades (Figure 2). Performance of various histogram and texture features are summarized in Table 1. The area under the curve (AUC) for DCE texture cluster 3 was 0.75 (95% confidence interval (CI), 0.63-0.87, FDR p- value = 0.0009) for differentiating low grade with high grade ccRCC (Fig 3). The AUC for the tumor length alone data was 0.70 (95% CI, 0.58-0.82, FDR p- value = 0.008). Three models were validated in predicting the low vs high grade ccRCC using the logistic regression model. AUC was 0.67 (95% CI 0.54, 0.79) for model 1, 0.81 for model 2, and 0.81 for model 3 (Figure 4).Conclusion
DCE-MRI histogram and texture features extracted from T2W and DCE MRI provided reasonable differentiation between low and high grade ccRCC. Our findings suggest that radiomics analysis may be a valuable adjunct to standard interpretation of clinical MRI for the characterization of ccRCC.Acknowledgements
Funding Sources: NIH grants R01 5RO1CA154475 and P50CA196516.References
1. Gerlinger M, Rowan AJ, Horswell S, et al. Intratumor heterogeneity and branched evolution revealed by multiregion sequencing. N Engl J Med 2012; 366(10): 883-892.
2. De Sousa EMF, Vermeulen L, Fessler E, Medema JP. Cancer heterogeneity - a multifaceted view. EMBO Rep 2013; 14(8): 686-695.
3. Canvasser NE, Kay FU, Xi Y, Pinho DF, Costa D, de Leon AD, Khatri G, Leyendecker JR, Yokoo T, Lay A, Kavoussi N, Koseoglu E, Cadeddu JA, Pedrosa I. Diagnostic Accuracy of Multiparametric Magnetic Resonance Imaging to Identify Clear Cell Renal Cell Carcinoma in cT1a Renal Masses. J Urol. 2017; 198(4):780-786.
4. Sun MR, Ngo L, Genega EM, Atkins MB, Finn ME, Rofsky NM, Pedrosa I. Renal cell carcinoma: dynamic contrast-enhanced MR imaging for differentiation of tumor subtypes--correlation with pathologic findings. Radiology. 2009; 250(3):793-802.
5. Kay FU, Canvasser NE, Xi Y, Pinho DF, Costa DN, Diaz de Leon A, Khatri G, Leyendecker JR, Yokoo T, Lay AH, Kavoussi N, Koseoglu E, Cadeddu JA, Pedrosa I. Diagnostic Performance and Interreader Agreement of a Standardized MR Imaging Approach in the Prediction of Small Renal Mass Histology. Radiology. 2018; 287(2):543-553.
6. Rosen MA, Schnall MD. Dynamic contrast-enhanced magnetic resonance imaging for assessing tumor vascularity and vascular effects of targeted therapies in renal cell carcinoma. Clin Cancer Res. 2007; 13(2 Pt 2):770s-776s.
7. Zwanenburg A, Leger S, Vallières M, Löck S. Image biomarker standardisation initiative. arXiv:1612.07003. 201.
Figures