1204
Renal multi-parametric MRI: Ready to launch? A reproducibility study1Radiology, University Medical Center Utrecht, Utrecht University, Utrecht, Netherlands, 2Nephrology, University Medical Center Utrecht, Utrecht University, Utrecht, Netherlands, 3Radiology, C.J. Gorter Center for high field MRI, Leiden University Medical Center, Leiden, Netherlands
Synopsis
Functional MRI of the kidneys is a promising tool for diagnosis, prognosis and treatment monitoring in kidney disease, but there is urgent need for technical validation of renal MRI parameters, including reproducibility. We performed repeated measurements of a multi-parametric renal MRI protocol, including oxygenation, diffusion, perfusion and relaxometry, in healthy volunteers at 3T. This allows for mutual comparison of parameters in terms of reproducibility. As a first step to large scale studies, we have determined reproducibility and shown feasibility of renal quantitative, multi-parametric MRI within a clinically acceptable scan time.
Introduction
Functional MRI of the kidneys is a promising tool for diagnosis, prognosis and treatment monitoring in kidney disease.1 As recently stated by a collaboration of kidney MRI researchers, PARENCHIMA (EU-COST CA16103), there is urgent need for technical validation of renal MRI parameters, including reproducibility, as a first step towards large-scale clinical studies.1 Here, we pave the way for such studies by an analysis of reproducibility of multi-parametric renal MRI data, including relaxometry, perfusion, diffusion and oxygenation measurements in middle-aged healthy volunteers.Methods
Healthy volunteers were included and scanned twice at the same time of the day in two separate visits. Subjects were asked to drink two liters of non-alcoholic liquids and to avoid salt and protein rich meals on the day of examination. Before the first scan, blood was sampled to measure plasma creatinine. Data was acquired on a 3T MR system (Ingenia, Philips Healthcare, Best, the Netherlands; software release 5.3.1). The multi-parametric protocol comprised T1 and T2 weighted imaging and a quantitative Dixon scan, T1, T2 and R2* mapping (BOLD), diffusion weighted imaging (DWI), arterial spin labeling (ASL), phase-contrast as well as dynamic contrast-enhanced imaging. Total acquisition time was 48 minutes. Results of the relaxometry, ASL and DWI are presented here. An overview of scan parameters of these sequences is provided in table 1.
Data processing was performed using in-house developed software in Matlab (MathWorks, Natick, MA, USA, version 2015b), Mathematica (Wolfram, Oxfordshire, UK, version 11; diffusion fit) and MeVisLab (Mevis Medical Solutions, Bremen, Germany, version 2.8.2; ASL fit). Processing was performed separately for each kidney and consisted of semi-automated segmentation2, image registration and model fitting. For relaxometry, single-exponential decay models were used. ASL was fitted using the Buxton model, for which perfusion (F) and bolus arrival time (BAT) are reported. Diffusion data was fitted using a diffusion tensor model for which mean diffusivity (MD) and fractional anisotropy (FA) are reported.3
Bland-Altman analysis was performed, including scatter plots and calculation of within-subject coefficients of variation (CoVw) and repeatability coefficients (RC). RCs give the expected range of the repeated measurement in 95% of subjects.
Results
Fourteen subjects were included (mean age 48 years, range 40-61, 6 male) with a mean eGFR of 92 (sd 9) mL/min/1.73m2. Apart from 3 subjects scanned at intervals of 4, 14 and 47 days, all subjects were scanned at a one-week interval. An overview of the obtained parameter maps is presented in figure 1, together with the corresponding scatter plots. On the color maps, a clear difference between both scans is only seen in the perfusion map. Bland-Altman plots, including limits of agreement, are shown for relaxometry (figure 2) and DTI (figure 3a-d) and ASL (figure 3e-f). RCs for the multi-parametric protocol varied from 6.0-7.2% (CoVw 2.2-2.6%) for T1/T2-mapping, 6.6-18% (CoVw 2.3-6.5%) for BOLD and DTI and were around 30% (CoVw ~11%) for ASL (table 2). Systematic bias varied from -4.5-2.1%, with the largest bias in cortical T1 measurements.Discussion and conclusion
We present repeated measurements of a multi-parametric renal MRI protocol, allowing for mutual comparison of parameters in terms of reproducibility. Lowest RCs were observed in T1 and T2 mapping. T1 values were relatively high compared to literature values4 and had lowest RC, but the clear negative bias in T1 values cannot be ignored. After ruling out other causes, we hypothesize that remaining contrast agent of the previous visit might play a role, but this is subject to further investigation. Reproducibility of BOLD and DTI showed CoVws in line with literature values.5,6 Reproducibility of ASL measurements was less, but in line with literature, reporting CoVws ranging from 7.9-17.6% at 3T (the latter within visit).7 The large variability in perfusion measurements is likely multifactorial. A low SNR is inherent to ASL. Labelling efficiency might be influenced by magnetic field inhomogeneity, due to trapped air in stomach and bowel. A large difference between cortex and medulla increases sensitivity to ROI setting. Physiological variability in renal blood flow might also play a role. There is also an effect of the scan protocol itself on absolute perfusion values: lower values are measured in the initial four subjects who were scanned with a slightly different protocol.
Future work will focus on reproducibility over a wider range of eGFR. However, as a first step to large scale studies, we have determined reproducibility and shown feasibility of renal quantitative, multi-parametric MRI within a clinically acceptable scan time.
Acknowledgements
No acknowledgement found.References
1. Selby NM, Blankestijn PJ, Boor P, et al. Magnetic resonance imaging biomarkers for chronic kidney disease: a position paper from the European Cooperation in Science and Technology Action PARENCHIMA. Nephrol Dial Transplant. 2018;33(suppl_2):ii4-ii14.
2. de Boer A, Leiner T, Vink EE, et al. Modified dixon-based renal dynamic contrast-enhanced MRI facilitates automated registration and perfusion analysis. Magn Reson Med. 2018;80(1):66-76. 3. van Baalen S, Leemans A, Dik P, et al. Intravoxel incoherent motion modeling in the kidneys: Comparison of mono-, bi-, and triexponential fit. J Magn Reson Imaging. 2017;46(1):228-39.
4. Wolf M, de Boer A, Sharma K, et al. Magnetic resonance imaging T1- and T2-mapping to assess renal structure and function: a systematic review and statement paper. Nephrol Dial Transplant. 2018;33(suppl_2):ii41-ii50. 5. Pruijm M, Mendichovszky IA, Liss P, et al. Renal blood oxygenation level-dependent magnetic resonance imaging to measure renal tissue oxygenation: a statement paper and systematic review. Nephrol Dial Transplant. 2018;33(suppl_2):ii22-ii8.
6. Caroli A, Schneider M, Friedli I, et al. Diffusion-weighted magnetic resonance imaging to assess diffuse renal pathology: a systematic review and statement paper. Nephrol Dial Transplant. 2018;33(suppl_2):ii29-ii40.
7. Odudu A, Nery F, Harteveld AA, et al. Arterial spin labelling MRI to measure renal perfusion: a systematic review and statement paper. Nephrol Dial Transplant. 2018;33(suppl_2):ii15-ii21.
8. Ordidge RJ, Gibbs P, Chapman B, et al. High-speed multislice T1 mapping using inversion-recovery echo-planar imaging. Magn Reson Med. 1990;16(2):238-45.
Figures
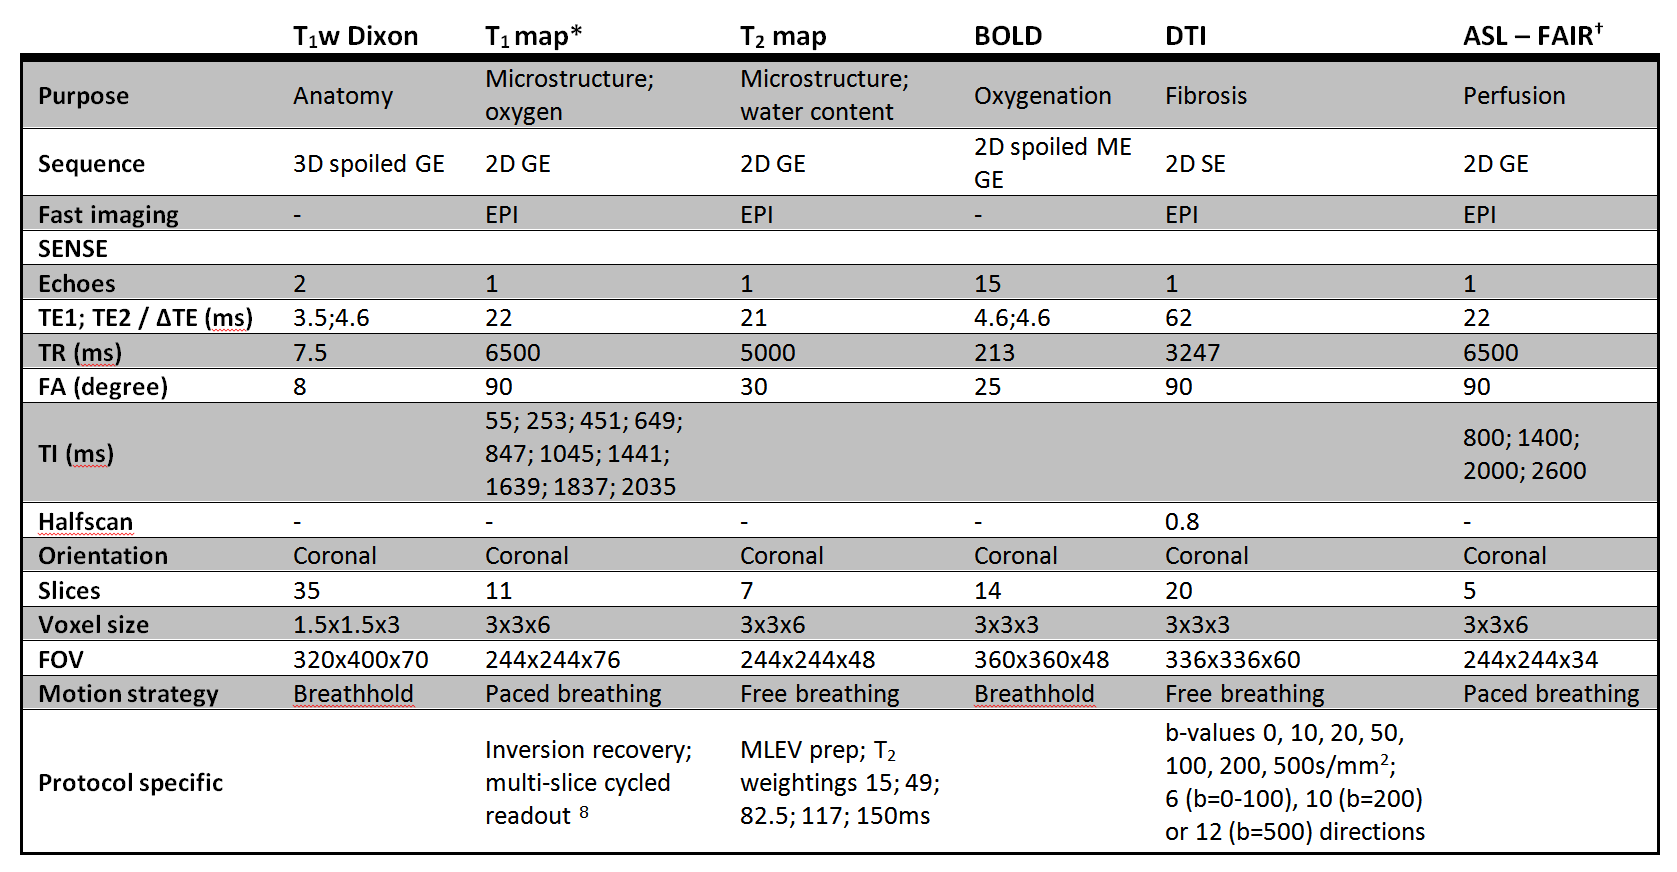
Table 1: Scan parameters. *) Initial four subjects scanned with slightly different settings: T1 map with 7 slices and 7 inversion times ranging from 105-1713ms; †) initial four subjects scanned with slightly different settings: TIs 500; 700; 900; 1100 and 1800ms and 4 (TI 500-11) or 20 (TI 1800) dynamics per TI.
FAIR: flow alternating inversion recovery; GE gradient echo; ME multi echo; SE spin echo; EPI echo planar imaging; TE echo time; TR repetition time; FA flip angle; TI inversion time; FOV field of view; MLEV Malcolm-Levitt
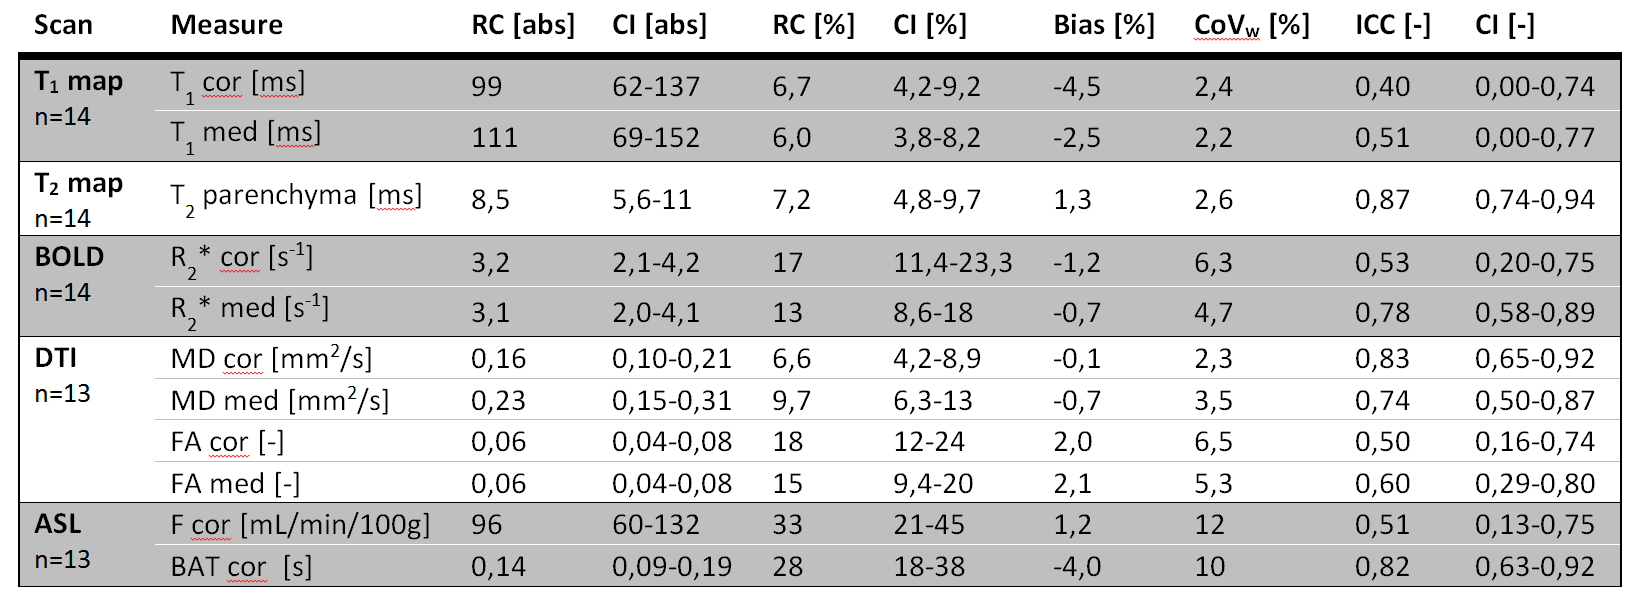
Table 2: RCs, CoVws and intraclass correlation coefficients (ICC) in both absolute and relative units for all measurements.
RC repeatability coefficient; CI confidence interval; CoVw
within subject coefficient of variation; BOLD blood oxygen level-dependent; DTI diffusion tensor imaging; ASL arterial spin labeling
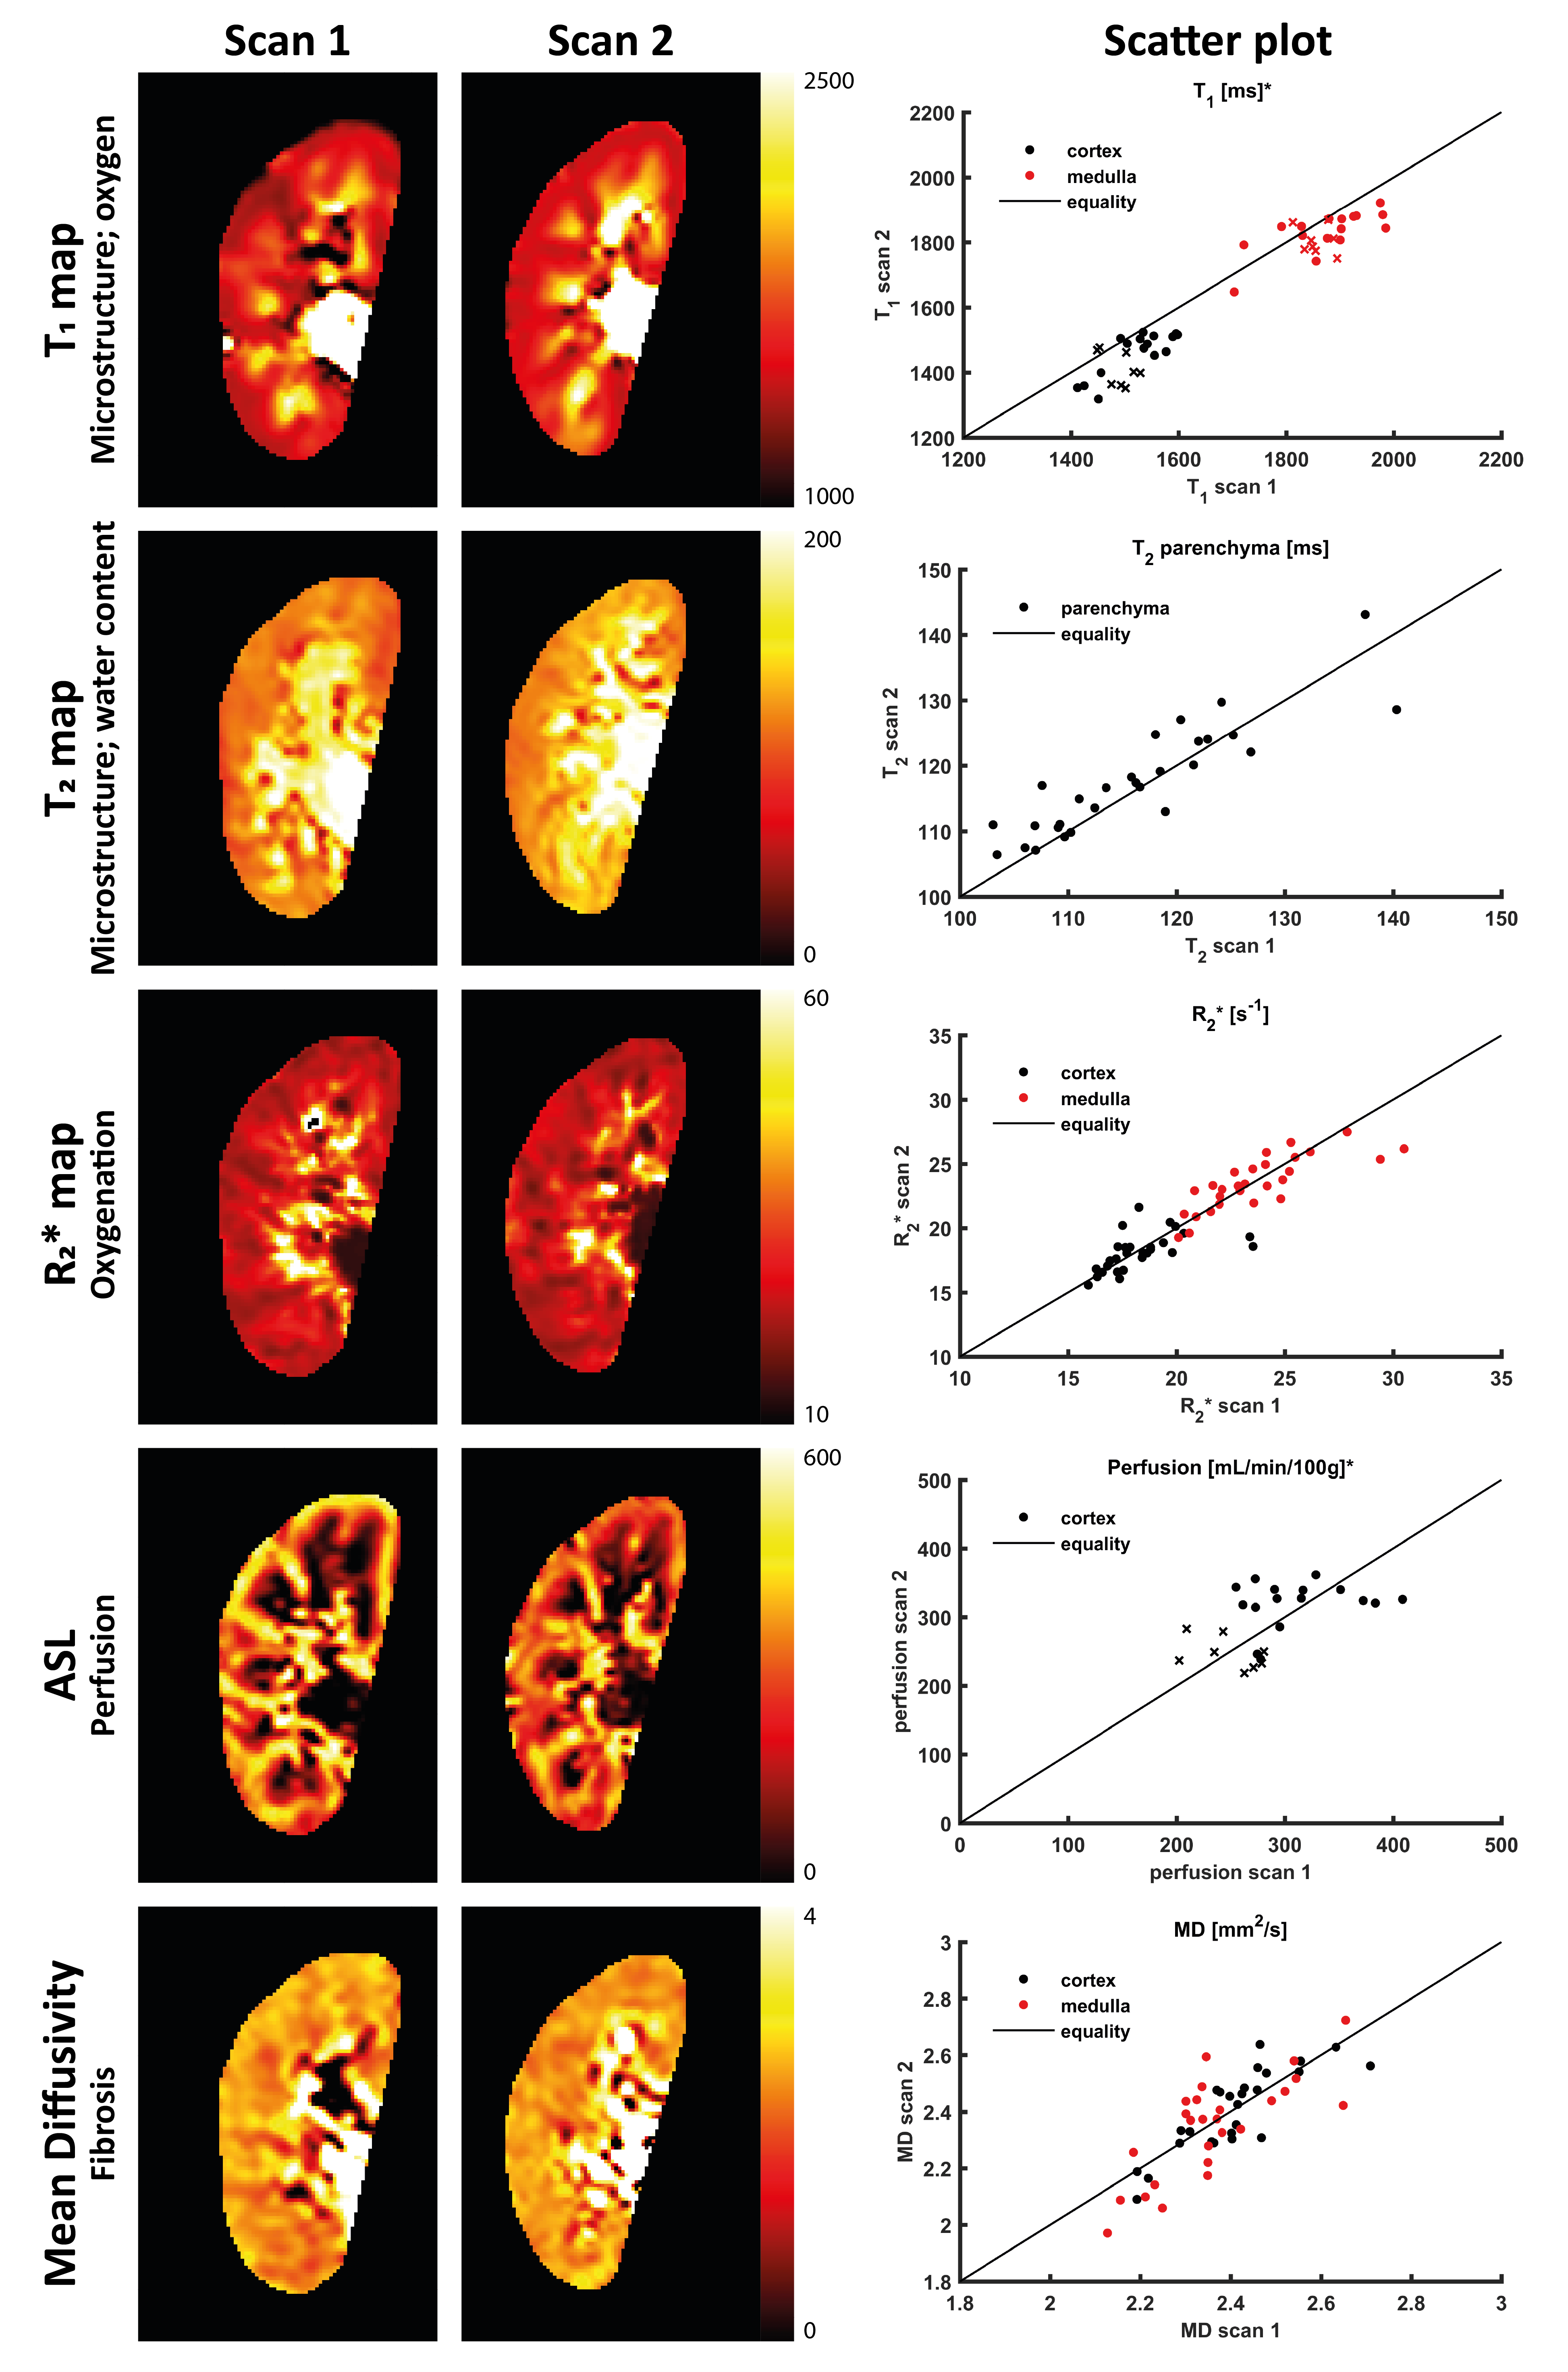
Figure 1: Parameter maps of the right kidney of a single subject for the first and second scan acquired at two different visits, accompanied by scatter plots of the measurements in all volunteers. *: For the T1 map and the perfusion maps, the initial four volunteers were scanned in both sessions with a slightly different scan protocol, in de scatter plot denoted with a cross.
ASL arterial spin labeling; MD mean diffusivity
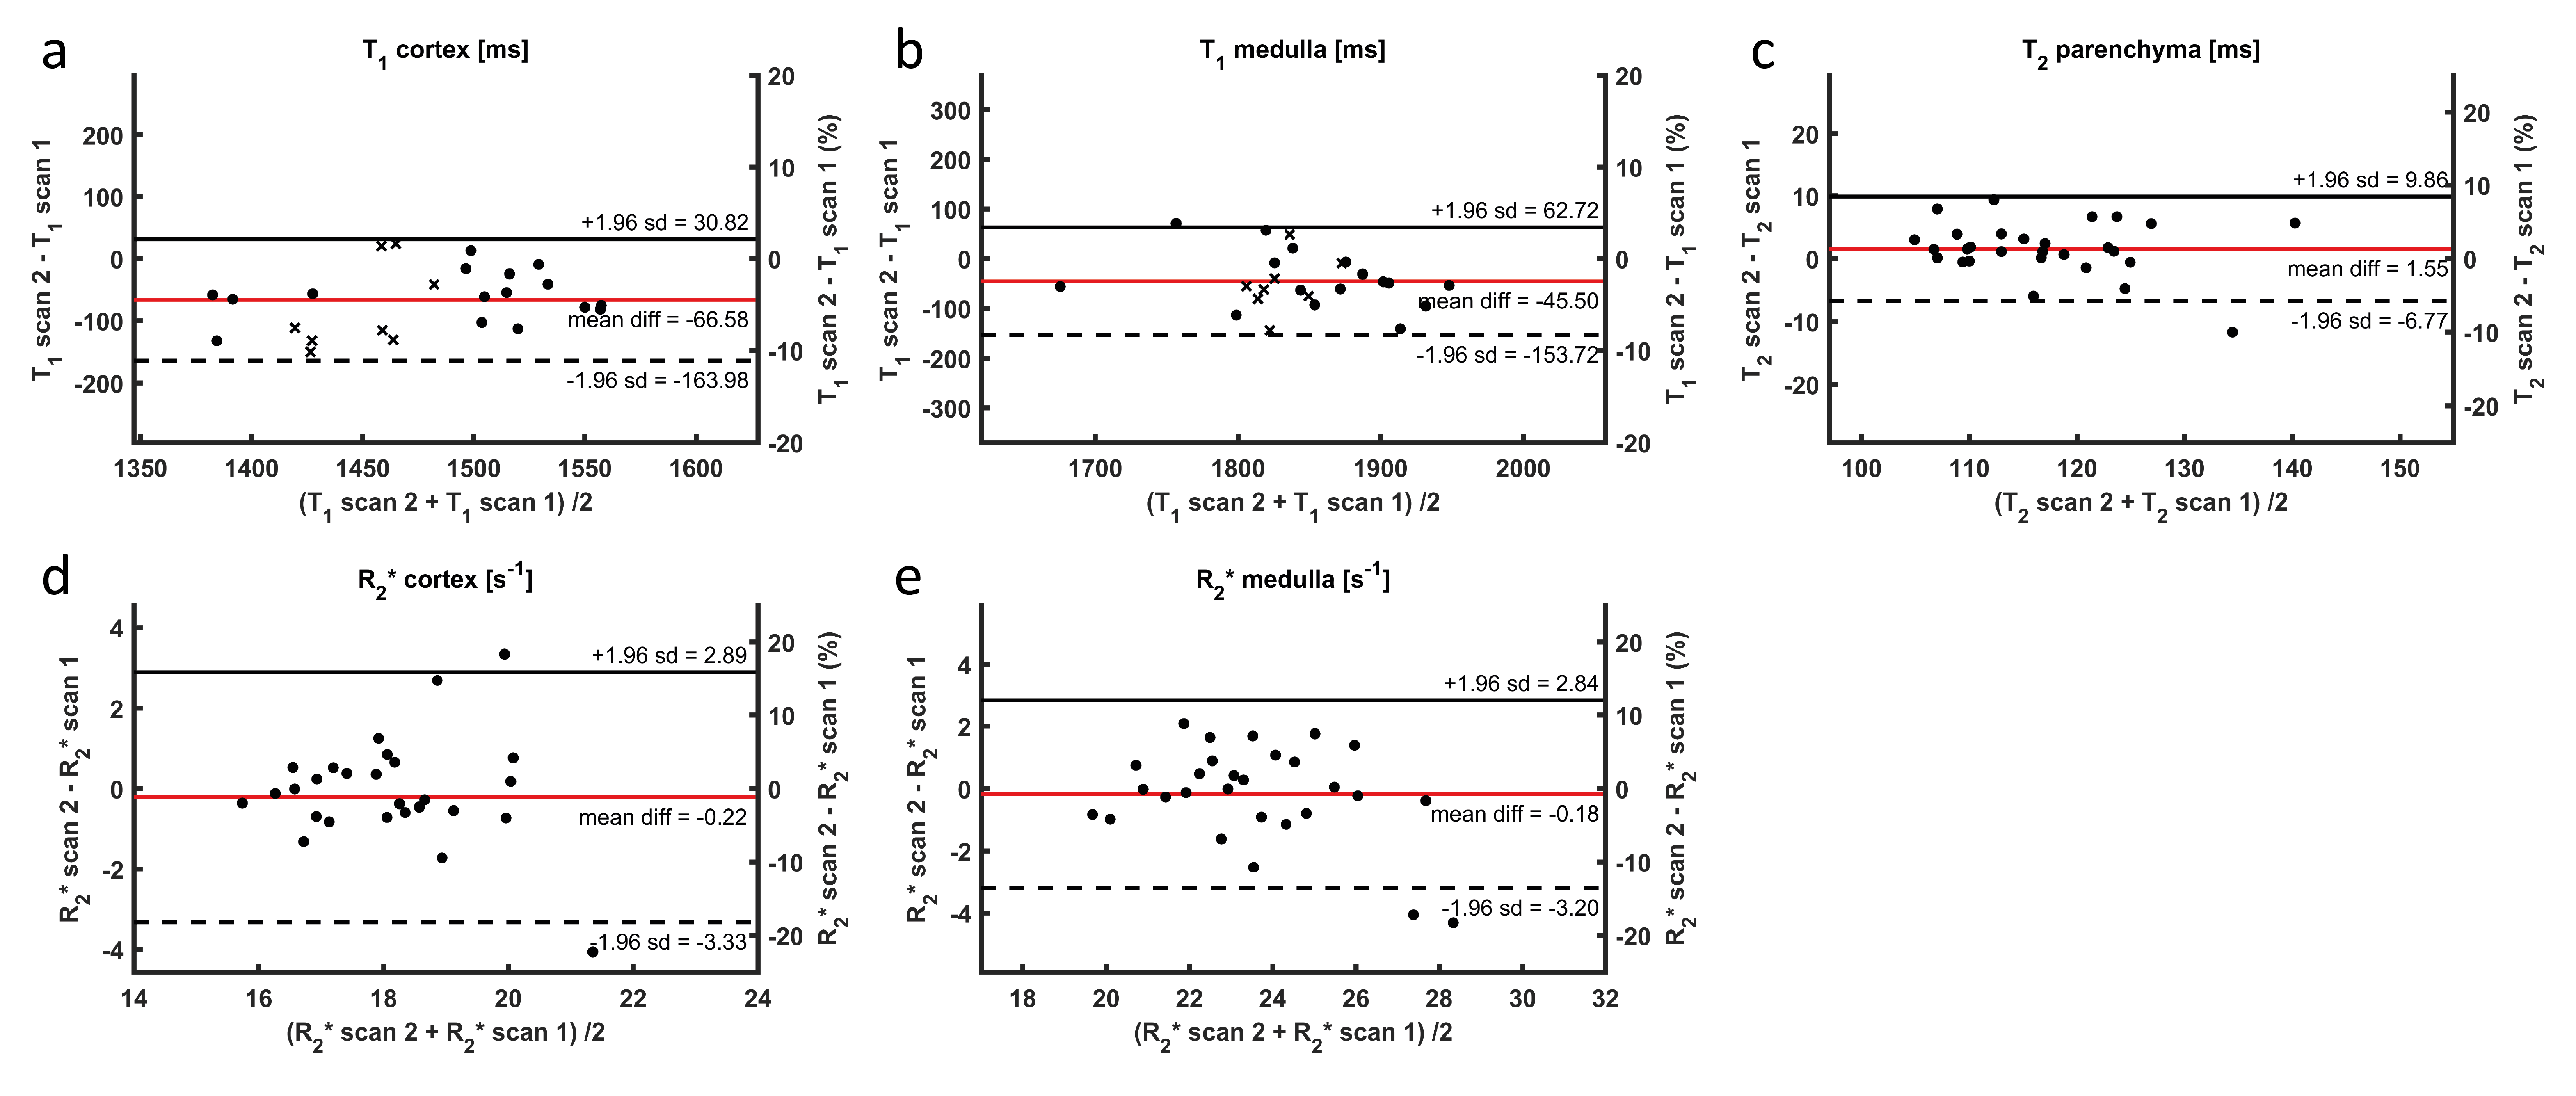
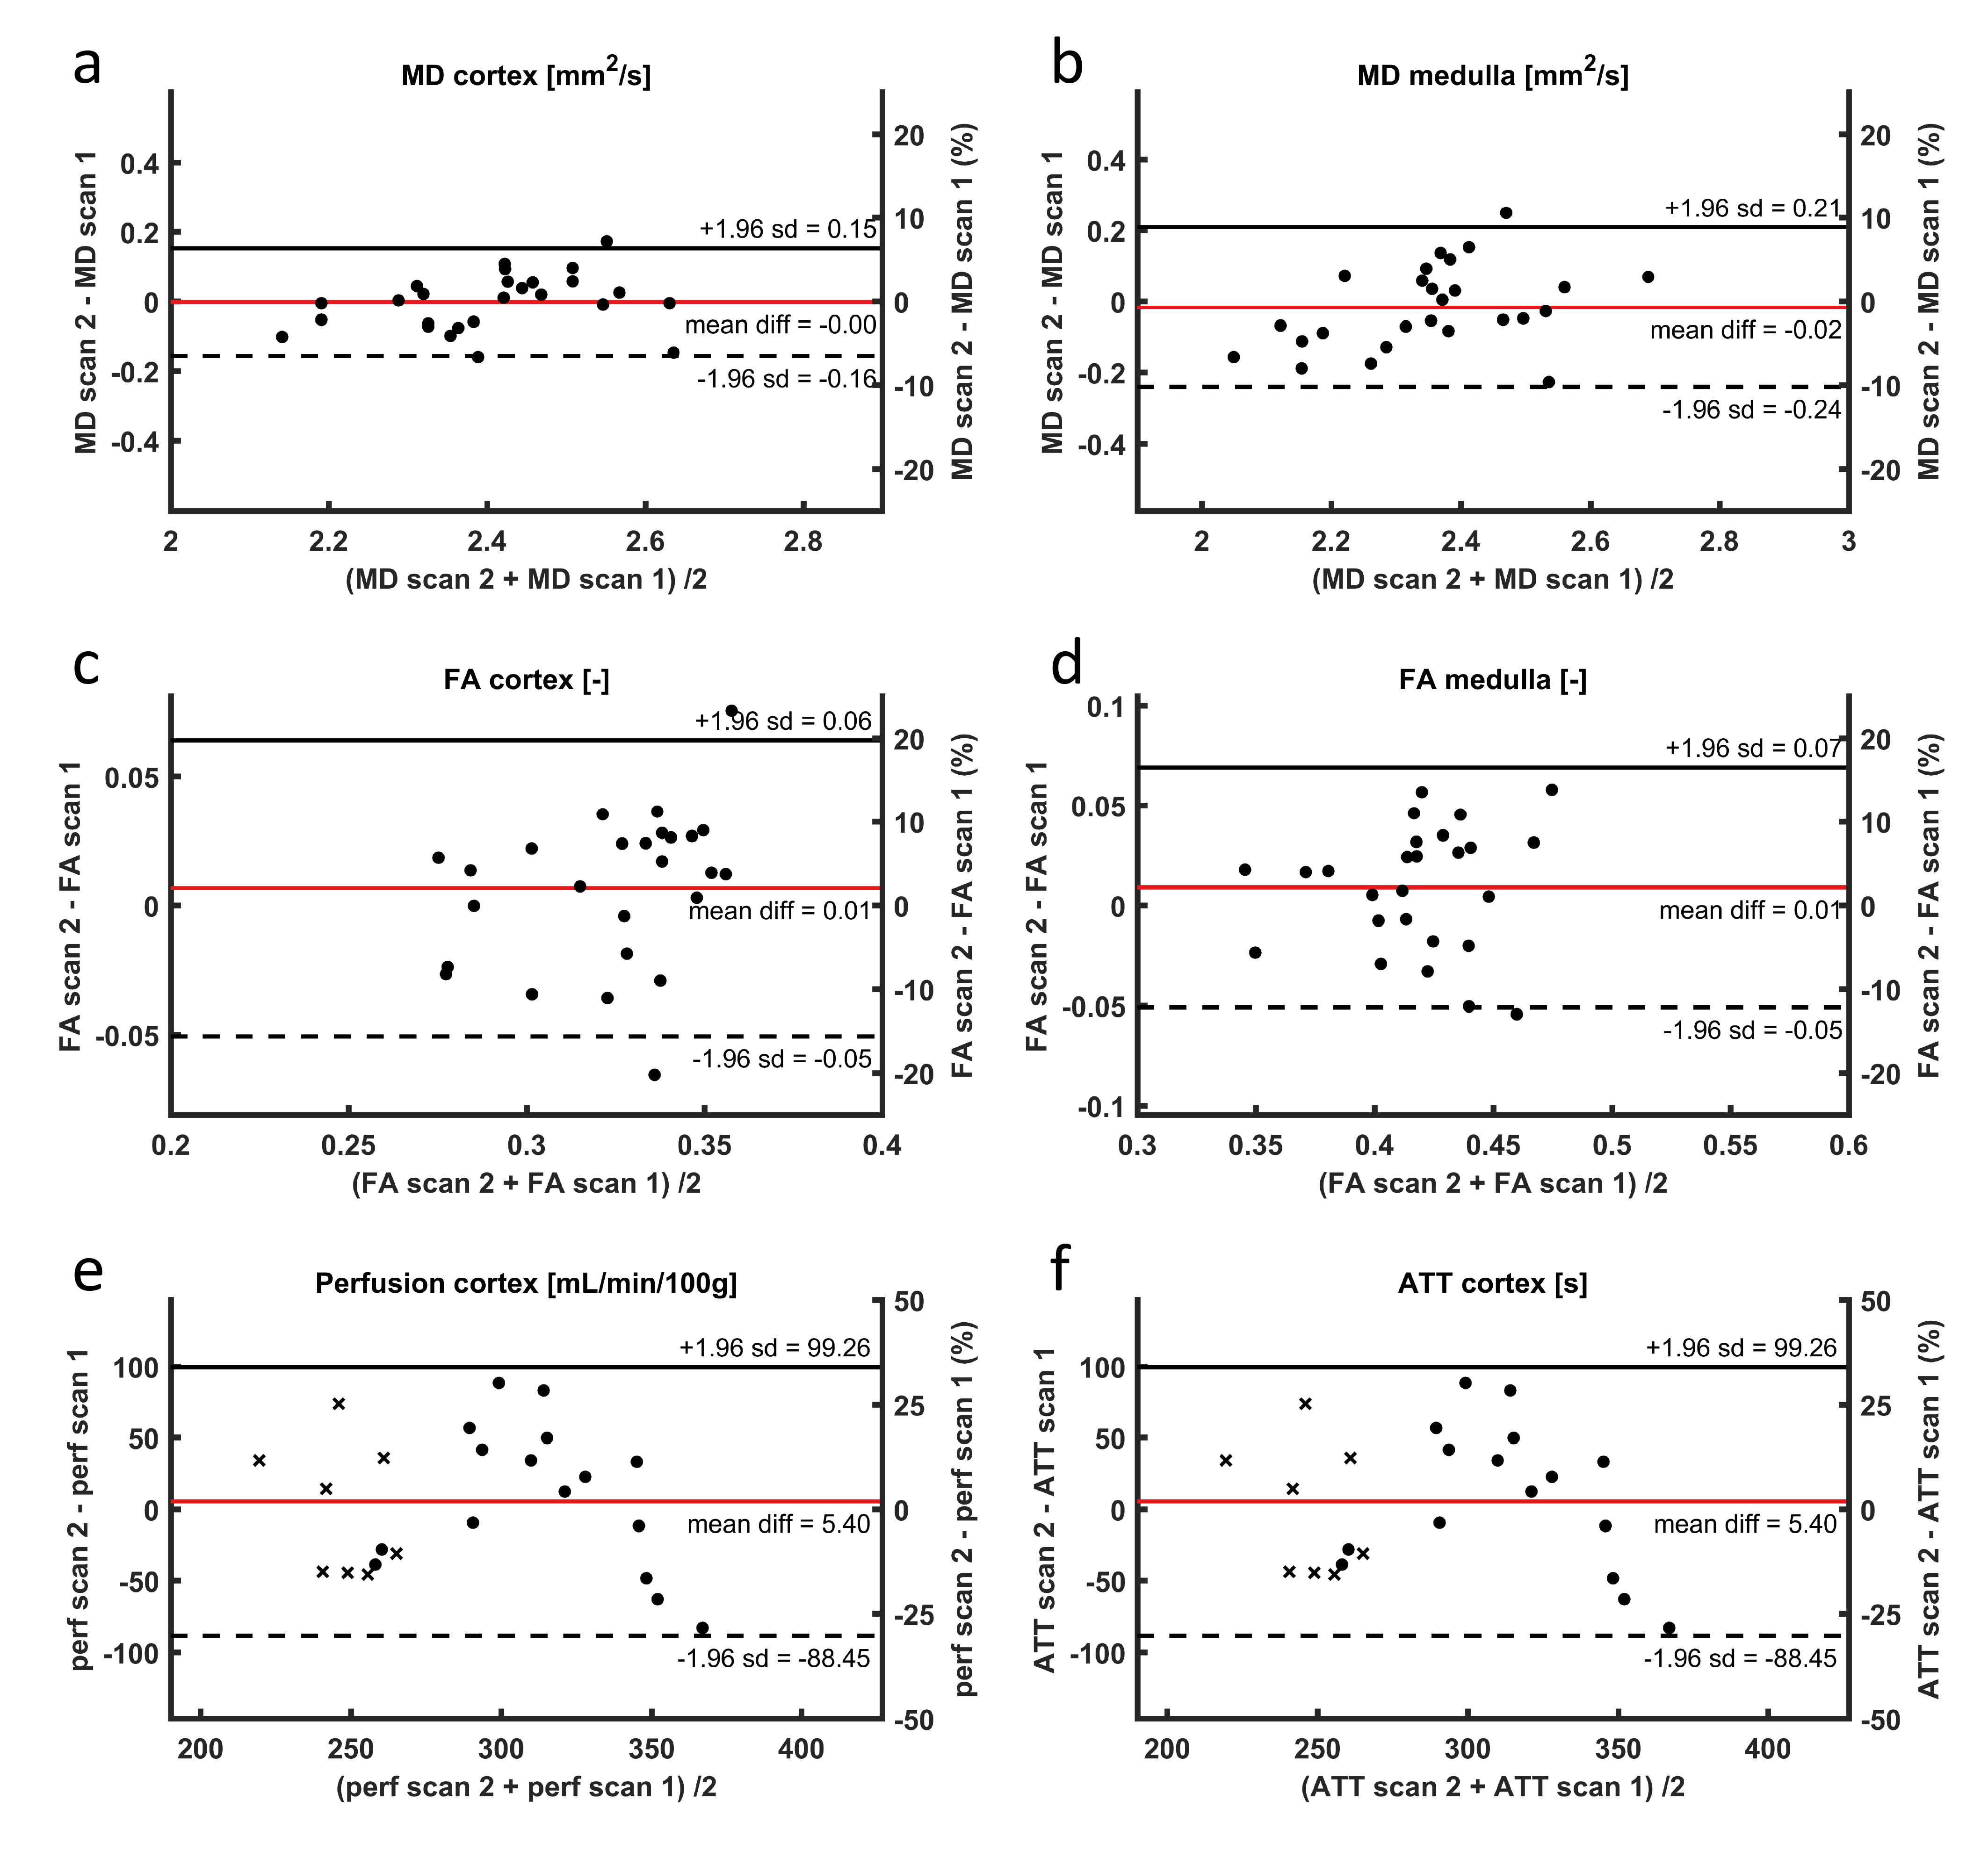
Figure 3: Bland-Altman plots for DTI and ASL-FAIR. The left y-axis shows the absolute differences, whereas the right y-axis shows percentages. Note, in e) and f) the right y-axis is scaled from -50 to 50%, reflecting the larger variability in perfusion and ATT measurements. For perfusion measurements, measurements made with a slightly different protocol (see table 2) are denoted with a cross.
DTI diffusion tensor imaging; ASL-FAIR arterial spin labelling flow attenuated inversion recovery; MD mean diffusivity; FA fractional anisotropy; ATT arterial transit time