1202
Unbiased MRI Assessment of Renal Tubular Volume Fraction with Data-Driven IVIMJoao Periquito1, Min-Chi Ku1, Kathleen Cantow2, Erdmann Seeliger2, Bert Flemming2, Thomas Gladytz3, Dirk Grosenick3, Thoralf Niendorf1,4, and Andreas Pohlmann1
1Max Delbrueck Center for Molecular Medicine, Berlin, Germany, 2Institute for Vegetative Physiology, Charité – Universitaetsmedizin Berlin, Berlin, Germany, 3Physikalisch-Technische Bundesanstalt (PTB), Berlin, Germany, 4Experimental and Clinical Research Center, a joint cooperation between the Charité Medical Faculty and the Max Delbrueck Center for Molecular Medicine in the Helmholtz Association, Berlin, Germany
Synopsis
T2* mapping does not fully represent renal tissue oxygenation. Tubular volume fraction changes should be considered to correct T2*. Diffusion weighted imaging provides information about in-vivo evaluation of water mobility which can be linked to three sources: tissue water diffusion, blood flow, and tubular flow. In this work we explore the feasibility of assessing tubular volume fraction changes using the non-negative least squares (NNLS) approach that is data-driven and requires no a priori knowledge
Introduction
Renal tissue hypoxia is considered to be an important factor in the development of numerous acute and chronic kidney diseases. Blood oxygenation sensitized MRI can provide quantitative information about changes in renal blood oxygenation via mapping of T2*. Simultaneous MRI and invasive physiological measurements in rat kidneys demonstrated that changes in renal T2* do not accurately reflect renal tissue oxygenation under pathophysiological conditions.1,2 Confounding factors that should be taken into account for the interpretation of renal T2* include renal blood volume fraction and tubular volume fraction.1,2 Tubuli represent a unique structural and functional component of renal parenchyma, whose volume fraction may rapidly change due to alterations in filtration, tubular water reabsorption, or tubular outflow.3,4 Diffusion-weighted imaging (DWI) provides a method for in-vivo evaluation of water mobility. In the kidneys water mobility may be linked to three different sources: i) tissue water diffusion, ii) blood flow, and iii) tubular fluid flow. To account for the tubular volume fraction in renal diffusion assessment the commonly used bi-exponential IVIM modelling,5 was recently extended to a tri-exponential approach.6 Nevertheless, starting values are crucial and fixing some model coefficients is common practice in order to increase fit stability and improve the sensitivity of the model to physiological changes.7 This applies particularly to the tri-exponential model (6 fit parameters), but runs the risk of introducing a bias. Here we explored the feasibility of assessing tubular volume fraction changes using the non-negative least squares (NNLS) approach that is data-driven and requires no a priori knowledge (number of exponential components, starting values, fixed coefficients).8,9Methods
In-vivo experiments with adult female Wistar rats were performed on a 9.4T small animal-scanner (Bruker Biospec, Ettlingen, Germany). A bolus of glucose solution was administered i.v. to induce changes in the tubular volume fraction. We employed a diffusion-sensitized split-echo RARE variant to ensure renal-DWI free of geometric distortion. The b-values were: 0,4,8,12,18,24,34,43,52,75,115,201,300,460,600 and 800s/mm2. To account for the non-isotropic diffusion, images of three orthogonal diffusion directions were averaged. Images were de-noised with a spatially-adaptive-non-local-means filter. ROIs were defined in the cortex(COR), outer medulla(OM) and inner medulla(IM) using semi-automated kidney segmentation (Fig.1)10. The NNLS method8 was implemented by adapting an open-source toolbox9 and used to analyze the measured signal decay of each ROI. The NNLS analysis yields a spectrum of detected exponential components, where each peak represents a (pseudo)diffusion compartment with a mean diffusivity (MD; geometric-mean of peak) and volume fraction (area-under-the-curve). Monte-Carlo-simulations were performed to assess the impact of SNR on the NNLS results.Results
Split-RARE DWI provided excellent image quality with anatomic fidelity and ample diffusion contrast in the rat kidney (Fig.2). Monte Carlo simulations showed that the estimated MD and fraction values deviate from the generated decay signal by <10% for SNRs higher than 400 (Fig.3). SNR levels of the measured in-vivo data always exceeded this threshold, after averaging over each ROI. NNLS revealed three distinct components for all renal layers, at baseline (Fig.4) as well as during hyperglycemia (Fig.5). At baseline these consisted of a slow component (MDslow= 1.78–2.34x10⁻³mm2/s, fslow= 0.76–0.83), intermediate component (MDintermediate= 9.15–9.68x10⁻³mm2/s, fintermediate= 0.14–0.22) and fast component (MDfast= 181–184x10-3mm2/s, ffast= 0.02–0.03). During hyperglycemia significant alterations in the MDs and fractions were observed in all renal layers. While the fslow= 0.14–28 decreased, fintermediate= 0.40–0.73 and ffast= 0.11–013 increased. Furthermore, the MDslow= 0.56–0.87 x10⁻³mm2/s decreased in all regions, as did the MDintermediate= 3.93–4.46x10⁻³mm2/s in the medulla but not in the cortex MDintermediate= 9.38x10⁻³mm2/sDiscussion and Conclusion
This work demonstrates the feasibility of renal tubular volume fraction assessment by DWI in combination with a data-driven IVIM analysis. These unbiased model-free results confirm the existence of the three distinct exponential components in renal DWI data. Baseline MDslow and MDintermediate are in the range of diffusivities reported in previous IVIM studies.7,11 The obtained diffusivities, fractions and their changes during hyperglycemia support the interpretations of slow, intermediate, and fast components as representing tissue diffusion, tubular flow, and blood flow respectively. Even so, it has been suggested that capillary blood flow might also contribute to the intermediate component.7 Observed alterations during hyperglycemia may be explained by expected changes in physiological parameters. Acute hyperglycemia induces osmotic diuresis and increases glomerular filtration rate and renal blood flow,12 which is reflected by the increases in fintermediate and ffast, respectively.12 Probing vascular and tubular volume fractions in the kidney is essential for detailing and interpreting the relations between changes in renal hemodynamics, tissue-oxygenation, vascular and tubular volume fraction under (patho)physiological conditions. Our novel approach is a promising refinement of the common IVIM analysis for the unbiased MRI assessment of renal tubular volume fraction.Acknowledgements
We thank Stefanie Münchberg for technical assistance. This work was supported in part by the Bundesministerium für Bildung und Forschung (BMBF, German Federal Ministry for Education and Research; grants VIP+ 03P00081, VIP+ 03P00082, VIP+ 03P00083).References
[1] Pohlmann et al., Acta Physiologica (2013) 8(2):673-689; [2] Pohlmann et al., Invest. Radiol. (2014) 49(8):547-60; [3] Niendorf et al. Acta Physiologica (2014) 213(1):19-38; [4] Knepper et al. (1977) 12(5) 313-323; [5] Le Bihan et al. Radiology (1988) 168(2):497-505; [6] van Baalen et al., Magn Reson Med. (2017) 46(1):228-239; [7] van der Bel et al., European Journal of Radiology (2017) 91(3) 168-174; [8] Lawson et al., 1974; [9] Bjarnason et al., Journal of Magnetic Resonance 206(2):200-204; [10] Pohlmann et al., Tomography (2017) 3(4):188-200; [11] Zhang et al., Abdominal Radiology (2018) 43(3):655-662; [12] Woods et al., The American journal of physiology (1987) 252(1):65-73Figures
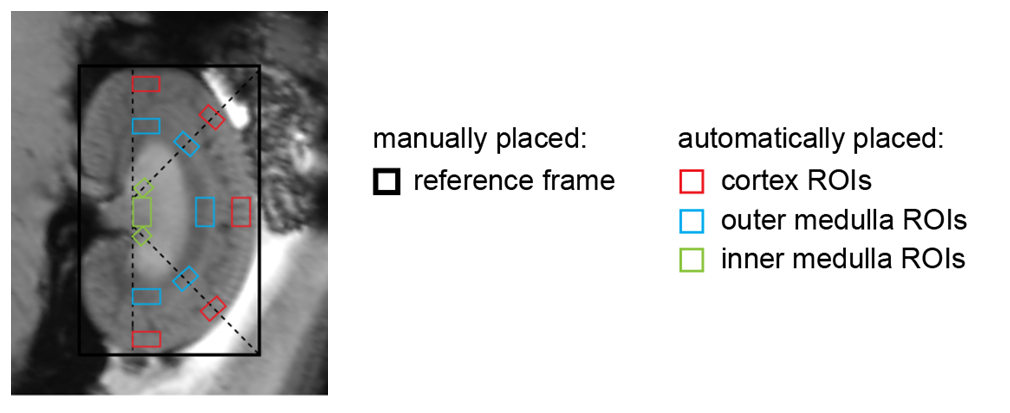
Figure 1: Semi-automated kidney segmentation. A ROI
analysis was performed to obtain representative mean values for each renal
layer. Guided by a manually drawn reference frame and tangents, 13 ROIs were
placed automatically at the locations in the cortex(COR), outer medulla(OM)
and inner medulla(IM).
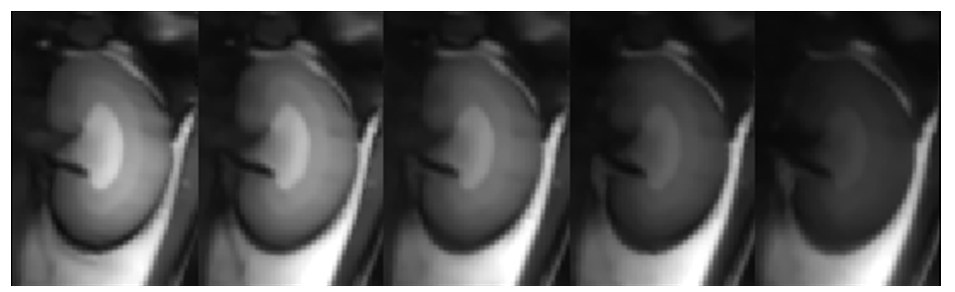
Figure 2: Diffusion-weighted images with some of the
acquired b-values: 0, 52, 115, 300, and 460 s/mm2. Image parameters: ESP=4.6ms,
TR=1.500ms, ETL=96, Matrix size= 192x192, FOV=45x45mm2,
resolution=0.23x0.23x1.5mm.
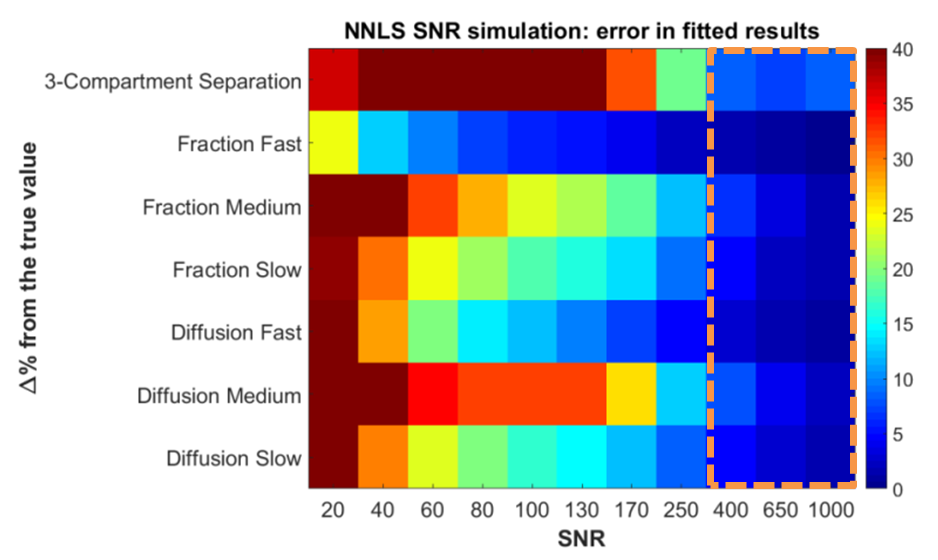
Figure 3: NNLS noise impact assessment by Monte-Carlo-simulations. To mimic the exponential decay a tri-exponential curve with the
following parameters were created: fractionfast=0.15, fractionintermediate=0.35,
fractionslow=0.50, MDfast=150.0x10⁻³mm2/s,
MDintermediate=7.5x10⁻³mm2/s, MDslow =1.6x10⁻³mm2/s. Rician noise was introduced
to a tri-exponential curve with known values, the deviation of fitted values
from the generated values was compared
over different levels of SNR. The region highlighted in orange represents the SNR
levels of the measured in vivo data after averaging over
each ROI.
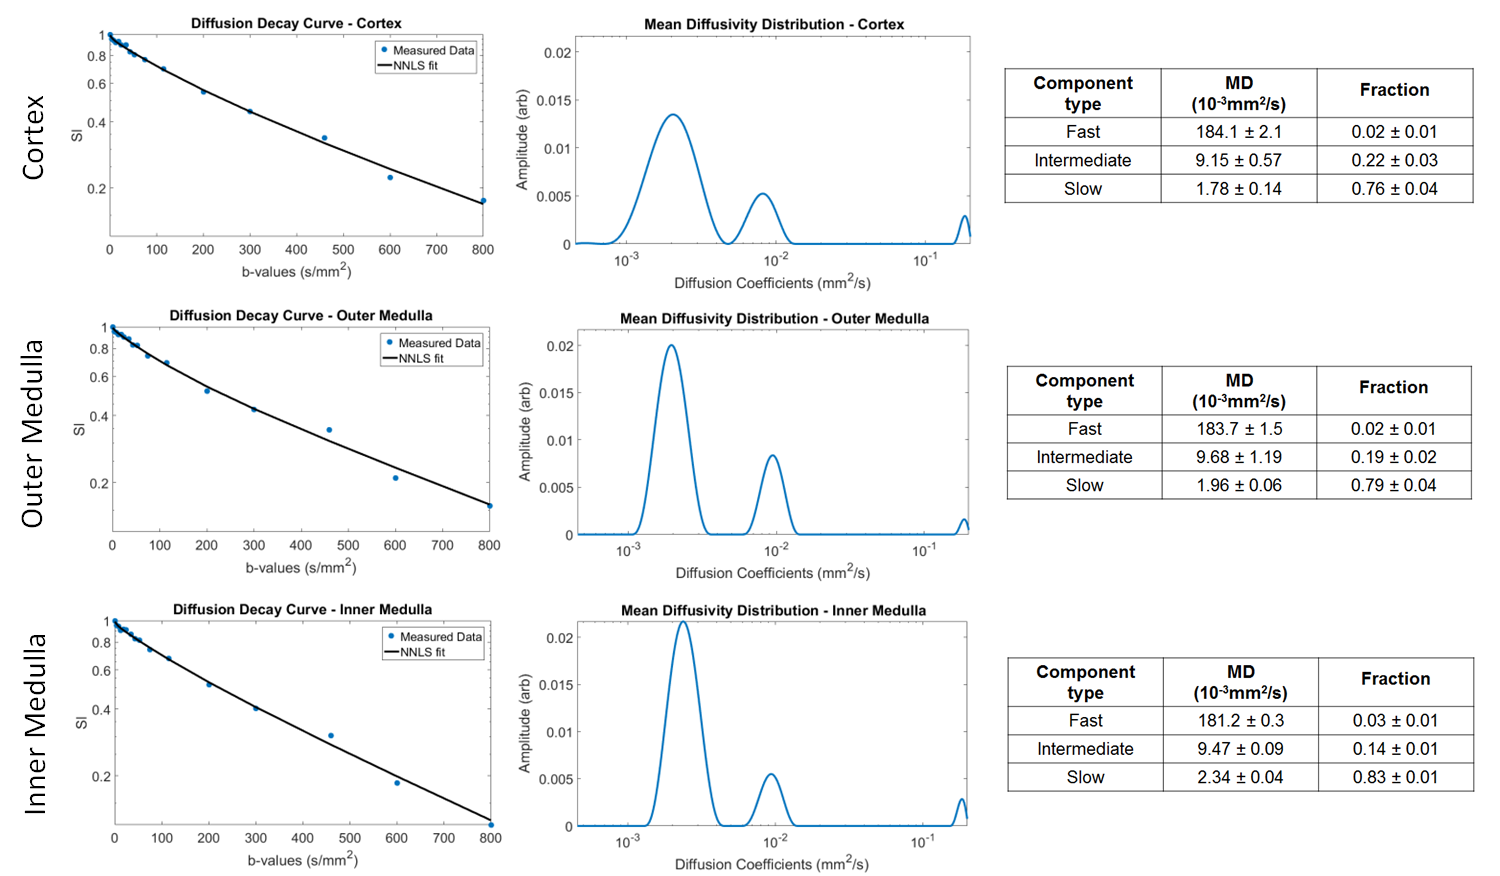
Figure 4: NNLS Analysis post Glucose. The first column shows the normalized diffusion signal decay for each ROI: COR (top), OM (middle) and IM (bottom). The second row shows the NNLS spectrum for each ROI, where slow, intermediate and fast compartment can be visualized. The third column shows the values obtained for each component of the spectrum: fraction (area-under-the-curve) where fractionfast=0.02-0.03, fractionintermediate=0.14-0.22, fractionslow=0.76-0.83 and mean diffusivity MD (geometrical average of the peak) where MDfast= 181–184 x10-3mm2/s, MDintermediate= 9.16–9.68 x10⁻³mm2/s and MDslow= 1.78–2.34 x10⁻³mm2/s.
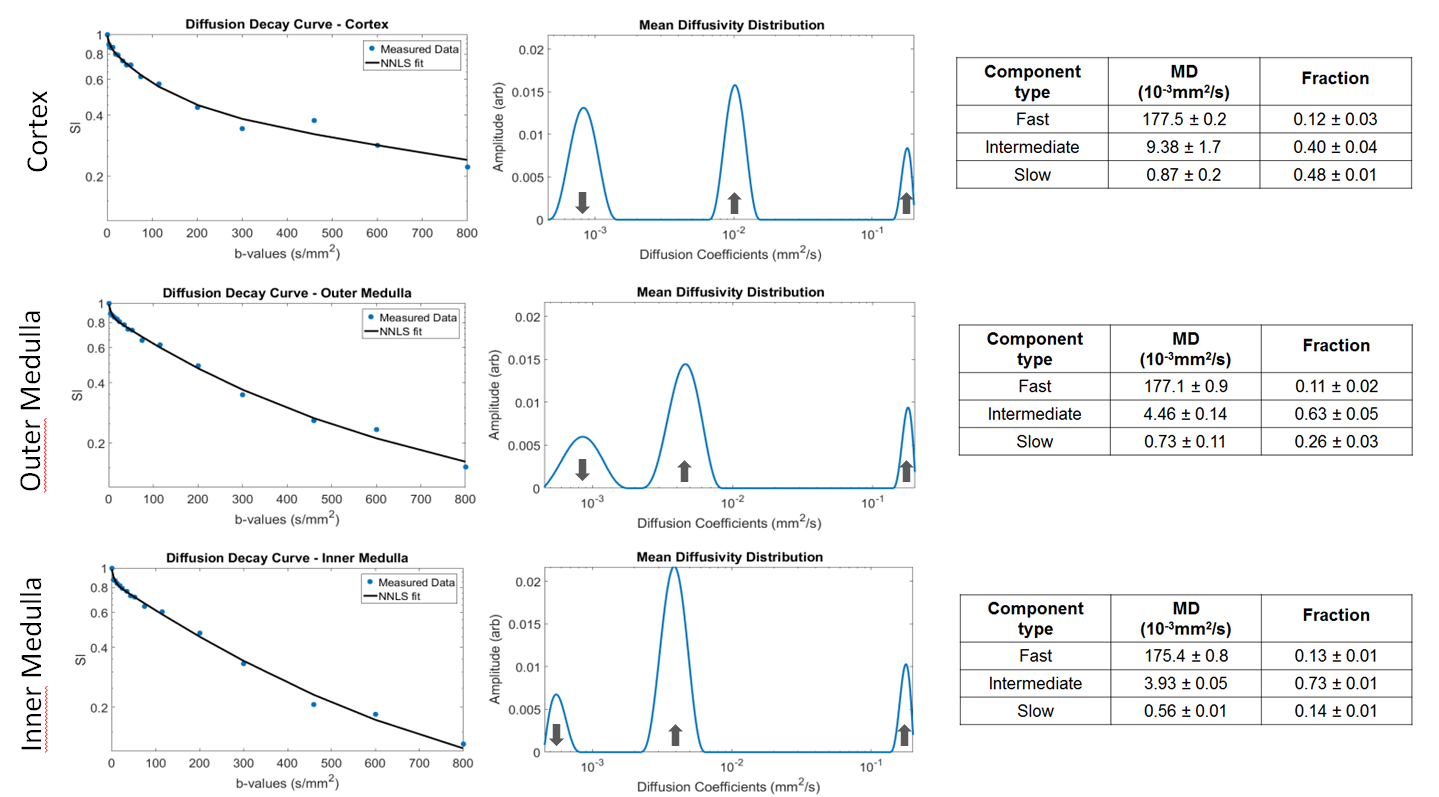
Figure 5: NNLS Analysis post Glucose. The first column shows the normalized diffusion signal decay for each ROI: COR (top), OM (middle) and IM (bottom). The second row shows the NNLS spectrum for each ROI, where slow, intermediate and fast compartment can be visualized. The third column shows the values obtained for each component of the spectrum: fraction (area-under-the-curve) where fractionfast=0.11-0.13, fractionintermediate=0.40-0.73, fractionslow=0.14-0.78 and mean diffusivity MD (geometrical average of the peak) where MDfast= 175–177 x10-3mm2/s, MDintermediate= 3.93–9.38 x10⁻³mm2/s and MDslow= 0.56–0.87 x10⁻³mm2/s.